You know what is rather remarkable? Analysis here does not need to be stretched one wit to justify an extraordinarily bearish posture. That is tonight's first thought. It's how today's trip into new, 2009 high ground becomes "so what."
You probably have heard that, markets typically run both higher and lower than consensus generally expects. We're getting a taste of this. Bottom line, despite growing points of underlying weakness, many technical measures remain disposed on the buy-side of the equation. Hence today's result.
However, the point appears quite near when growing underlying technical weakness will overwhelm greed with fear. Indeed, my general expectation of a turn for the worse expressed over recent months is but being confirmed by all the simple technical evidence I present here from time to time. As always it's important this confirmation continue.
Most generally speaking, there's a solid case for claiming the stock market's path of least resistance points lower. Furthermore, the ultimate collapse I am anticipating still could be months away — possibly even more than a year.
Remember my NASDAQ "like from like" presentation? It was to suggest how past might be prologue, and recently was revisited because prologue is, indeed, mimicking the past.
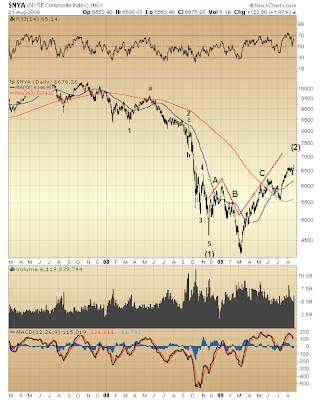
Well, let's consider a similar view of things where the big money is: the New York Stock Exchange. How might past on the Big Board be telegraphing what's to come?

Elliott Wave geeks might take issue with my labeling of five waves down from October '07 through November '08. This might not "look right." However no rules are broken. (If you're thinking these five waves down do not channel, you are correct ... yet channeling is only a guideline, and not a hard-and-fast rule.)
Indeed, think of the right psychology this labeling infers in the grand scheme of a bear market whose bottom is nowhere near.
Wave 2 of (1): a bleed them dry affair, symptomatic of unchecked — unpenalized — greed ... whose ultimate underlying weakness was well-spoken by its taking the form of an Elliott Wave "running correction."
Wave 4 of (1): a we must draw the line, right here and now, reaction — more bravado from greed junkies. Soon thereafter the line was drawn (with help from friends in Washington).
I submit much the same psychology as drove trading into the market's May 19, 2008 peak is seen behind today's trade. Sanguine fundamental thinking once again is being displayed by Monetarist Monkeys who mistake walls of money (in the form of AAA-rated credit) for real economy. Indeed, this mindset is the very life blood of CNBC. Being it's business as usual there, the case claiming greed remains unchecked finds social proof every time Maria squeaks.
Likewise, the similarity with May '08 that underlying technical conditions presently display — seen in relation to conditions during declines preceding each counter-trend rally — substantiates reason to believe a decline far worse than occurred during last year's second half still is in the offing.
So, considering that $NYA's collapse occurred many weeks following its May '08 peak, might its further, far more devastating collapse be many months away (rather than at hand, as some suggest)? Might the path of least resistance indeed be lower, yet in such a way as often frustrates and in the end defies the expectations of most?
Considering the question in light of all prior insights gleaned from the market-leading NASDAQ Composite ... this similar "like-from-like," past is prologue $NYA viewpoint, therefore, extends over virtually the entire U.S. stock market a consistent, "equity is dead money" theme for as far as the eye can see.
Helpful, of course, in defending this position is $NYA's Elliott Wave A-B-C correction off November '08 bottom.
(Hat tip to wave B. Its clear, three-wave form — a 5-3-5 zig-zag [down] — puts the whole of trading from November '08 bottom in perspective, and more critically reveals the market's likely [negative] prospect ... simply by the fact a new bear market low was set during its formation.)
What you see drawn above marking $NYA's behavior off November '08 bottom is meant only to show its general A-B-C, Elliott Wave corrective form. The letters do not appear at the conclusion of each respective wave (unlike the labels marking the sub-waves of wave (1)). I hope that's not confusing.
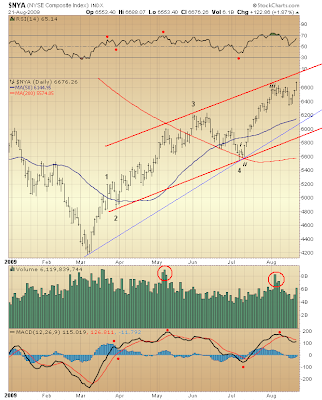
Let's take a closer look at wave C. For as long as it has unfolded I have expected it to subdivide into five component waves. This expectation appears nearly met...

You see typical RSI behavior during the formation of five waves up, with wave 4's weaker than wave 2 relative strength indicating an approaching end of the five wave advance off March '09 bottom. That wave 5 RSI is besting wave 3 comes as little surprise, because what's unfolding is a massive wave C — a third wave, typically the most dynamic of all Elliott Waves.
Too, we see momentum behaving quite typically and in a fashion demonstrating growing weakness. Unlike the case with RSI, wave 5's MACD has failed to best wave 3's. Furthermore, this measure presently is fading fast. Surely, the market's advance appears nearly complete.
The circled volume spikes coincide with a third wave's completion: specifically, waves iii of 3 and iii of 5. More wave count confirmation. That the volume spike during wave iii of 5 was less than occurred during wave iii of 3 offers more wave count confirmation still (think third wave dynamics; a third wave of a third wave — wave iii of 3 — likely would be most dynamic).
Per today's volume on a breakout to new 2009 high ground, well, on a scale of 1-10, rating each day's volume since March '09 bottom, today was a 4 at best. Nothing to chirp about. Except where's the fear that makes for increased selling as prices advance (a.k.a. the "wall of worry" the market is said to climb)? What incredible percent are we up from bottom? What ungodly percent did we lose just last year? So, where's fear?
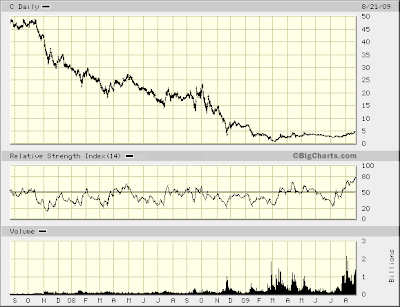
Long holders must be doing their best Citigroup imitation...

Withholding sales until well after prices collapse. Living the dream only to find the dream isn't real.
Such apparently is mankind's way...

* * * * *
© The Risk Averse Alert — Advocating a patient, disciplined approach to stock market investing. Overriding objective is limiting financial risk. Minimizing investment capital loss is a priority.
Analysis centers on the stock market's path of least resistance. Long-term, this drives a simple strategy for safely investing a 401(k) for maximum profit. Intermediate-term, investing with stock index tracking-ETFs (both their long and short varieties) is advanced. Short-term, stock index options occasionally offer extraordinary profit opportunities when the stock market is moving along its projected path.
Nothing is set in stone. Nor is the stock market's path of least resistance always known. More often than not, there are no stock index option positions recommended.
 There's an easy way to boost your investment discipline...
Get Real-Time Trade Notification!


