Wednesday, April 30, 2008

Stocks to Fry More Americans Than Global Climate Change


Just like yesterday, everything went as we would want. A narrowly confined advance, much as unfolded early-October '07, appears straight ahead (at least in some similar form). There should come several "Aha!" technical divergences as the stock market rises to its top from here. At least that's the plan.


$OEX

At this point I should think we might see a break from the price-RSI pattern's similarity to last October '07, though. Now would be a good time for the several "Aha!" technical divergences I'm expecting to begin taking form.

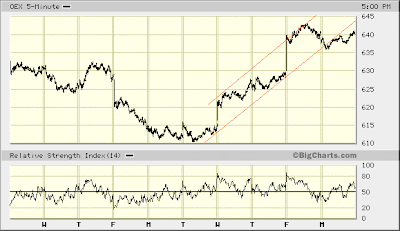
Looking at the arbitrary lines drawn on the above S&P 100 chart, the top line has had several touches, and appears a barrier of sorts. A move to the bottom line could be in store. This [probably] would demonstrate a certain break down of buying support. Then following ... as the S&P 100 makes a final charge higher (to the top line) ... should come the kind of technical divergences typically coinciding with a stock market that is about to accelerate lower.

And that is when the game will begin.

By the way... This is a game a lot like "Deal or No Deal." Its playing impacts your psychology toward making money ... as your prospects build for making even more.

This is one reason why I choose to limit my stock index options speculations exclusively to points in time (like now) when I, an Elliott Wave Guy, am relatively certain about both the stock market's direction and the power behind its likely move.

You've heard the saying, "Time is money?"

You would be hard-pressed to find anything outside of the options game where this saying has more meaning. With options timing is everything. So, the faster the move the better. And a declining stock market is best of all. Fear simply is a powerful emotion. Its demonstration becomes pronounced when the market threatens loss.

Given this, then, that is why I pick my spots, and why I limit my risk to such a pittance ($500).

I strongly advise you do the same. Bulls make money, bears make money, and pigs get slaughtered. When you see how quickly $500 can be multiplied into a small fortune, you might better understand how easy it is to become a pig. Don't do it. You will give it all back. Wait for opportunities like the one coming ... whose probability I have stated (for the record) is 70%.

Play only then. You see with your own eyes how short-term analysis I bring has needed to be flexible. That's just the nature of the game. Simply put, most of the time you cannot call the stock market's every zig and zag. But sometimes (and only sometimes) you can. The best of times generally arrive in big moves you recognize a million mile away...

Okay...


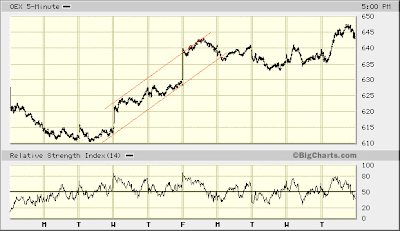
OEX 5-min

Imagine yourself a big-shot market player. The Fed show is over. Uncertainty apparently still reigns. This afternoon's break came with some unexpected strength ... following a price-RSI divergence at today's top ... and this late-day sell-side strength was not erased in the last hour of trading. So, are you more likely to jump in with both feet, or will you only, at most, stick in your toe?

Think of this with the past eight days in mind — a rather tortured move higher, suddenly and strongly turned over today.

Thus, I suspect pressure could develop here stalling any immediate prospect for a move higher (particularly any advance that might defy my near-term outlook forecasting the stock market is quite near a hard turn lower).

Of course, this is just an intelligent guess no different than any others I have made these past two months. Yes, there's been some regularity of correctness. No, I'm not Tony Nelson and I haven't found a genie.

For all you Elliott Wave doubters out there ... the proof is in the pudding.

With that in mind, then, what else can I say?

Patience pays mad money when it's like playing "Deal or No Deal" with x-ray vision into the briefcase containing $1,000,000.

Superman says stay tuned.

* * * * *

© The Risk Averse Alert — Advocating a patient, disciplined approach to stock market investing. Overriding objective is limiting financial risk. Minimizing investment capital loss is a priority.

Analysis centers on the stock market's path of least resistance. Long-term, this drives a simple strategy for safely investing a 401(k) for maximum profit. Intermediate-term, investing with stock index tracking-ETFs (both their long and short varieties) is advanced. Short-term, stock index options occasionally offer extraordinary profit opportunities when the stock market is moving along its projected path.

Nothing is set in stone. Nor is the stock market's path of least resistance always known. More often than not, there are no stock index option positions recommended.


There's an easy way to boost your investment discipline...

Get Real-Time Trade Notification!

Tuesday, April 29, 2008

Stock Watcher Sees a Freak Show Beneath the Veneer


A quick word about the present period's similarity to last September '07... It looks more like early October '07 right now. That's very close to the turn.

Today went down as I would have liked. It could go either way tomorrow ... and still be what I would like.

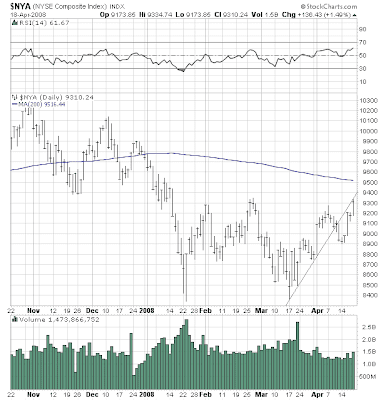
Yesterday I fretted about the stock market bursting higher ... were indexes, like the NYSE Composite, to reach the area of their 200 day moving averages. Today, the view of the day has the moving average proving a decisive barrier. And that's how I would like it.


$NYA

Just look at the late December '07 through January '08 decline...

That is what's coming.

I think...

I'm actually pretty sure...

Some days more than others.

All I know is Patience Pays.

And that is a point I want to raise. My intention here has been, first, to prepare for a stock market melt-up. This will be a good time to position your retirement account 100% long the stock market, diversified in whatever way you prefer. It's how best to stay ahead of inflation ... and actually grow.

There will come a time — it might come quickly, too — when you will be best off 100% out of the stock market. This coming moment will be much like now, when you could, say, borrow $500 from your 401(k) and speculate using stock index options. This only to play an anticipated decline of at least 10% in the stock market. Then, subsequently ride a sharp advance likely to follow, using the low 5-figure gain made during the decline. Here you will be poised to make high 5 figures, minimum.

All that (and a bag of chips) with just $500 to start.

So, that's what the Risk Averse Alert is about. Right now, we're waiting for the game to start. Then, when it all goes down ... literally ... I will say, "Take my hand, child, come with me. It's to a castle I will take you. Well, what's to be they say will be..."

But just for this unique opportunity. This is the sweet icing of my smart and simple retirement investment strategy.

Sometimes with the stock market you should be all out. And when you are, times like these present extraordinary profit opportunities using stock index options.

My approach is smart simply because an Elliott Wave Guy sees "the stock market." This I did in January 2000 and February 2003.

The stock market has a long history. Stocks are, by far, the most lucrative financial asset. So, why strain your brain over bonds? Historically, they vastly under-perform stocks.

Keep your eye on one thing: you're in or you're out ... generally ... (sometimes you might be both).

The simple matter of your focus is one: the stock market. Most of the time it rises. Then ... invest and diversify.

Sometimes, though, the stock market falls. Sometimes quite substantially. And the easiest thing to do is just get out of the way.

That's my retirement strategy's simplicity. It's also good for life, because in the stock market risk is risk and opportunity is opportunity no matter what your age.

Many have benefited by me.

...I remember asking my Dad in the summer of 2001 how it felt to miss the stock market's crushing decline (he was heavily invested in NASDAQ issues January 2000). In three words and with a smile he said, "It felt great." How's that for a lifetime memory?

I'd like to know 100,000 more people who will say the same after they miss the train wreck I believe is coming. (That's Dow 3600.)

There are millions of retirement investors to save...


PROOF THIS GAME IS ALL ABOUT MONEY!
(Here's What We're Hoping For Right Now...


... And Not Another Night of the Long Knives)

* * * * *

© The Risk Averse Alert — Advocating a patient, disciplined approach to stock market investing. Overriding objective is limiting financial risk. Minimizing investment capital loss is a priority.

Analysis centers on the stock market's path of least resistance. Long-term, this drives a simple strategy for safely investing a 401(k) for maximum profit. Intermediate-term, investing with stock index tracking-ETFs (both their long and short varieties) is advanced. Short-term, stock index options occasionally offer extraordinary profit opportunities when the stock market is moving along its projected path.

Nothing is set in stone. Nor is the stock market's path of least resistance always known. More often than not, there are no stock index option positions recommended.


There's an easy way to boost your investment discipline...

Get Real-Time Trade Notification!

Monday, April 28, 2008

Suffering the Ritual of Waiting on an Irrelevant Fed


I know what I would like to see... Whether I will, though, remains a mystery.

My uncertainty simply is how much higher the stock market will rise before turning sharply lower. The present similarity to the September '07 period simply cannot be ignored.

Yet, the more I look at the March 17, 2008 low, the more certain I am about indications the stock market is near a turning point that will carry indexes still lower. So, when will she blow?

Well, like I said Friday, "[W]e will like seeing further divergences making it really easy to know when to say when." We got no help on this front today. As flat and dull as trading was, all indications suggest a continuing rising trend.


$OEX

At this point I'd like to believe the 200 day moving average presents something of a barrier. However, if during this week an advance covers the remaining distance, I suspect the S&P 100 will go still higher before the kind of technical divergences I am waiting for will develop.

I mention this because I'd rather not miss the profit opportunity of a strong move higher. And as I have indicated the past couple days, higher is where the stock market looks like it wants to go (though its advance might just continue to be strained, much as it has been).


OEX 5-min

Did a crack form during today's last hour of trading? RSI certainly diverged as the S&P 100 approached last Thursday's (4.24.08) high, then decidedly fell going into today's close, ending right about at lows reached last week. So, will the S&P 100 once again bounce?

My suspicion is it will not. Last Thursday's (4.24.08) advance to new (post-March 17th) high ground itself registered an RSI divergence relative to the Friday previous (4.18.08). Add to this further RSI divergence Friday (4.25.08) and today, and I am anxious to see what develops from here.

It could be the beginning of the end of the bounce off the March 17, 2008 low, subsequently resulting in the sort of technical divergences signaling the imminence of the sharp decline to new multi-month lows I am forecasting.

Or, it could complete the consolidation of the stock market's most recent advance during April options expiration week (4.14.08 - 4.18.08) and set up the stock market to rise still higher, possibly in a burst of buying.

Or, quite possibly, my present uncertainty about what's going on right now might continue for another day or three...

* * * * *

© The Risk Averse Alert — Advocating a patient, disciplined approach to stock market investing. Overriding objective is limiting financial risk. Minimizing investment capital loss is a priority.

Analysis centers on the stock market's path of least resistance. Long-term, this drives a simple strategy for safely investing a 401(k) for maximum profit. Intermediate-term, investing with stock index tracking-ETFs (both their long and short varieties) is advanced. Short-term, stock index options occasionally offer extraordinary profit opportunities when the stock market is moving along its projected path.

Nothing is set in stone. Nor is the stock market's path of least resistance always known. More often than not, there are no stock index option positions recommended.


There's an easy way to boost your investment discipline...

Get Real-Time Trade Notification!
Friday, April 25, 2008

Wall Street Like the Night Titanic Sunk


It's like the final day's sail on the most magnificent ship in the world ... full steaming ahead on a calm, still sea ... in iceberg-filled waters. An image of the night the Titanic met its tragic doom is perfectly suited here. Not to recall the ship's sinking. Rather, the prevailing psychology prior to it striking an iceberg.

Let me put it this way...

If the stock market trips, the drop to bottom should be quick. Indeed, circumstance supports the likelihood of a swift reversal of [near-term] fortunes. This despite appearances the market looks like it wants to go still higher...


OEX 5-min

The heretofore 60% probability I have given to the March 17, 2008 low holding up is, for the record, being lowered to 30%. Given a wealth of evidence, the stock market seems far more likely to visit the edge of the precipice I revealed last weekend.

First, take into account indications I've presented these past couple days suggesting the stock market might be near a turning point. Let's see, I brought out the Bullish Percent and the CBOE Put/Call Ratio (and peppers and sardines for Pantangele). Assuming the stock market's multi-month quandary has not ended — and here, I am, because, indeed, I must — you get the idea a turning point is near when putting these (and other) indicators to a comparative analysis.

Speaking of the Put/Call Ratio... On the sentiment front, I should add something related ... for your edification: pros principally use OEX options to hedge equity positions. They're buying insurance.

So, when Call open interest is rising faster than Put open interest, pros are hedging short equity positions; they're bearish. Oddly, that's what they've been doing this past week ... despite all appearances the stock market wants to move higher.


$NYA

The volume picture from the March 17, 2008 low proves itself the exception to the rule there's no sense beating a dead horse. I've been doing it for a while. Still, the index moves higher, yes, just as it wants to ... but each step of the way there's less fear displayed ... fewer shares are being put up for sale ... demonstrating complacency ... perfectly poised for a SMACK.

Finally, go back to the NYSE McClellan chart again...

During January's dive the NYSE Composite fell below the low it set last August '07. Yet, neither the NYSE McClellan Oscillator nor the NYSE Summation Index fell as far as they had at that time.

This has been perplexing. Up until now I have been assuming this divergence indicated increased underlying strength supportive of a bottom (which I gave a 60% probability). And in some ways still, this divergence continues representing an element of strength. However, the evidence is mounting it will not be enough to cement the March 17, 2008 low as "bottom."

So, indications a turning point is near ... shown in stuff I have noted the past couple days ... and stuff I have covered for several weeks questioning the viability of the March 17th low ... suggests these NYSE McClellan divergences might more accurately be indicating a bottom is near, even though it is not yet in.

The Elliott Wave Guy lives. And all things, taken together, suggest a relatively frightful fall will occur before "the" bottom is here. I am by no means going out on a limb giving this likelihood a 70% probability. I think it's going to rain.

That is for the record.

After the storm, "the" bottom probably will be in. Then, at long last, it will be all heads up for a melt-up. Yes, that's the ticket. It fits perfectly in the eyes of an Elliott Wave Guy. You don't need to understand because I'm not sharing. You just need to see. And that is the plan I have here.

So, here's the deal. Chances are a desirable pick-up in volatility soon will bring pronounced moves in the stock market. First, lower, and probably hard ... then, sharply higher ... dead ahead.

But before it all goes down, we will like seeing further divergences making it really easy to know when to say when.

Are you really ready to make some serious money?

The time is nearly at hand.


Titanic Will Founder


* * * * *

© The Risk Averse Alert — Advocating a patient, disciplined approach to stock market investing. Overriding objective is limiting financial risk. Minimizing investment capital loss is a priority.

Analysis centers on the stock market's path of least resistance. Long-term, this drives a simple strategy for safely investing a 401(k) for maximum profit. Intermediate-term, investing with stock index tracking-ETFs (both their long and short varieties) is advanced. Short-term, stock index options occasionally offer extraordinary profit opportunities when the stock market is moving along its projected path.

Nothing is set in stone. Nor is the stock market's path of least resistance always known. More often than not, there are no stock index option positions recommended.


There's an easy way to boost your investment discipline...

Get Real-Time Trade Notification!

Thursday, April 24, 2008

Frank Pantangele Still a Flip-Flopper


Do yourself a favor. Open up the NYSE Composite's McClellan Oscillator in a new window.

Let's analyze the present period compared to a relevant period last year. Look at the stock market's decline starting in July, bottoming in August '07, and then its subsequent reaction higher, extending into October '07.

There's one difference worth noting in the McClellan Oscillator's performance, then versus now ... and this casts some suspicion on whether a strong advance is in order here, such as I wrote about yesterday.

How's that for flip-flopping, Pantangele?

Here's the deal. The McClellan Oscillator's performance during the NYSE Composite's rise from its March 17, 2008 bottom has not been quite as convincing as its performance last August through September '07.

Then the McClellan Oscillator leaped to a significantly higher level ... even higher than it registered prior to the NYSE Composite peaking in July '07. This demonstrated underlying buy-side strength ... the kind of thing to keep the NYSE Composite buoyant ... even as McClellan Oscillator divergences increased right up to the NYSE Composite's early October '07 peak.

Oddly enough, you see the same kind of pattern beginning at the NYSE Composite's January '08 bottom and moving forward to its top late in February. Subsequently, the NYSE Composite declined into its March 17, 2008 bottom.

Now fast forward to the present period since the March 17, 2008 low. The NYSE McClellan Oscillator, though in positive territory (thus, demonstrating buy-side strength), did not launch higher quite so markedly, such as it did off the bottom last August '07. Furthermore, the oscillator already is starting to diverge from the NYSE Composite Index.

The first divergence was at the recent low, about a week and a half ago... Although the NYSE Composite bottomed higher than where it stood in late-March, the oscillator registered a reading lower than where it stood at the same time. This did not happen once from late August through early October '07.

Price-oscillator divergence continued even as the NYSE Composite reached a higher high (post-March 17, 2008) last Friday (4.18.08). You see this all the more when you look at the NASDAQ Composite McClellan Oscillator. The price-oscillator divergence in the present period is stark.

What should I make of this, then? I ask particularly in light of how yesterday I noted there are no RSI or MACD divergences suggesting the S&P 100 was about to turn lower.


$OEX

Is the McClellan Oscillator (both NYSE and NASDAQ) suggesting RSI and MACD might soon turn over?

Let's look again at the CBOE Put/Call Ratio...


$CPC

The MACD on the Put/Call Ratio is behaving a lot like last September '07. It also is in a position coincident (particularly since last July '07) with turns lower in the stock market.

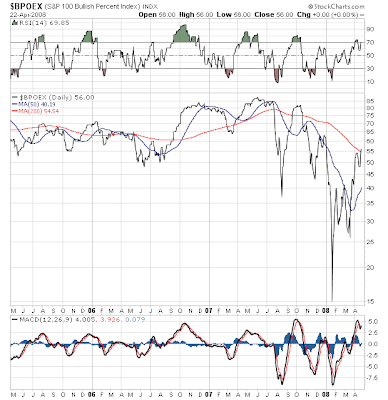
A little better perspective on the similarity now to last September '07 (and prospects the stock market will continue rising from here) might be gained looking again at the S&P 100's Bullish Percentage...


$BPOEX

As you can see, the S&P 100's Bullish Percentage has recovered to a level above its 200 day moving average ... much like it last did late-September through early-October '07 ... just before the stock market turned over.

But...


OEX 5-min

Today's advance above last Friday's high (4.18.08) suggests the stock market might have further to rise.


NYSE 5-min

Although the NYSE Composite did not follow suit, it bounced where you'd expect it to.


NASDAQ 5-min

Appearances the stock market wants to go higher are difficult to ignore.

So, then, given the evidence I've presented thus far, how much higher the market might rise really is the question, I think. Maybe the S&P 100 will peak well-short of its 200 day moving average.

I drew two lines on the 1 year chart of the OEX above. They contain the highs and lows since the March 17, 2008 bottom. Completely meaningless! However, if the S&P 100 rises to the top line, then falls toward the bottom line, RSI and MACD divergences probably would form. Then, some re-test of the March 17th bottom might subsequently be in order.

So, there you have it once again ... another day knowing today's not when to say when ... courteous of Frank Pantangele.


* * * * *

© The Risk Averse Alert — Advocating a patient, disciplined approach to stock market investing. Overriding objective is limiting financial risk. Minimizing investment capital loss is a priority.

Analysis centers on the stock market's path of least resistance. Long-term, this drives a simple strategy for safely investing a 401(k) for maximum profit. Intermediate-term, investing with stock index tracking-ETFs (both their long and short varieties) is advanced. Short-term, stock index options occasionally offer extraordinary profit opportunities when the stock market is moving along its projected path.

Nothing is set in stone. Nor is the stock market's path of least resistance always known. More often than not, there are no stock index option positions recommended.


There's an easy way to boost your investment discipline...

Get Real-Time Trade Notification!

Wednesday, April 23, 2008

Ready to Rise to the Top on a Market Melt-Up?


Yesterday, I said "The retest [of the March 17, 2008 low] might be at hand." And I claimed, "There's much on the [3-year chart of the S&P 100] suggesting this ... from an Elliott Wave Guy's perspective."

Well, there's also a view suggesting "the S&P 100 could, right now, be in a position similar to September '07." I mentioned this yesterday, too. Today, I'd like to take a closer look at this possibility.


$OEX

Both RSI and MACD continue their upward biases ... and both are in positions demonstrating buy-side strength. The same was occurring in September '07 ... after the S&P 100 had bounced off its August low. Just like then (after the initial bounce), the S&P 100 presently is trading more or less sideways with an upward bias ... and with technicals confirming every step of the way higher.

What's more, you don't see any sort of divergences (in RSI and MACD) indicating the S&P 100 is about to turn lower.

So, yes, an advance to the 200 day moving average might be in store.

A bit more encouraging, too, is volume. It being notably elevated than was the case last September '07 supports the case, I believe, suggesting a decided advance might proceed from here.

Who knows, March 17, 2008 might even be marking the start of the stock market's melt-up.

(Make up your mind Elliott Wave Guy! Yes, but in my defense is the fact I have been anticipating a re-test of the March 17, 2008 bottom in the context of it being "only" a 40% probability.)

What say me, then, supporting the possibility the stock market is about to rocket higher? Well, oddly, not one of several benchmark stock indexes has risen beyond last Friday's peak (4.18.08). You'd think this suggests weakness, but in the context of things that make the present moment appear similar to last September '07, it could indicate momentum established last week is being sustained and setting to continue.


OEX 5-min

NYSE 5-min

NASDAQ 5-min

So, indexes are holding up following last week's rather impressive [and surprising] advance. I am rapidly coming to suppose the stock market's multi-month decline might be over. So, let's see how things unfold over the next day or two.

* * * * *

© The Risk Averse Alert — Advocating a patient, disciplined approach to stock market investing. Overriding objective is limiting financial risk. Minimizing investment capital loss is a priority.

Analysis centers on the stock market's path of least resistance. Long-term, this drives a simple strategy for safely investing a 401(k) for maximum profit. Intermediate-term, investing with stock index tracking-ETFs (both their long and short varieties) is advanced. Short-term, stock index options occasionally offer extraordinary profit opportunities when the stock market is moving along its projected path.

Nothing is set in stone. Nor is the stock market's path of least resistance always known. More often than not, there are no stock index option positions recommended.


There's an easy way to boost your investment discipline...

Get Real-Time Trade Notification!

Tuesday, April 22, 2008

Frank Pantangele, Options Analyst, Testifies


Sir, did Michael Corleone tell you the S&P 100 could, right now, be in a position similar to September '07? Could it now rise, say, as high as its 200 day moving average?


$OEX

"Yeah, sure, why not."

And could the S&P 100's narrowing RSI since late '06 be like a spring winding up?

"Look, Senator, there are a lot of people who hope so. As you know, I don't think they'll be disappointed, because ... you know ... Paulson did this, and Paulson did that ... and he's the little guy's man. I'm sure you agree ... despite many in the room who don't."

Sir, how soon do you say the fix will fix the fix, then?

"Just not yet. Word has it the order to push a button on the March 17th low is in. You know, Senator Roth, that lucky T-note the Rosato brothers gave Wall Street to celebrate the deal hasn't been so lucky."

Alright, I'm back...

Several times a few weeks ago I mentioned anticipating RSI rising above its high registered in December '07, and then expecting the S&P 100 subsequently re-testing its March 17, 2008 low.

This appears to be where things stand. The re-test might be at hand. There's much on the above chart suggesting this ... from an Elliott Wave Guy's perspective ... which, by the way, I find rock solid by power it lends to better know when to say when ... a very useful power in the options trade.

However, like I just said ... there's similarity to last September (2007) looking possible, too. So what do I know? (Other than well enough to smell humble pie in the air?) I know now is not when to say when.

Is there anything I strongly suspect?

Yes. No matter which way things unfold over days ahead ... March 17th's low will be re-tested.


OEX 5-min

A decline possibly setting a new multi-month low could already have begun for all I can tell at this point.


$BPOEX

This is just like the NYSE chart I published yesterday. It, too, suggests a turning point here. Bullish repositioning among the 100 stocks making up the OEX might be a bit stretched at the moment ... particular given the S&P 100 is no higher now than it was in February (2008). It might be time for a little test of strength. This is, after all, a war for money (among other things).


* * * * *

© The Risk Averse Alert — Advocating a patient, disciplined approach to stock market investing. Overriding objective is limiting financial risk. Minimizing investment capital loss is a priority.

Analysis centers on the stock market's path of least resistance. Long-term, this drives a simple strategy for safely investing a 401(k) for maximum profit. Intermediate-term, investing with stock index tracking-ETFs (both their long and short varieties) is advanced. Short-term, stock index options occasionally offer extraordinary profit opportunities when the stock market is moving along its projected path.

Nothing is set in stone. Nor is the stock market's path of least resistance always known. More often than not, there are no stock index option positions recommended.


There's an easy way to boost your investment discipline...

Get Real-Time Trade Notification!

Monday, April 21, 2008

Why, Technically Speaking, the Near Trade Looks a Sell


Technical confirmations and divergences are one thing the Elliott Wave Guy uses to get his bearings on the stock market. Today I present one reason why the March 17, 2008 low probably will be re-tested and show how a base for a subsequent stock market melt-up should form.

First, though, on Friday I revealed, "I am afraid a bout of selling worse than I have thus far considered ... could be in store," and said, "I will write about this over the weekend." But then I decided not to. Let me explain...

There have been certain technical non-confirmations that, along with volume concerns and price-RSI considerations, have caught my attention. These don't just indicate a re-test of March 17th's low, at the very least, is probable. They suggest something much worse might be in store.

Now, I don't wish to downplay this possibility. However, it might just turn out these non-confirmations represent added [positive] divergences supporting my view for a pending stock market melt-up. Time will tell.

I could share the details highlighting my concern, but I don't want to bore you any more than I must already. So, I am going to stay on point and keep my sight set on indications the stock market's multi-month decline is yet to complete (again, I don't think March 17th marks bottom). Should a projected re-test of March 17th's low occur as anticipated, then we simply will have added substantive basis for looking forward to a pleasantly surprising stock market melt-up.


$BPNYA

(click here for more information about the NYSE Bullish Percent Index)

The above chart presents a view I read as follows...

First, the January '08 swoon brought "the stock market" to a point where it was washed out ... "oversold." Only 15.92% of all stocks in the NYSE Composite had "bullish" chart configurations at the time the index bottomed.

Being the NYSE Composite fell lower in January than it did last August, the impact of January's sell-off was, therefore, "confirmed." The negative effect on the composite of stocks making up the NYSE Composite index broadened. January's lower Bullish Percent Index demonstrates this.

The market's re-test of its January low on March 17th coincided with a divergence in the NYSE Bullish Percent Index (26.04%). Hence, we might conclude additional underlying buying support than existed in January had developed going into the March 17th low. Thus, there existed some added interest to "defend" January's bottom.

Fast forward to today. Although the NYSE Composite is no higher than it was in late February, the Bullish Percent Index has exceeded the peak it reached in February (43.63). This suggests underlying buying support continues to grow. It bolsters the technical case suggesting a bottom is forming in the stock market's multi-month decline.

Now consider the Bullish Percent Index's present position. Being nearer the upper end of the range it has trading within over these many months, the time for the stock market to turn lower once again might be at hand.

Should the NYSE re-test its March 17, 2008 low, expect the Bullish Percent Index to bottom above its low set in March (26.04). Contrarily, if the NYSE should exceed its March 17, 2008 low, then expect the Bullish Percent Index to bottom above the low it set in January (15.92).


OEX 5-min

Today's break of last week's advancing trend suggests the re-test of the March 17, 2008 low might have begun.

Per the lack of any RSI divergence during last week's advance, this is circumstance that "fits" Elliott Wave analysis. Ditto the similar lack of RSI divergence during the S&P 100's decline prior to last week's advance. Indeed, both instances might be further evidence supporting both my case for a re-test of March 17th's low and a subsequent melt-up...

* * * * *

© The Risk Averse Alert — Advocating a patient, disciplined approach to stock market investing. Overriding objective is limiting financial risk. Minimizing investment capital loss is a priority.

Analysis centers on the stock market's path of least resistance. Long-term, this drives a simple strategy for safely investing a 401(k) for maximum profit. Intermediate-term, investing with stock index tracking-ETFs (both their long and short varieties) is advanced. Short-term, stock index options occasionally offer extraordinary profit opportunities when the stock market is moving along its projected path.

Nothing is set in stone. Nor is the stock market's path of least resistance always known. More often than not, there are no stock index option positions recommended.


There's an easy way to boost your investment discipline...

Get Real-Time Trade Notification!

Sunday, April 20, 2008

Your Low-Risk Ride to Making Serious Bank in the Stock Market


I recently was asked what this blog is about. Call it a gateway to successful investing in the stock market. Here you should gain greater certainty about opportunity and risk ... and whether you should be in the market or out ... or, if you prefer, long or short.

One of the key discoveries made by legendary early-20th century trader, Jesse Livermore, led to his understanding the importance of the market's trend. Having this power of discernment, he found, took his gift for reading the ticker tape to a level where profits were both richer and more certain.

Being long when the market was slated to rise, and short when the market was slated to fall, he found greater frequency when he could confidently let profits ride.

* * * * *

Let's face it. Some things never change. Long ago, even King Solomon realized, "there is nothing new under the sun."

Jesse Livermore put it this way...

"I learned early ... there is nothing new in Wall Street. There can't be because speculation is as old as the hills. Whatever happens in the stock market to-day has happened before and will happen again. I've never forgotten that."Reminiscences of a Stock Operator

Greed and fear ... the sway of social circumstances ... simply are timeless elements affecting every generation's stock market investments. This fact is as plain as the sun's rising and setting.

Money subtly causes people to act in common. So, just how investor mass behavior appears inclined at any given moment can be priceless knowledge, indeed.


What's to know?

Maybe you believe stock market investing is just an exercise in random chaos. No doubt, I will be the first to admit the impossibility of knowing all things.

However, the big picture is by no means illusive. There are ways to reasonably assess probabilities in the stock market at large. On this count I find the Elliott Wave Principle provides a most useful analytical foundation.

Supplementing this, I look at a select cadre of underlying technical measures. These help me gauge probabilities within the framework of my Elliott Wave analysis.

All this guides my commentary. My objective simply is getting down to the message of the market. I avoid diving too deeply into technical formulations whose value has evolved over my past 20+ years at this game. Instead, I develop my perspective in a thoughtful way you should find relatively easy to grasp.

I strive to keep an open mind. Truly, nothing is set in stone. Time's progress serves to either support or refute any forecast. So, as technical evidence develops, I put it to the test. That's what the Risk Averse Alert is about.


Will tomorrow be a sunny day or is rain in the forecast?

Do you believe weather forecasts are useful? Do you see how, despite all the variables involved, "predicting" the weather still is possible? Notwithstanding inaccuracies, some useful insight is gained.

The weather and mass behavior share something in common, too. Both in fact are natural phenomena.

Again, "... there is nothing new in Wall Street, ... speculation is as old as the hills, ... whatever happens in the stock market to-day has happened before." That's because the stock market is not so much about the fortunes of publicly traded companies, but rather it is about the fortunes of those who invest in them.

Just as a meteorologist achieves "accuracy" employing forecasting models, Elliott Wave analysis simply raises power to assess probabilities in the stock market. This requires a degree of flexibility, of course. However, at any given time possibilities are finite. Thus, probabilities can be effectively weighed.

Are stocks being accumulated in a healthy, self-sustaining manner ... setting up conditions typically delivering investors incredible, long-term profits?

Or are strong hands trimming their holdings ... because in the big picture some new circumstance is changing the game — elevating risk — threatening a climate likely to bring steep losses to the bulk of ill-informed investors who make up the majority?

These are questions any serious long-term player should be able to answer with some reasonable degree of clarity. That's what I aim to deliver.

The Risk Averse Alert puts to practice timeless wisdom:
"Obviously the thing to do was to be bullish in a bull market and bearish in a bear market. Sounds silly, doesn't it? But I had to grasp that general principle firmly before I saw that to put it into practice really meant to anticipate probabilities."
Reminiscences of a Stock Operator


GET LEGAL INSIDER INFORMATION

"Speculation is far too exciting. Most people who speculate hound the brokerage offices... the ticker is always on their minds. They are so engrossed with the minor ups and downs, they miss the big movements."

Diversify your brokerage risk with tradeMONSTER
There is no doubt about it. The big movements in the stock market lasting months and years make millionaires of patient investors. And then sometimes fast moves lasting weeks can turn stakes as little as $500 into sums upward of $100K.

Now, of course, there are many different investment vehicles. Yet if you believe as I do that, as goes the stock market, so go 90% of all stocks that make up the stock market, then being on the right side of the trade — bullish or bearish — is half the battle.

Truth is even typically speculative financial instruments meet moments when their trading is a relatively low-risk proposition. Your challenge, then, simply is knowing when to say when. So, get inside the alert center.

Sign up for free trade notification, and...

Boost Your Discipline to Win


Are you risk averse?

Warren Buffett says, "Unless you can watch your stock holding decline by 50% without becoming panic-stricken, you should not be in the stock market."

Far better, I think, is to know when the risk of suffering a crushing loss is elevated.

This is easier to do than you might think!

Discover how. Yours is power to be gained making smarter investment decisions for years to come. This power is yours free. Simply e-mail...


Subject: "Risk Averse Alert Me"

* * * * *

© The Risk Averse Alert — Advocating a patient, disciplined approach to stock market investing. Overriding objective is limiting financial risk. Minimizing investment capital loss is a priority.

Analysis centers on the stock market's path of least resistance. Long-term, this drives a simple strategy for safely investing a 401(k) for maximum profit. Intermediate-term, investing with stock index tracking-ETFs (both their long and short varieties) is advanced. Short-term, stock index options occasionally offer extraordinary profit opportunities when the stock market is moving along its projected path.

Nothing is set in stone. Nor is the stock market's path of least resistance always known. More often than not, there are no stock index option positions recommended.


There's an easy way to boost your investment discipline...

Get Real-Time Trade Notification!

Saturday, April 19, 2008

Now See the Stock Market Near the Edge, Grasshopper


Nothing is set in stone. This includes any outlook I express, whether previous or this moment...

Up to this point I have been supposing a stock market melt-up is in store ... once its multi-month decline, begun October, 2007, is complete. I continue to believe this "has to be" the more likely probability. However, I am more suspicious than any time before.

Today, I want to give you a cursory view of the big picture. This simply summarizes why I have been supposing a bottom to the stock market's multi-month decline is at hand (if not already in place on March 17, 2008). Behind the scenes are a number of technical things an Elliott Wave Guy considers. I don't go there. I dazzle you with volume and price-RSI, and offer "like from like" ideas in a simple way. On one hand I am trying not to numb your mind. On the other I am asking you think.

On Wednesday, March 26, 2008, I wrote, "The more I look at the big picture — the nearness to which all major indexes are to points at which, were they to fall below, the stock market might likely thereafter collapse spectacularly — the more I am persuaded [the March 17th] low represents something of a strong floor."

Have a look at this.


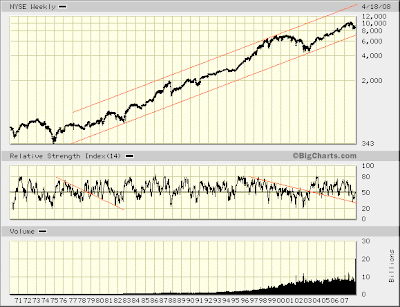
NYSE weekly

As you can see the NYSE Composite is not far above its long-term, rising trend line. In fact, you should also go back to my commentary on April 4, 2008 and take a look at the mark-up drawn on the two year chart of the NYSE Composite. There I present a scenario where the stock market's multi-month decline would complete right about where you see the NYSE Composite's long-term, rising trend line (above). Right in the vicinity of 7600.

So, underlying, long-term, buying support exists not far below present levels.

This long view gets even more interesting looking at the NASDAQ Composite...


NASDAQ weekly

Goodness. Long-term buying support is at hand. RSI has once again turned higher from the very same area it has already bottomed several times over the past four years, and that suggests long-term support will hold.

So, this essentially is the preliminary background to my March 26, 2008 comments suggesting a nearby floor underneath the stock market. You see everything you really need taking the long-term trend line into view.

Per supposing a market melt-up might be at hand, here's a view I take looking, again, at the NASDAQ Composite...


NASDAQ weekly

First, consider this index's range-bound, rising channel during 1999 and observe what followed. Note how as the NASDAQ Composite fluctuated between higher highs and higher lows, its RSI diverged. However, rather than forecasting weakness, things were winding up.

You see the same kind of thing occurring over the past four years — same range-bound trading ... with an upward bias and RSI diverging.

There's one caveat to note, though. RSI has on a number of occasions dipped below 50, where sell-side strength is in command. This never happened in 1999. What significance this represents only suggests underlying buy-side strength is inconclusive. It's a red flag, and we should not ignore it.

However, as I have presented above, underlying long-term support is at hand.

Now let's take a closer look at the NASDAQ Composite's RSI picture (above) from a different angle. Zero in on the price-RSI divergence registered in October '02 when the index bottomed. Also note RSI's marked improvement — buying and selling strength moving in balance ... supply meeting demand ... i.e. at 5o — as the index fell from December '02 through March '03. We ought to expect the same kind of thing in the present period.

So, I suggest there's more work to be done ... buy-side strength needs to reveal itself. That's one reason why I have been supposing the March 17, 2008 low probably will be re-tested.

This is even better presented in the NYSE Composite Index...


NYSE weekly

Price-RSI performance since the Jan. '08 low appears almost a carbon copy of Jul. - Dec. '02.

At the very least, then, a re-test of Jan. - Mar '08 low appears a reasonable possibility. Likewise, a rapid swoon to the vicinity of 7600 and an equally quick reversal (on heavy volume) would fit, too. This is something like how things unfolded at the conclusion of the LTCM fiasco back in Q4 '98. You see this at the very left of the above chart.

And could there be worse?

That's what I fear.

However, when things like this arrive in my email, I worry less:


News like this, I suspect, simply is premature. And ... despite believing the Dow Jones Industrials could fall to the area of 3600 sometime over the next 3-4 years, I am going to do my level best to stay away from using the language of Armageddon. Indeed, I believe the Dow could fall to 3600 tomorrow and, still, the stock market would remain in a long-term up trend.

Per the pending market melt-up I have been forecasting... expect a percentage gain in the NYSE Composite greater than what occurred off its October, 1998 bottom (the index rose approximately 40% into its Y2K top) ... and a percentage gain less than what occurred in the NASDAQ Composite over this same period (for all intents and purposes, the NAS practically doubled).

* * * * *

© The Risk Averse Alert — Advocating a patient, disciplined approach to stock market investing. Overriding objective is limiting financial risk. Minimizing investment capital loss is a priority.

Analysis centers on the stock market's path of least resistance. Long-term, this drives a simple strategy for safely investing a 401(k) for maximum profit. Intermediate-term, investing with stock index tracking-ETFs (both their long and short varieties) is advanced. Short-term, stock index options occasionally offer extraordinary profit opportunities when the stock market is moving along its projected path.

Nothing is set in stone. Nor is the stock market's path of least resistance always known. More often than not, there are no stock index option positions recommended.


There's an easy way to boost your investment discipline...

Get Real-Time Trade Notification!

Friday, April 18, 2008

A Doubting Thomas Ponders His Stock Market Melt-Up Thesis


Believe it or not, I am not convinced I am an idiot for taking the view I have expressed over the past week. I will say, however, today's advance leads me to wonder whether March 17th's low might be more likely to hold up now. You are seeing why I couched my view of this likelihood as being a 60% probability.

But I will be honest with you. The 40% probability the March 17th low won't hold also remains in play. In fact, I am afraid a bout of selling worse than anything I have thus far considered could — I repeat, could — be in store. I will write about this over the weekend.

Contrarily, I also recognize how there are noteworthy similarities now to circumstances early in '03 when the stock market was bottoming. I will elaborate these, too, over the weekend.

Here's a little taste of my concern. There is something to be said about similarities now to price-RSI action and volume prior the crash of 1987.


$NYA

I take you back to March 28, 2008, when I stated, "One thing I am fairly confident about is the stock market probably will not trade outside the range it has been stuck in for the past two and a half months over much of the month of April." So far, so good.

This thinking also was consistent with perspective I laid out a few days later in "Channeling Stock Market Bracing for Dizzying Melt-Up?"

The one big difference then, though, was I had no inclination whatsoever to consider whether the stock market might subsequently crash. Up until today I have been expecting a melt-up. Now I am not so sure.

Again, I will comment more on the big picture over the weekend. Just to summarize, then, I continue to suppose a market melt-up still is likely to unfold over the months ahead. However, I have some doubts about just when this might begin...

(Believe it or not, British Prime Minister Gordon Brown's visit to the U.S. this week only adds to my suspicion. I suppose one need fear the utter frailty of the global financial system to appreciate the potential for an historic political power play, this being an election year. For a better sense of such possibilities have a look at what the same J.P. Morgan interests who just took down Bear Stearns were up to in 1932.)


OEX 5-min

So much for the line of "resistance" that began with the S&P 100's gap open lower on Tuesday, April 8, 2008. (I drew this line on the above chart a little differently than in recent posts; this simply is taking into account today's gap open higher ... the third this week! ... not that I give any significance to this beyond what sentiment it indicates.)

RSI, too — with its registering a higher peak today than was registered when the S&P 100 gapped open higher on Wednesday (4.16.08) — suggests there's still higher to go before any turn lower toward March 17th's low might unfold.

And I do believe we will see such a turn lower before any stock market melt-up commences — that is if a melt-up is, indeed, in the cards.

(I still believe it is. As I have said, however, I am a little wary right now. I also regret having abandoned diffidence when I said, "there's a 90% probability the stock market will melt-up sometime during the months ahead" on April 3, 2008. I am saying this for the record...)


NYSE 5-min

You see a different RSI picture in the broader NYSE Composite Index than registered in the S&P 100. Namely, today's burst out of the gate did not take RSI to a new high (which, here, was set on Wednesday, 4.16.08). Right now, I simply consider this a red flag substantiating other red flags I have recently noted ... the likes of which elevate the probability the stock market will succumb to selling pressure over the short-term.

The first is the CBOE Put-Call Ratio. This measure is, in fact, much nearer past peaks in optimism, just prior to the stock market turning lower.

Then, on Wednesday (4.16.08) I mentioned "underlying weakness signaled by divergence forming in the McClellan Oscillator for both the NYSE and the NASDAQ." This continues. Oddly enough, though, the Oscillator's divergence is ever so slight in the NYSE and more pronounced in the NASDAQ. This stands in contrast to recent price action in both indexes. Now that I mention it, though, this contrast might be supporting the case I am presently making for a near-term bout of selling.

(Here's how I see it: the wider the complacency — justified or not — the broader the reach of buying; I'm sorry, but I still see the NASDAQ as the NYSE's little brother.)

One other thing to note about the McClellan Oscillator, and it is a cautionary one. The Summation Index for both the NYSE and NASDAQ remains trapped below the 0 (zero) line. This condition brings me to question my view about imminent prospects for a stock market melt-up. In fact, it could be suggesting things might get much worse before they get spectacularly better. Again, this weekend I will be elaborate the particulars surrounding this caution.


$NYA

How many times have I claimed relatively subdued NYSE volume of late is a picture of both weak demand and underlying complacency? Well, that's my story and I'm sticking to it.


NASDAQ 5-min

Like the S&P 100, the NASDAQ Composite's RSI peaked higher this morning than it did when the index gapped higher at the open on Wednesday (4.16.08). Again, at first blush this suggests the stock market has still higher to go before turning south.

The channel drawn on the above NASDAQ chart, as well as on the S&P 100 chart presented earlier, are Elliott Wave formulations. The advance within these respective channels suggests a completed move [higher] might be in place.

Now, I might have a problem with this view because of RSI performance (such as I just mentioned). However, my [incorrect] attitude following last Friday's (4.11.08) and Monday's (4.14.08) decline was relying on RSI behaving a certain way, and yet this did not pan out. So, I do not want to entirely discount the possibility the stock market peaked today and might be heading for some trouble.

The more I look at the situation, the more I am concerned. I simply must say this in all honesty. I really am afraid my forecast for a stock market melt-up over the months immediately ahead might be premature. I just have this sneaking suspicion all the evidence suggesting the stock market is poised to break out higher, though legitimately noteworthy, is something of a trap. (See "Analysis Supporting My View For A Stock Market Melt-Up" to the left.)

In other words, I believe this bullish evidence could remain just as compelling following a move substantially lower. At worst, the evidence leads me to suppose a solid bottom would likely form not long after a [heretofore assumed improbable] sharp decline, were this to occur.

Come what may over the next couple months ... short-term, the stock market appears vulnerable.


* * * * *

© The Risk Averse Alert — Advocating a patient, disciplined approach to stock market investing. Overriding objective is limiting financial risk. Minimizing investment capital loss is a priority.

Analysis centers on the stock market's path of least resistance. Long-term, this drives a simple strategy for safely investing a 401(k) for maximum profit. Intermediate-term, investing with stock index tracking-ETFs (both their long and short varieties) is advanced. Short-term, stock index options occasionally offer extraordinary profit opportunities when the stock market is moving along its projected path.

Nothing is set in stone. Nor is the stock market's path of least resistance always known. More often than not, there are no stock index option positions recommended.


There's an easy way to boost your investment discipline...

Get Real-Time Trade Notification!

Thursday, April 17, 2008

Does Being Bearish Forbid Saying, "Good Day, Sunshine?"


Another day or three and things could begin getting dicey. Yesterday's burst might still have some life. Not much, though. Everything I need to say right now has been spoken over the past several days.


OEX 5-min

I suppose the S&P 100 could squirrel around in a narrow range just below the line drawn above, and not really start falling apart until sometime around the middle of next week. This line begins at the gap open lower on Tuesday, April 8, 2008 ... and became "resistance" all that day (which, I wrote, held some significance), then again two days later (on Thursday, April 10th), and now stands in the way again.

Third time's a charm? We'll see. Within the framework of the view I take as an Elliott Wave Guy, the prelude to a period of accelerated selling simply appears at hand.

Other things, too, support my view. Again, I've revealed these the past several days.

I believe an opportunity to short the OEX appears imminent. So, stick around and...

Good day, sunshine.


* * * * *

© The Risk Averse Alert — Advocating a patient, disciplined approach to stock market investing. Overriding objective is limiting financial risk. Minimizing investment capital loss is a priority.

Analysis centers on the stock market's path of least resistance. Long-term, this drives a simple strategy for safely investing a 401(k) for maximum profit. Intermediate-term, investing with stock index tracking-ETFs (both their long and short varieties) is advanced. Short-term, stock index options occasionally offer extraordinary profit opportunities when the stock market is moving along its projected path.

Nothing is set in stone. Nor is the stock market's path of least resistance always known. More often than not, there are no stock index option positions recommended.


There's an easy way to boost your investment discipline...

Get Real-Time Trade Notification!