Wednesday, October 31, 2012

Sandy No Match for Hurricane Bernice

Hey Sandy, you forgot something...


Looks like there is more bad news in store for lower Manhattan. Whenever bankrupt trash floating on the same Fed largesse that is swamping the physical economy has been swept to the top of the current generated by a fantasy believing a flood will wash away all that ails, the "lead" these take in fact puts the market on a fast path to the bottom of the sea. So suggests the relative performance of financials versus the S&P 500 (see bottom panel).

Buon Voyage, oh washed up cyclones of fraud...


Word on the Street
* * * * *
© The Risk Averse Alert — Advocating a patient, disciplined approach to stock market investing. Overriding objective is limiting financial risk. Minimizing investment capital loss is a priority.

Analysis centers on the stock market's path of least resistance. Long-term, this drives a simple strategy for safely investing a 401(k) for maximum profit. Intermediate-term, investing with stock index tracking-ETFs (both their long and short varieties) is advanced. Short-term, stock index options occasionally offer extraordinary profit opportunities when the stock market is moving along its projected path.

Nothing is set in stone. Nor is the stock market's path of least resistance always known. More often than not, there are no stock index option positions recommended.


There's an easy way to boost your investment discipline...

Get Real-Time Trade Notification!

Tuesday, October 30, 2012

Midtown Maelstrom Forecast

With the NASDAQ Composite's Bullish Percent Index flashing "danger" (RSI < 30) at a moment when the Composite Index appears fairly boxed in, we have additional evidence the market currently could be at risk of a sizable setback...


Just how significant might be the market's pending decline remains to be seen. Negatively diverging RSI and MACD over the entire duration of this year's advance certainly raises the likelihood trouble is brewing.

Chances are any upcoming weakness will be relatively limited, though. The fireworks probably won't begin until both weekly RSI and MACD turn negative (a la Q1 '08) and subsequently recover a bit.

* * * * *
© The Risk Averse Alert — Advocating a patient, disciplined approach to stock market investing. Overriding objective is limiting financial risk. Minimizing investment capital loss is a priority.

Analysis centers on the stock market's path of least resistance. Long-term, this drives a simple strategy for safely investing a 401(k) for maximum profit. Intermediate-term, investing with stock index tracking-ETFs (both their long and short varieties) is advanced. Short-term, stock index options occasionally offer extraordinary profit opportunities when the stock market is moving along its projected path.

Nothing is set in stone. Nor is the stock market's path of least resistance always known. More often than not, there are no stock index option positions recommended.


There's an easy way to boost your investment discipline...

Get Real-Time Trade Notification!

Monday, October 29, 2012

Saving The Day Some Tomorrow

Here's something worth keeping an eye on...


Whenever the market has been under pressure there has been a tendency to "save the day" somewhere in the vicinity of what ultimately proved to be bottom. This is demonstrated by an advance-decline differential leaping above best levels registered during the market's preceding decline. Duly noted, too, is the fact this did not occur until the NYSE advance-decline differential's momentum had reached a negative extreme (see bottom panel).

So, with the market's advance into September peak no less suspect than its advance at the start of the year and interest in further bidding up the garbage fading fast, we have this prospective "heads up" alerting us to when we might be in the ballpark of a bottom.

* * * * *
© The Risk Averse Alert — Advocating a patient, disciplined approach to stock market investing. Overriding objective is limiting financial risk. Minimizing investment capital loss is a priority.

Analysis centers on the stock market's path of least resistance. Long-term, this drives a simple strategy for safely investing a 401(k) for maximum profit. Intermediate-term, investing with stock index tracking-ETFs (both their long and short varieties) is advanced. Short-term, stock index options occasionally offer extraordinary profit opportunities when the stock market is moving along its projected path.

Nothing is set in stone. Nor is the stock market's path of least resistance always known. More often than not, there are no stock index option positions recommended.


There's an easy way to boost your investment discipline...

Get Real-Time Trade Notification!

Friday, October 26, 2012

Pyrrhic Confidence

Tuesday's "Dips Ahoy" presented the following chart of the NYSE Composite Index whose markup deserves further comment...


$NYA

The line connecting May 2011 and March 2012 peaks is interesting because it actually extends back to the NYSE Composite's October 2007 peak. So now the question is whether September's breakout above this line is significant.

Remember, at the time this breakout occurred the number of NYSE-listed issues hitting new 52-week highs surprisingly spiked to its highest since March '09 bottom. What should we make of this, then? Could confidence actually be on the mend?


Honestly, it is hard to imagine last year's throttling (Aug 2011) could have been so technically devastating were confidence following 2008's bloodbath on the path to being restored. Bad enough was the long-established fact that, a dearth of NYSE-listed issues had been leading the market higher following March '09 bottom. A record 83% or so NYSE-listed issues established new 52-week lows in 2008. One year subsequent to this and over the entire period thereafter, the number of NYSE-listed issues hitting new 52-week highs should have been significantly higher were lender of last resort actions to bail out the trans-Atlantic banking system likely to restore confidence. This was one technical disparity leading me to conclude confidence, indeed, was vanquished. All the more was this viewpoint bolstered right up to the market's March-April peak this year.

So, what do we make of September's surge of NYSE-listed issues hitting new 52-week highs? Surely, we can assume underlying this was announcement of the ECB's OMT program quickly followed by the Fed's QE3. Yet what of credit market dislocation these hyperinflationary measures are sure to precipitate? Is this possibly tomorrow's problem, not to be worried about presently? How soon might further business retrenchment ultimately triggered by central bank attempts to sustain an entirely unsustainable mountain of debt bring realization there will be no return to the Greenspan era status quo any time in our lifetimes? Could this already be a well-entrenched understanding explaining no substantial pickup in the volume of shares exchanged on the NYSE coinciding with the NYSE Composite's September "breakout?"

Obviously, these simply are rhetorical questions. Still, their implication does not necessarily discount possibility major indexes could advance beyond their September peaks. Indeed, the NYSE Composite Index could take out its May 1, 2011 high before all is said and done with its advance since early-October 2011.

Nevertheless, yesterday's discussion on possibility the market, right now, might be in the midst of turning over and imminently falling harder than thus far has been thought likely finds the NYSE Composite Index presenting another "canary in a coal mine." This is in addition to its already well-established, relative lag, the likes of which decidedly indicates money by no means has been pouring into the stock market (notwithstanding a generally decided love at least for the NYSE's wares).

Should the apparent line of former NYSE Composite resistance penetrated to the upside in September imminently fail support, then risk of a steeper decline becomes elevated. The significance of September's surprising uptick in the number of NYSE-listed issues hitting new 52-week highs then might prove Pyrrhic, while at the same time likely motivate repeated stabs at buying dips.

Even were this apparent line of support to give out, though, still living would be prospect a "rising wedge" is forming off October 2011 bottom, in which case support should develop once the NYSE Composite approaches its rising trend line off that bottom (right now at 7800-ish).

Right now, the market's decline from September peak appears unfinished, and NYSE Composite Index support identified here seems likely to give out. Beyond this probability any risk of disaster awaits assessment of the market's state following its likely, pending setback.


Word on the Street
* * * * *
© The Risk Averse Alert — Advocating a patient, disciplined approach to stock market investing. Overriding objective is limiting financial risk. Minimizing investment capital loss is a priority.

Analysis centers on the stock market's path of least resistance. Long-term, this drives a simple strategy for safely investing a 401(k) for maximum profit. Intermediate-term, investing with stock index tracking-ETFs (both their long and short varieties) is advanced. Short-term, stock index options occasionally offer extraordinary profit opportunities when the stock market is moving along its projected path.

Nothing is set in stone. Nor is the stock market's path of least resistance always known. More often than not, there are no stock index option positions recommended.


There's an easy way to boost your investment discipline...

Get Real-Time Trade Notification!

Thursday, October 25, 2012

Forewarned Is Forearmed

With really no constructively disposed technical measure to speak of—all decidedly support probability the market is poised to move lower— let's consider a very specific prospect whose potentially fast-approaching outcome could be shockingly dire.

Now, it's not that the market's current technical state glaringly suggests such an outcome could be imminent, although it might be. No doubt, a deep shock occurring sooner than most imagine is a probability technically well-established to be sure. Yet at present appears decided technical weakness with no sign of abating. The question is could selling evidently in store sink indexes in a way challenging—invalidating—recent Elliott wave views?

I rather suspect this could happen. Like I said, a "rising wedge" forming off early-October 2011 bottom is but one, valid Elliott wave possibility. There are others.

Still, should any imminent decline force the issue, what revised wave count then would become necessary might be usefully anticipated simply making a slight alteration to specific, prevailing assumptions in the post-Y2k period. Here, too, there is supporting evidence substantiating this particular wave count's probability.


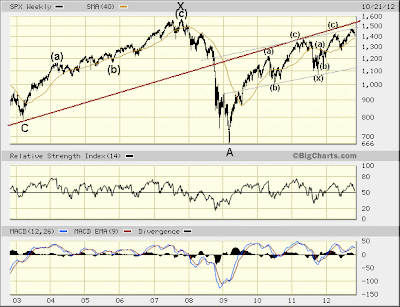
$SPX weekly

The simple change here finds a "double three" corrective wave forming in the S&P 500 since Y2k. Nothing is stretched in the least to make this a valid Elliott wave count. Like I just said, too, there is additional evidence raising this perspective's probability.

Per the S&P 500's "double three"—a so-called "complex" Elliott corrective wave—forming since Y2k, the first a-b-c [down] unfolded from 2000-2003. This took the form of a 3-3-5 "flat." The connecting "x" wave unfolded from 2003-2007. Since then the second a-b-c has been forming.

The Elliott Wave Principle's "alternation guideline" suggests the second a-b-c is likely to form a 5-3-5 "zig-zag" down (alternating from the 3-3-5 "flat" forming the first a-b-c). The zig-zag's first 5 waves down unfolded from October 2007 - March 2009 to form wave A. Unfolding off March '09 bottom, then, is the zig-zag's "b" wave.

Now, the above view detailing the prospective component waves forming the zig-zag's "b" wave is not "new." A "double zig-zag" forming into March 2012 top was one of the more recent Elliott wave count possibilities among several considered here over the past few years. As it stands, too, this "double zig-zag" now appears destined to extend into a "triple zig-zag." Indeed, it's even possible this extension already has occurred, ending at the S&P 500's September 2012 peak. Yet, as there are technical disparities arguing against this, let's assume the third and final zig-zag [higher] forming wave B could lie in wait.

Admittedly, the above view on the S&P 500's advance off March '09 bottom is tentative. Yet certain are a couple things. First is the dynamic line of support/resistance whose significance in relation to the S&P 500's evolution since the 1970s remains formidable. Second is the fact the S&P 500's October 2007 peak will not be exceeded if a "zig-zag," indeed, is forming off it. At the very least this latter consideration thus raises prospect wave B up from March '09 bottom in fact is nearing its end.

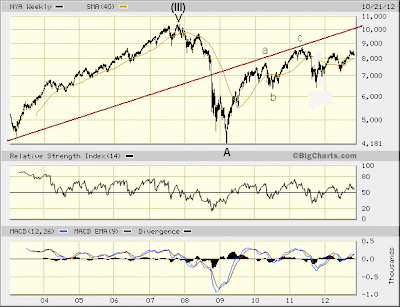
As I said, there is additional evidence supporting this view. The NYSE Composite Index—long displaying relative weakness itself—finds the moment's decidedly weak technical state shedding a more troubling light on its otherwise notable disparity versus the S&P 500's performance, particularly given its new found resiliency in the face of softness sinking the market's recent leaders. Weak hands holding on for dear life in the midst of fading cover (i.e. sinking leaders) portends near-term fortunes possibly turning sour. Long a laggard and, quite possibly, imminently the more, circumstance inexorably pointing the market toward its broad-based decimation could be significantly furthered over the immediate period.

$NYA weekly

Of foremost significance is the fact that, in 2007 the NYSE Composite Index is seen completing a 5-wave advance from its 1974 bottom. The line drawn above approximates the lower boundary of the Elliott channel containing this advance. As you can see, too, much like the S&P 500's dynamic line of support/resistance, this former dynamic line of support in the NYSE Composite Index likewise has proven formidable resistance ever since it gave out in 2008. Whether resistance again might be tested, indeed, is in doubt. The broad market's noteworthy lag, this notwithstanding a whole lot of love, in fact could prove entirely problematic should the market's already thin leadership decidedly lose its luster, as has been occurring of late.

Now, just because the NYSE Composite Index strongly suggests its 2007 peak will not be exceeded before its March 2009 low is taken out, this does not infer the same outcome per the S&P 500. Indeed, we could see the overall market more or less holding up over the next several years, and this to the effect finding the S&P 500 contained by its overhead, dynamic resistance in a slow, upward march to new all-time highs, while the NYSE Composite remains a decided laggard, failing to rise above its October 2007 peak. As the past couple years have been a lesson in political determination to sustain the resiliency of markets, prospect this could continue for some years longer before finally succumbing rightly should be regarded a legitimate possibility.

Yet succumb, eventually, the market quite likely will. Physical reality forged in hyperinflationary breakdown—an "inexplicable" phenomenon behind continuing corporate retrenchment—only will accelerate movement toward political reform whose call for restructuring is sure to unmask an emperor with no clothes. Obviously, Europe is on the front line. Seems to me even the mere appearance of credible resistance to the hyperinflationary bailout/austerity regime could blow the lid off the trans-Atlantic banking system and send financial markets reeling.

Truth is even at this very moment something quite nasty could promptly develop, all reservations to the contrary aside. The market's current technical state certainly appears foreboding, and with plenty of negative evidence accumulating over the past few years providing more than enough reason, really, to fear the worst, the above Elliott wave count possibility presents a perspective wherein disaster could be just around the corner. Forewarned is forearmed.


Word on the Street
* * * * *
© The Risk Averse Alert — Advocating a patient, disciplined approach to stock market investing. Overriding objective is limiting financial risk. Minimizing investment capital loss is a priority.

Analysis centers on the stock market's path of least resistance. Long-term, this drives a simple strategy for safely investing a 401(k) for maximum profit. Intermediate-term, investing with stock index tracking-ETFs (both their long and short varieties) is advanced. Short-term, stock index options occasionally offer extraordinary profit opportunities when the stock market is moving along its projected path.

Nothing is set in stone. Nor is the stock market's path of least resistance always known. More often than not, there are no stock index option positions recommended.


There's an easy way to boost your investment discipline...

Get Real-Time Trade Notification!

Wednesday, October 24, 2012

Bloodbath Bound

Several months ago I contrasted the S&P 500's coincident momentum during its advance off October 2011 bottom to the same during its advance off late-June 2010 bottom to highlight a suspect technical backdrop underlying the market's advance over the past year whose extraordinarily imbalanced beginning last October ("God save our sinking ship!") has seen its momentum generally fade ever since, this while the S&P 500 further extends its levitation.

The negative outlook this contrast justified never diminished, and in fact is becoming more burdensome in the face of accumulated technical weakness evidenced over the past few years exposed in the light of circumstantial similarities presently appearing as the S&P 500 tops and prepares to turn over...


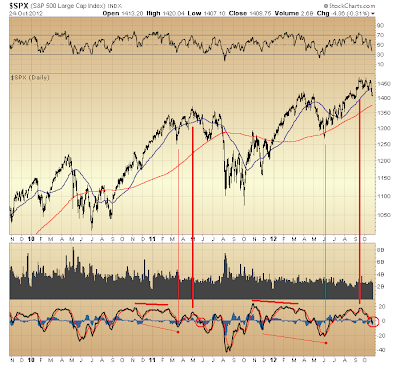
$SPX

MACD (bottom panel) diving to the negative today takes us back to the late-May 2011 period for a similar setup leading to the same. Then, too, the S&P 500's 50-day moving average was being challenged, while momentum, already weakening, was on track to worsen relative to March 2011 bottom. Presently, momentum's further decline is a matter of anticipation already on our radar, as MACD's early-June 2012 bottom is thought likely to be taken out during the S&P 500's current iteration forming a top.

All this suggests additional, upcoming selling could find the S&P 500 imminently challenging its June 2012 low. Subsequent to this we should expect one final lift, a la June 2011, before the lug nuts fall off.

Per possibility an Elliott "rising wedge" is forming off October 2011 bottom, this could prove untrue for the S&P 500 should the index vacillate as anticipated here. I rather suspect, though, a "rising wedge" still will guide our view toward the NYSE Composite Index. The broad market continues holding up relatively well, while long-established leaders (S&P 500) presently receive the brunt of selling. This distinction probably will persist over coming days, only deepening index performance disparities already in evidence.

The one thing you might take away from the above view is a sense of prospective weakness in store on account of increasing vulnerability objectively displayed over time by every technical measure presented on the S&P 500's daily chart. There is a good case for fearing a bloodbath ahead.


Word on the Street
* * * * *
© The Risk Averse Alert — Advocating a patient, disciplined approach to stock market investing. Overriding objective is limiting financial risk. Minimizing investment capital loss is a priority.

Analysis centers on the stock market's path of least resistance. Long-term, this drives a simple strategy for safely investing a 401(k) for maximum profit. Intermediate-term, investing with stock index tracking-ETFs (both their long and short varieties) is advanced. Short-term, stock index options occasionally offer extraordinary profit opportunities when the stock market is moving along its projected path.

Nothing is set in stone. Nor is the stock market's path of least resistance always known. More often than not, there are no stock index option positions recommended.


There's an easy way to boost your investment discipline...

Get Real-Time Trade Notification!

Tuesday, October 23, 2012

Dips Ahoy

A 5th wave lower unfolded today? Maybe per major NASDAQ indexes. However the panic-stricken hit other large cap indexes took today rather suggests we will see more dips ahead, and stat.


$NYA

Not being positively married to the "rising wedge" off October 2011 bottom thesis ... yet as it currently is working we have to go with it because today's smack down again brings into view technical circumstance back in early April and the probability present conditions ultimately should weaken relative to conditions then.

There's plenty of downside remaining within the tentative bounds of a "rising wedge" prospectively forming in the NYSE Composite Index. Whether such a negative turn delivers technical circumstance comparatively worse than anything displayed during this year's April-May period remains to be seen. This in fact I have been anticipating. Without a doubt, today's decline certainly raises the likelihood the near-term path of least resistance is lower. Time will tell whether a "rising wedge" ending the market's counter-trend rally off March '09 bottom, indeed, has been developing since early-October 2011.


Word on the Street
* * * * *
© The Risk Averse Alert — Advocating a patient, disciplined approach to stock market investing. Overriding objective is limiting financial risk. Minimizing investment capital loss is a priority.

Analysis centers on the stock market's path of least resistance. Long-term, this drives a simple strategy for safely investing a 401(k) for maximum profit. Intermediate-term, investing with stock index tracking-ETFs (both their long and short varieties) is advanced. Short-term, stock index options occasionally offer extraordinary profit opportunities when the stock market is moving along its projected path.

Nothing is set in stone. Nor is the stock market's path of least resistance always known. More often than not, there are no stock index option positions recommended.


There's an easy way to boost your investment discipline...

Get Real-Time Trade Notification!

Monday, October 22, 2012

One Dip Bought Deserves Another

It took all day today to produce a first-sign that, weakness roiling the market into last week's close could be on the verge of being contained...


SPX 5-min

Technical improvement registered via RSI and MACD late today—this contrasted to late last Thursday (Oct. 18th) when the 2nd wave of 5 waves down is seen forming—raises prospect the market's softness over the past two-and-a-half days rather finds major indexes approaching a near-term floor. And why not? Today's final hour should do wonders to motivate the "buy the dips" crowd to pony up only more.


$SPX

With completion of wave a of 4 prospectively a 5th wave down from last Thursday's peak away, an imminent challenge of the S&P 500's rising trend line off its early-October 2011 bottom thus seems reasonably in order here. Subsequently, the "buy the dips" crowd just might send the S&P 500 slightly above its September peak, and in so doing complete wave b of 4, while at the same time satisfying the Elliott Wave Principle's "alternation guideline," as well. Indeed, should these developments in fact occur the above wave count distinguishing the component waves of a "rising wedge" effectively would be further confirmed, and so only raise the probability of market negative portent this wave form is known to signal.

Now, it's entirely possible I am rushing the wave count distinguishing the prospective component waves of wave 4 as indicated above. One thing worth noting on this account is wave b of 2's formation earlier this year. As you can see, wave b of 2 subdivided into 3 waves, the likes of which whose "b" wave did not fall below the point from which its "a" wave began. The Elliott Wave Principle's "alternation guideline" suggests wave b of 4 is likely to develop differently in contrast.

Needless to say, a fairly range-bound, yet, too, buoyant market appears in store over the immediate period. Again, I would look back to April when wave 2 was early in its formation to gain some better sense of technical developments likely ahead. At this point in wave 4's formation it is unclear whether index RSI and/or MACD might sink below their respective lows registered during formation of wave 2, which in so doing would provide further evidence of increasing exhaustion, thus confirming formation of a "rising wedge" off October 2011 bottom and, furthermore, most suitably completing the market's counter-trend rally since March 2009. Whether by these technical measures or others, however, I rather expect exhaustion to be amply evidenced still further than already has been noted so far, and so likely set up for disaster those who today advise we "buy the dips."


Word on the Street
* * * * *
© The Risk Averse Alert — Advocating a patient, disciplined approach to stock market investing. Overriding objective is limiting financial risk. Minimizing investment capital loss is a priority.

Analysis centers on the stock market's path of least resistance. Long-term, this drives a simple strategy for safely investing a 401(k) for maximum profit. Intermediate-term, investing with stock index tracking-ETFs (both their long and short varieties) is advanced. Short-term, stock index options occasionally offer extraordinary profit opportunities when the stock market is moving along its projected path.

Nothing is set in stone. Nor is the stock market's path of least resistance always known. More often than not, there are no stock index option positions recommended.


There's an easy way to boost your investment discipline...

Get Real-Time Trade Notification!

Friday, October 19, 2012

Buy the Dip Begs a Bigger Fleecing

What to make of a NYSE Composite Index falling 1.41% while the NYSE Bullish Percent Index rose 1.19%...

How many times today did someone take to the airwaves and advise we buy the dips? Well, it looks like someone did. Yet now this also looks like bad timing, not to mention bad advice. Following today's gassing the corrective wave thought forming since September peak rather seems to point the market lower here, and stat. Bad advice because the collective howl to buy the dips seems likely to grow as a rising wedge forming off October 2011 bottom completes over upcoming weeks, ending the market's counter-trend rally since March '09 and ushering in what is expected to be a nasty fall immediately thereafter (beginning a trip lower targeting major indexes to levels last seen in the 1987-1994 period).

By the thinnest margin did the S&P 500 close the week below its 50-day moving average. This is an ominous development in light of a CBOE Put/Call Ratio and Volatility Index whose respective momentum measures are both positive and pointing higher. Volume's modest pickup likewise is ominous, as well as fitting. Today prices fell by more than their own weight. There was a decided move for the exit. Nothing overwhelming, no doubt. Nonetheless nothing welcome, either, particularly when hanging in the balance is a precariously levered banking system, e'er in need of happy meals served at the Fed by the billions per month. All is fitting the moment from the perspective of an Elliott wave count whose bias should find technical evidence of exhaustion but further increasing.

One subtle way we see this the more now is evidenced by both major NASDAQ indexes today falling below respective rising trend lines extending from October 2011 bottoms. Both $COMP and $NDX, having risen above their 2011 peaks this year—twice for good measure in fact—quickly are fading and this rather precariously. Yet the NYSE Composite Index is nowhere close to penetrating this same trend line and in fact is holding well above it. Still, though, has $NYA so far this year failed to rise above its 2011 peak. This in spite of an NYSE cumulative advance-decline line otherwise still relentlessly increasing. All the while, too, NASDAQ's cumulative advance-decline line remains in its death spiral. Little wonder, then, NASDAQ's majors would so soon be precariously fading, while the NYSE Composite's juice shortage in the face of so much love rather stands judged, as ever, and even increasingly so, the poster child of a truly exhausted market whose anathema is any sentiment resulting in a pickup in selling.

How, then, to read today's decided "buy the dip" evidenced by the NYSE Bullish Percent Index' unusual increase occurring in spite of a declining market producing one of the worst NYSE advance-decline readings since early-June? Does this not seem a manifestation of that ages old question asking, when everyone is in, who else remains to bid the market higher? "Everyone is in" finds "everyone" buying the dip at what could be for the moment the worst time.

If I had to pick a "you are here" from the recent past, then look to early-April. It was then, too, that 50-day moving averages were being challenged from above, while [fading] momentum was poising to turn negative. Not coincidentally, then and now also are seen respectively marking the early phases of the two corrective waves within the 5-wave advance forming a "rising wedge" off October 2011 bottom. Still early in the transition to the 4th wave we rightly find a notable measure of positive underlying sentiment emboldened in the shadow of the completed 3rd wave and inclined to buy the dip. Although not yet likely to be proven entirely misguided, soon enough might this sentiment become a growing chorus and serve only to freeze many a money manager in the wrong mindset even as wave C down from Y2k peak begins its destruction as soon as sometime over the next six months.


Word on the Street
* * * * *
© The Risk Averse Alert — Advocating a patient, disciplined approach to stock market investing. Overriding objective is limiting financial risk. Minimizing investment capital loss is a priority.

Analysis centers on the stock market's path of least resistance. Long-term, this drives a simple strategy for safely investing a 401(k) for maximum profit. Intermediate-term, investing with stock index tracking-ETFs (both their long and short varieties) is advanced. Short-term, stock index options occasionally offer extraordinary profit opportunities when the stock market is moving along its projected path.

Nothing is set in stone. Nor is the stock market's path of least resistance always known. More often than not, there are no stock index option positions recommended.


There's an easy way to boost your investment discipline...

Get Real-Time Trade Notification!

Thursday, October 18, 2012

Variation on a 4th Wave

I misspoke yesterday and have corrected the error. The Elliott Wave Principle's "alternation guideline" suggests that, during formation of wave a of 4 the NYSE Composite's wave 3 peak in fact likely will be exceeded (yesterday I wrongly indicated this would not be the case).

Back in March the NYSE Composite's wave 1 peak never was exceeded during formation of wave a of 2. The "alternation guideline" advises one expect the opposite more or less in every related aspect of wave formation. So, that's why the NYSE Composite's wave a of 4 might be expected to behave in opposition to wave a of 2. Likewise wave 4 versus wave 2 in their entirety should alternate. That's why wave 4's worst more likely might come sooner rather than later, as contrarily occurred during formation of wave 2.


$NYA

Above presents a new variation to the Elliott wave count since September peak. All it does is extend out some days the market's levitation before succumbing to a bout of selling erasing much of the market's gains since early June. It is during this upcoming period we might expect the NYSE Composite Index to slightly exceed its September peak. Of course, this is just one possible path forward in formation of wave 4 of (c).

No need to change last night's conclusion. The several technical measures recently cited as supporting a negative near-term outlook remain no less foreboding and, as such, should serve to effectively cap any further market advance into what is thought significant overhead resistance.


Word on the Street
* * * * *
© The Risk Averse Alert — Advocating a patient, disciplined approach to stock market investing. Overriding objective is limiting financial risk. Minimizing investment capital loss is a priority.

Analysis centers on the stock market's path of least resistance. Long-term, this drives a simple strategy for safely investing a 401(k) for maximum profit. Intermediate-term, investing with stock index tracking-ETFs (both their long and short varieties) is advanced. Short-term, stock index options occasionally offer extraordinary profit opportunities when the stock market is moving along its projected path.

Nothing is set in stone. Nor is the stock market's path of least resistance always known. More often than not, there are no stock index option positions recommended.


There's an easy way to boost your investment discipline...

Get Real-Time Trade Notification!

Wednesday, October 17, 2012

One Question Answered

Last Friday I questioned whether the middle wave of an a-b-c corrective wave down from September peak might extend in time unfolding before the floor gives way and a significant return of the market's advance from early June rather quickly (or maybe just persistently) comes to pass. It's clear at least in some quarters today we got the answer. The middle wave of an a-b-c corrective wave down from September peak is in the midst of unfolding. There's probably a little bit more upside remaining, too, before a decided turn south gets under way.


You get the picture via the Elliott wave count applied to the NYSE Composite Index above. Overhead resistance should prove formidable, if it is tested at all. The Elliott Wave Principle's "alternation guideline" in relation to wave a of 2 suggests the NYSE Composite in forming wave a of 4 probably will exceed its September peak, how ever slight this might be on account of overhead resistance.

My outlook here is bolstered by a McClellan Oscillator, first, on all counts supporting my current wave count bias and, second, tiring while the market's levitation since early-June approaches an anticipated, near-term end. The NYSE Summation Index further displays a nugget of gold likewise substantiating my less than ebullient outlook, this immediately speaking, as well as looking out some months from now.


Here's where I think we are: exactly the reverse of one week ago in a trend about to turn the other way.

Those several other technical measures recently cited as supporting my outlook remain no less foreboding.


Fast Money
* * * * *
© The Risk Averse Alert — Advocating a patient, disciplined approach to stock market investing. Overriding objective is limiting financial risk. Minimizing investment capital loss is a priority.

Analysis centers on the stock market's path of least resistance. Long-term, this drives a simple strategy for safely investing a 401(k) for maximum profit. Intermediate-term, investing with stock index tracking-ETFs (both their long and short varieties) is advanced. Short-term, stock index options occasionally offer extraordinary profit opportunities when the stock market is moving along its projected path.

Nothing is set in stone. Nor is the stock market's path of least resistance always known. More often than not, there are no stock index option positions recommended.


There's an easy way to boost your investment discipline...
Get Real-Time Trade Notification!

Tuesday, October 16, 2012

Conspicuous Weakness

Don't be deceived. Today's advance proved it's still very much garbage being bid up (as such, too, confirming my present Elliott wave-based view)...


Seriously? This is all the follow-through we could muster to September's burst of NYSE new 52-week highs, this as the NYSE Composite rose today to within a percent of its September peak? Truly, just how weak is the market's underlying technical state appears readily exposed here. Thus, too, do current expectations continue erring toward anticipating increasing weakness over the immediate period.


The NASDAQ 100 might provide an insightful explanation to why the NYSE new 52-week high-low differential is so conspicuously subdued. Apparently, those issues most widely loved since March '09 have been more greatly shunned since September peak. Certainly nothing here, either, suggesting this circumstance is about to be turned around.


Fast Money
* * * * *
© The Risk Averse Alert — Advocating a patient, disciplined approach to stock market investing. Overriding objective is limiting financial risk. Minimizing investment capital loss is a priority.

Analysis centers on the stock market's path of least resistance. Long-term, this drives a simple strategy for safely investing a 401(k) for maximum profit. Intermediate-term, investing with stock index tracking-ETFs (both their long and short varieties) is advanced. Short-term, stock index options occasionally offer extraordinary profit opportunities when the stock market is moving along its projected path.

Nothing is set in stone. Nor is the stock market's path of least resistance always known. More often than not, there are no stock index option positions recommended.


There's an easy way to boost your investment discipline...

Get Real-Time Trade Notification!

Monday, October 15, 2012

Confidence Cooling Fast

Pisani was chirping today about major indexes being within a couple percent of recent highs, insinuating, I guess, confidence has not left the market. Whether one might beg to differ really is of no consequence. What's most relevant right now is that, the market holds up so well despite confidence cooling so fast...


Already the NYSE 52-week high-low differential is on the verge of challenging its 2012 lows. This, too, is rather fitting my Elliott wave view. A rising wedge's 4th wave thought currently early forming finds an element of underlying technical circumstance well on the way to confirming its place in fact.

This measure, too, subtly displays increasing underlying weakness in relation to its performance since early-June. Thus, the market's anticipated, continued decline (completing wave a of 4) might commence sooner rather than later.


Both relative strength (top panel) and momentum (bottom) have decisively weakened to an extent making comparison to similar circumstance going into May of this year worth taking notice. The path to seeing wave a of 4 in fact prove the more damaging (alternating from wave a of 2), while both relative strength and momentum weaken beyond wave 2 lows, could be upon us. Just how quickly this materializes is for twelve days remaining in October's trading, really, to decide at this point.


Fast Money
* * * * *
© The Risk Averse Alert — Advocating a patient, disciplined approach to stock market investing. Overriding objective is limiting financial risk. Minimizing investment capital loss is a priority.

Analysis centers on the stock market's path of least resistance. Long-term, this drives a simple strategy for safely investing a 401(k) for maximum profit. Intermediate-term, investing with stock index tracking-ETFs (both their long and short varieties) is advanced. Short-term, stock index options occasionally offer extraordinary profit opportunities when the stock market is moving along its projected path.

Nothing is set in stone. Nor is the stock market's path of least resistance always known. More often than not, there are no stock index option positions recommended.


There's an easy way to boost your investment discipline...
Get Real-Time Trade Notification!

Friday, October 12, 2012

Technical Confirmation of Impending Weakness

Seeing the CBOE Put/Call Ratio picking up positive momentum—a market negative—while the Volatility Index remains slow to register any pickup in fear—a sign of complacency—there's good reason, really, to fear more selling ahead...


$SPX

I question whether wave b of a of 4 might extend out to sometime later this month, thus allowing momentum time to turn negative before wave c of a of 4 lower unfolds in a decline whose end could/should sink momentum below its early-June trough, this furthering a display of increasing exhaustion off early-October 2011 bottom and confirming a rising wedge is forming wave (c) to complete a 5-3-5 "zig-zag" up from March 2009.

Subtle was today's S&P 500 break below its rising trend line from early-June bottom. This week's negative momentum trend breakdown, too, (bottom panel) likewise suggests trouble ahead. Closing the week with negative relative strength (top panel) is but another new, foreboding development. Yet none of it suggests certain imminent danger. Rather, heightened only is risk that weakness could develop sometime over the coming period, which event, too, would be fitting the Elliott wave-based perspective I prefer here, the likes suggesting a rising wedge off early-October 2011 bottom is some several months more forming before completing the market's counter-trend rally since March 2009.


The NYSE's internal state revealed by the 10-day moving average of daily NYSE advances-declines (blue line) provides wave count confirmation in a manner like index relative strength (RSI) and momentum (MACD). Alternation in formation of wave 1 of (c) versus wave 3 of (c) appears here, too. Ditto increasing exhaustion.

And now the NYSE's internal state is weakening off a decisive peak (any time the 10-day moving average of daily NYSE advances-declines rose above 800 over the past few years a break in the market followed soon after). Nevertheless, its internal state also is fairly "in balance" and improving notwithstanding this week's market softness. So, again, although a deeper pullback seems likely in store, there are reasons to believe this might be delayed some days, while the middle wave of an a-b-c down from September's peak further forms.


Fast Money
* * * * *
© The Risk Averse Alert — Advocating a patient, disciplined approach to stock market investing. Overriding objective is limiting financial risk. Minimizing investment capital loss is a priority.

Analysis centers on the stock market's path of least resistance. Long-term, this drives a simple strategy for safely investing a 401(k) for maximum profit. Intermediate-term, investing with stock index tracking-ETFs (both their long and short varieties) is advanced. Short-term, stock index options occasionally offer extraordinary profit opportunities when the stock market is moving along its projected path.

Nothing is set in stone. Nor is the stock market's path of least resistance always known. More often than not, there are no stock index option positions recommended.


There's an easy way to boost your investment discipline...

Get Real-Time Trade Notification!

Thursday, October 11, 2012

Austerity Ghouls Haunt for Red October

Go[l]dman Sachs' Lloyd Blankfein today called the Fed "courageous" for its bailout of the banking system. Truly, a man in the know. Confirmation, too, the Fed to be sure is gambling, as I said.

Austerity ghouls know nothing about investment. Cut national defense? Brilliant. Expose yourselves enemies of the state on top of incompetent! Already long-waning industry securely locks the nation in the vicegrips of a debt trap, and these curmudgeons call for yet deeper cuts in the nation's industrial output capacity, begging a jellyfish Congress gut spending on defense. Really? Better see these merely gasping dinosaurs approaching their extinction, as without this necessary event it seems the United States' leading brand of well-defended, transparent, western capitalism otherwise risks being gravely diminished submitting to the prescriptions of a Vampire Trio such as these. Once a front for "shitty deals," ever a front it appears...


Why not consider a rising wedge whose 3rd wave peaked in September and 4th wave has just begun to form? Wave c of 3 certainly was a "rocket ride" and wave b of 3 certainly alternated from wave b of 1, both much as the Elliott Wave Principle's "alternation guideline" would advise one anticipate. Likewise, evidence of alternation in momentum (bottom panel), wave 3 versus wave 1, is exactly as I described it yesterday. And yet, still, exhaustion is confirmed with fading momentum every step of the way higher so far in formation of a rising wedge off early-October 2011 bottom.

Its angle of ascent now established with September's completion of its 3rd wave, some months forming this rising wedge's 4th and 5th waves now appear in store. As you can see, it will be some months before the NYSE Composite Index, conforming to this rising wedge's upper boundary, will exceed its peak of 2011, as should occur. In fact confirmation of a 5-3-5 "zig-zag" up, all the way around, rather requires the NYSE Composite Index reach a new high off its March '09 bottom, how ever minimal. This will take some time, if the above Elliott wave count proves out.

Now it seems wave 4 of (c) rightly should see both relative strength and momentum weaken in relation to that registered during formation of wave 2 of (c), March-May 2012. Using the "alternation guideline" to set wave 4 of (c) expectations, too, might the worst of wave 4 come sooner rather than later, as contrarily occurred during formation of wave 2. So, a quick trip back to the rising wedge's lower boundary—its trend line off October 2011 bottom—could be on the table making for a nasty October in keeping with a previously identified volatility trend on schedule to explode.


Here's the NYSE Bullish Percent Index printing at the same level as preceded May's market decline, this with the NYSE Composite Index likewise trading right about where it stood just prior to succumbing in May. The Composite Index, too, traded higher in September than was reached earlier this year, yet suspiciously saw the Bullish Percent Index decidedly lag, failing to confirm the Composite Index's advance. Exhaustion thus again is confirmed, here in a long-standing, consistent trend going back to successive market highs reached over the duration since 2010. Exhaustion all the more decisively revealed above upon September's completion of wave 3 of (c) thus reasonably sets up for a period of softness rivaling May's.


There's that dynamic line of support-resistance in the S&P 500 going back the 1960s, around which third waves have turned. The 3rd wave of wave (c) of A pierced below it when Lehman Brothers collapsed in September 2008.

Assuming a "rising wedge" is forming wave (c) of B off October 2011 bottom, the S&P 500's dynamic line of support-resistance should fail decisive upside penetration, then.

Still more tempered, too, is last Friday's "Heads Up on a Higher Market," especially seeing momentum exhaustion only but further displayed as the market drifts higher off its October 2011 bottom. This circumstance instead supports probability a rising wedge is forming, and so the S&P 500's now long-term dynamic resistance should cap any further advance over months ahead, as well as prove a point from which the market sinks into a tailspin sometime in the not too distant future.


Fast Money
* * * * *
© The Risk Averse Alert — Advocating a patient, disciplined approach to stock market investing. Overriding objective is limiting financial risk. Minimizing investment capital loss is a priority.

Analysis centers on the stock market's path of least resistance. Long-term, this drives a simple strategy for safely investing a 401(k) for maximum profit. Intermediate-term, investing with stock index tracking-ETFs (both their long and short varieties) is advanced. Short-term, stock index options occasionally offer extraordinary profit opportunities when the stock market is moving along its projected path.

Nothing is set in stone. Nor is the stock market's path of least resistance always known. More often than not, there are no stock index option positions recommended.


There's an easy way to boost your investment discipline...

Get Real-Time Trade Notification!