Monday, June 30, 2008

Short and Simple Pre-Collapse Post


Not one thing Monday defused the ticking time bomb set to go off on Wall Street. There's not much more I need to say.

If there's any pop Tuesday morning, laugh if you must, but by no means worry.

As the market comes fully unglued we need to start thinking about taking profits.

Best guess is sometime before the upcoming long weekend...


OEX 5-min

No matter how the first day of Q3 '08 unfolds, we want to see RSI remain below peaks set last Tuesday (6.24.08) and Wednesday (6.25.08). This would confirm the worst of the stock market's decline is at the doorstep. Today's sideways trade was a step in the right direction.

What else can I say?

Collapse appears imminent ... I mean, it's minutes away.

Look for RSI falling to its lowest level since the S&P 100 peaked on 5.19.08. This would confirm the long-anticipated capitulation has entered stage right.

Thank you and good night...


* * * * *

© The Risk Averse Alert — Advocating a patient, disciplined approach to stock market investing. Overriding objective is limiting financial risk. Minimizing investment capital loss is a priority.

Analysis centers on the stock market's path of least resistance. Long-term, this drives a simple strategy for safely investing a 401(k) for maximum profit. Intermediate-term, investing with stock index tracking-ETFs (both their long and short varieties) is advanced. Short-term, stock index options occasionally offer extraordinary profit opportunities when the stock market is moving along its projected path.

Nothing is set in stone. Nor is the stock market's path of least resistance always known. More often than not, there are no stock index option positions recommended.


There's an easy way to boost your investment discipline...

Get Real-Time Trade Notification!

Friday, June 27, 2008

"Oversold" Only in Complacency


Let me guess... You're wondering whether the stock market is "oversold." You're concerned there seems to be a great deal of negative sentiment in the mainstream ... the kind of thing typically coinciding with a market bottom.

You're thinking that, because Herr Kudlow polled his twelve disciples on Friday asking whether "the stock market is doomed," this could mean the market is imminently poised to reverse and bolt higher. Yes, there was the fact that, four of the Kudlow twelve answered in the affirmative. That's contrary indication enough it would seem. Yet, that this question was even publicly aired should be considered a buy signal, no?

Indeed, one of Kudlow's guests on Friday suggested so much! And I am rather glad he did. Do you know why? Well, how about I give you three guesses, and let's just say for the fun of it the first two don't count.

Alright, I'll make this easy for you...

What was revealed by relatively low volume of shares traded during the market's advance from March 17, 2008 through May 19, 2008? What was the reason shares were not increasingly being offered up for sale as the market rose during this period?

Remember ... the so-called "wall of worry" is not demonstrated by idle chatter on CNBC coming from analysts who wouldn't know "oversold" from "over-hyped." Rather, it is revealed by increasing volume of shares traded as the market rises.

And since precisely the opposite occurred as the market rose from March 17th through May 19th, what conclusion can be made about the market's underlying tenor?

Owners of trillions of dollars of equity evidently were not worried. What, then, was driving their behavior opting to hold rather than sell?

It was the same psychological disposition demonstrated by that one member of the Kudlow crew who reflexively assumed the market must be at or near bottom simply because scary Larry asked whether "the stock market is doomed."

This commentator's knee-jerk reaction plainly is further evidence of an embedded attitude one should find rather peculiar at a time when tensions on several fronts are increasing. The word I use to describe this is complacency.

Oh, just you forget about that $3.5 trillion sitting on the sidelines in money market accounts. It's there because investors are having the hardest time deciding which smoking sector of the stock market is worth risking life and limb, right? With so many "sure thing" opportunities, the owners of all that cash just don't know where to begin, right?

WRONG.

Remember this demonstration of how complacency is persisting even at this late hour. Over days straight ahead you are likely going to see it evaporate. The gnashing of teeth will in all probability become deafening.

Watch Maria go from her usual squeaky, "hot for action," hype torrent ... to a downbeat Prozac poster child moaning about relentless selling she worries might never end. That's when bottom will be in sight.

As of Friday's close, the stock market is by no means oversold. Rather, it is perfectly poised to come unglued and bring some really nice bank to those who are long July OEX Put options.


DJIA weekly

If one company representing 20% of all U.S. retail sales (Wal Mart) is considered a relevant benchmark of how the consumer is doing, then one stock index consisting of only 30 stocks representing 30-40% of the U.S. stock market's total capitalization also is a relevant indicator of how one of the riskiest financial assets is faring on the slippery slope where greed and fear intermingle in constant pursuit of capital appreciation.

Weeks ago I argued the similarity of the present period to 2001 and 2002 ... with regard to what weekly RSI performance one could reasonably anticipate in the then-yet-to-unfold capitulation.

As projected, weekly RSI lifted to the area of balance between buy-side and sell-side strength (i.e. 50). And now, as forecast, the lug nuts are coming off the market's wheels. The Dow Industrials have broken to a new, post-summer '07 low with weekly RSI about as close as can be to confirming the move lower.

However, our concern right now is whether the stock market is oversold. What answer is given by RSI registered in 2001 and 2002 (let alone 1998)?

That's right... It's a resounding, "Look out below!"


OEX weekly

Now you see why I presented the chart of the Dow Jones Industrials first. Simply by adding another 70 shares to come up with the S&P 100 index, the picture might not seem quite as conclusive.

However, considering the stark similarity of [weakening] RSI performance leading to the top in 2000, and then again in 2007 ... with sell-side strength subsequently becoming well-established then, as now ... eventually leading to an RSI bounce to a position of balance (i.e. 50) then, and now (coinciding with the S&P 100's May 19, 2008 peak) ... and, finally, a turn lower in the index taking RSI to a relative sell-side extreme then, and now still to come...

Possibilities presently before us are amply projected by what occurred in 2001 and 2002.

Bottom line... The S&P 100 is nowhere near an oversold extreme.


NYSE weekly

Broadening our view of the entire stock market, we see much the same picture looking at the NYSE Composite ... from the formation of its top last year ... to its subsequently establishing sell-side strength ... to its recent bounce taking RSI to a point of buy-side and sell-side balance ... and now to its resumption of weakness.

Again we see the NYSE Composite also has yet to register a weekly RSI reading one could call an "oversold" extreme.

But what should we make of the fact the NYSE Composite has yet to sink below its January/March '08 low?

Is this significant? Or is the fact broad-based selling has yet to sweep across the stock market simply indicative of underlying complacency?

Before I answer this as definitively as the wider array of underlying technical measures allows, let's broaden our view to include all issues traded at the Pump and Dump...


NASDAQ weekly

It's pretty much the same story as we saw with the NYSE Composite.

So, what do we make of the fact broad measures of "the stock market" such the NYSE and NASDAQ Composite have yet to break to new low ground for the year, where as large-cap indexes have?

Is a base possibly forming from which the market will resume its advance, carrying indexes beyond last year's peak? Are price-RSI divergences signaling a bottom, much as happened late '02, early '03?

Well, first of all, price-RSI divergences presently are tentative and not yet as well-established as they were during the late '02, early '03 period.

Second, index declines back in '02 had resulted in RSI falling to extreme levels reflective of a capitulation, where one could claim stocks were oversold. This has yet to happen in the present period.

And third, in the process of forming price-RSI divergences none of the above indexes were setting new lows early in '03. Contrarily, the Dow Industrials and S&P 100 just this past week fell to new lows, subsequent their '07 peaks.

So, my view of things taking a longer-term perspective is that all indications of complacency persisting are finding indexes with plenty of room to crush whatever hope is breeding fearlessness in the face of deteriorating technical underpinnings reflected by RSI performance.

Now let's move the view in a bit...


$NYA
$COMPQ

Nice pick-up in the volume of shares traded Friday. In other words, selling interest in the current period is accelerating. NASDAQ, particularly, showed a great deal of weakness despite only falling a quarter percent.

Do you see any technical divergences in RSI or MACD? Me neither.

Do you know what that means?

The trend is your friend.


$CPC

CBOE Put/Call Ratio ... Perfect. By no means is there any indication bearish sentiment is extended.


$VIX

VIX ... Excellent. Holding above its 200-day moving average. Recall Pete Najarian noting this condition typically signals a period of heightened volatility. Coincidence? I think not. Again, we see no indication bearish sentiment is extended.


$NYHL

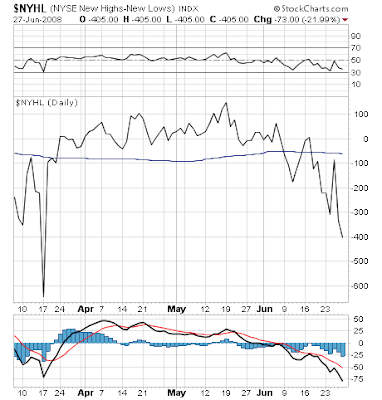
NYSE New 52 Week Highs-Lows ... Outstanding. Slowly ratcheting lower ... accelerating its descent each step of the way ... confirming the move lower in the index.


$NAHL

Ditto NASDAQ New 52 Week Highs-Lows.

Both NYSE and NASDAQ still have further to fall before New 52 Week Highs-Lows challenge negative levels reached over the past year. We might realistically expect some bullish divergence to develop, if the current period is setting up the stock market for a melt-up — all forthcoming negative conditions reflective of capitulation notwithstanding.

Onward...

NYSE McClellan Oscillator ... Oh! Nice. Recovery barely discernible despite Friday's seeming resistance to continuing Thursday's smash.

What about the oscillator's developing divergence over the past two weeks while NYSE has continued declining?

Uhhh... What date has the oscillator been diverging from? That's right: June 6, 2008 ... the day the Dow was crushed for 400 points.

And was the market's decline on June 6th nearer the beginning or the end of its present move lower? That's right: it was nearer the beginning.

So what does this mean? It means the worst is yet to come. In fact, I believe it is right at the doorstep.

NASDAQ McClellan Oscillator ... Beautiful. It too barely budged on Friday, despite mistaken appearances the NASDAQ Composite might be trying to bottom.

I suspect both the NYSE and NASDAQ McClellan Oscillators are perfectly poised to exhibit that fuller measure of capitulation I have been forecasting for some weeks now. By all appearances, the various measures you see on the McClellan charts provided by DecisionPoint are near to registering new low readings over the period since last summer when the market's current consolidation began. Such would demonstrate capitulation.

Granted, the Summation Index has some way to go. However, so too do the NYSE and NASDAQ Composite indexes. Both are vulnerable to continued selling, with the period marking the worst underlying technical tone since last summer quite likely imminent.


OEX 5-min

I would LOVE to see the downwardly sloping channel containing price action following Thursday morning's thud continue holding up. Such a configuration would set up quite nicely for a couple days of relentless selling.

Are you ready dear Maria?

I told you this was going to be a turkey shoot! But no, you just couldn't stop listening to all your big shot broker friends, could you? Pity.

I can barely believe how perfectly everything continues falling into place. Still, I haven't forgotten anything can happen. Nothing is set in stone.

All due humility notwithstanding, though, the Elliott Wave Guy's July OEX Puts are looking rock solid...

* * * * *

© The Risk Averse Alert — Advocating a patient, disciplined approach to stock market investing. Overriding objective is limiting financial risk. Minimizing investment capital loss is a priority.

Analysis centers on the stock market's path of least resistance. Long-term, this drives a simple strategy for safely investing a 401(k) for maximum profit. Intermediate-term, investing with stock index tracking-ETFs (both their long and short varieties) is advanced. Short-term, stock index options occasionally offer extraordinary profit opportunities when the stock market is moving along its projected path.

Nothing is set in stone. Nor is the stock market's path of least resistance always known. More often than not, there are no stock index option positions recommended.


There's an easy way to boost your investment discipline...

Get Real-Time Trade Notification!

Thursday, June 26, 2008

A Kiss-of-Death, Love-Fest on Wall Street


Do you ever remember being in school and being asked a question that, at first, seemed a curve ball, but when you learned the answer your reaction was, "Duh!" Well, I have got one for you.

First, though, have no doubt: I could go on a wishy-washy journey of uncertainty about what might unfold next in the stock market's capitulation.

I could once again, today, reference the NYSE and NASDAQ McClellan Oscillators and (contrary to my position stated just yesterday) suggest these now might be supporting the position I raised on Monday, where I called attention to the possibility the market might be about to bounce, much like it did last November - December '07.

However, having closely watched today's trading unfold ... having seen with my own eyes its tone being exactly like the market's advance from its March 17, 2008 low to its May 19, 2008 high (except today, accompanying meager buying interest reflective of a crisis of confidence there existed a good bit more willingness to offer up shares for sale) ... there's just one conclusion anyone in their right mind should make in characterizing today's action:

Wall Street was smitten by the kiss of death.

This was freely given even before the market opened ... when Goldman Sachs placed Citigroup and General Motors on their "Conviction Sell List." Then, it was returned in kind when Citigroup put Morgan Stanley on theirs.

Not the kind of love that plays well in a theater whose audience has been quite adeptly smelling smoke over the past few months. That lil ol' crisis of confidence turned into infant vestages of downright fear.

And the kiss of death moved to touch everyone's wallet from the opening bell to the closing gavel.

So class ... now that all the clues are on the table, I will ask you: what naturally follows the kiss of death?

C'mon. The answer is so simple!

A FUNERAL! (I know ... DUH!)


OEX 5-min

This is the same short-term S&P 100 chart I presented yesterday. Right off the bat you should note the "You Are Here" label has not only not moved, it has gone backward.

I am principally attempting to demonstrate price-RSI similarities here...

First, draw your attention to the two declines I have delineated by vertical red lines. Both were preceded by brief periods when the S&P 100 was rising while its [buy-side] RSI was diminishing. Obviously, the magnitude of the more recent declining period (beginning late yesterday and extending through today) is much greater than the former (6.17.08).

Now, zero in on the circled blue area. Imagine it being of comparable magnitude in relation to the S&P 100's decline from late yesterday through today. That's the funeral train I suspect will be barreling down on the stock market any moment now.

If my assessment here is correct, the next couple days could be the most negative period since last summer's top.

One other thing worth noting here... RSI registered during today's decline did not exceed its worst reading registered during the formation of the channel contained by the parallel gray lines. This suggests today's decline has much further to go.


NYSE 5-min

Again, despite today's bloodbath, RSI on the broader NYSE Composite did not exceed its worst reading set during the index's initial move lower in its current leg down. Ditto, then, the likelihood there's more selling yet to come.


NASDAQ 5-min

Same story at the Pump and Dump. Oh look! Another "running correction" (wave ii of 3; an Elliott Wave Guy thing) ... As I noted on the chart of the S&P 100 presented in "The Letter 'L' Brought to You By Don's Big Forehead" (that headline CRACKS ME UP!), this is a very bearish formation. To see it followed by today's gap open lower only adds confirmation NASDAQ is about to take a Big Dump.


Investors IntelligenceThis is a chart I came across showing the differential between Bullish and Bearish Investment advisers taking data from the Investors Intelligence weekly survey.

Taking a cursory look at this one might suppose the stock market is just a capitulation away from forming a solid bottom.

Indeed, it appears the 2nd half of 2002 could offer something of a price-sentiment window into the current period ... particularly considering the market's July '02 capitulation and subsequent bottom basing.

What Was THAT?

The above link is to a post appearing on Barry Ritholtz's "Big Picture" blog. He was soliciting opinions about today's decline.

One reader, following a couple dozen negative comments, suggested the market must be ready to reverse given how many people were bearish.

Although in some ways I would agree with this assessment (the market could rapidly reverse following its pending capitulation), I felt it appropriate to comment on this reader's remark. My observation might have some bearing on how you might best look at the above chart plotting the differential between bullish and bearish investment advisers...

"When the bank for the British royal family (RBS) is 'forecasting' continued credit market troubles ... when the European Monetary Union is essentially declaring war on the Fed with threats to drive the exchange rate value of the dollar into the depths of hell ... you must appreciate how these are, indeed, extraordinary times in which we are living. Therefore, resorting to analytical points of reference which in the past have proven statistically meaningful may now prove an exercise in futility."

Indeed, haven't we just seen this bear out with Jim Cramer's disclosure a couple weeks ago revealing the S&P Oscillator is registering a reading indicating the stock market is extremely oversold?

And have we not again seen this via Jon Najarian's noting the "Volatility Spread" might be indicating a prospective stock market bottom is at hand?

Ditto what the Bullish-Bearish Investment Adviser differential seems to be suggesting.

Granted, I will be the first to admit all these indications probably are signaling a turn is near. Yet, might not all things pointing to a pending bottom ... and all things supporting my view for a stock market melt-up (look over to the left) ... need tempering, largely out of consideration for the $3.5 trillion pile of cash sitting on the sidelines?

I mean, after all, it is there for a reason...

* * * * *

© The Risk Averse Alert — Advocating a patient, disciplined approach to stock market investing. Overriding objective is limiting financial risk. Minimizing investment capital loss is a priority.

Analysis centers on the stock market's path of least resistance. Long-term, this drives a simple strategy for safely investing a 401(k) for maximum profit. Intermediate-term, investing with stock index tracking-ETFs (both their long and short varieties) is advanced. Short-term, stock index options occasionally offer extraordinary profit opportunities when the stock market is moving along its projected path.

Nothing is set in stone. Nor is the stock market's path of least resistance always known. More often than not, there are no stock index option positions recommended.


There's an easy way to boost your investment discipline...

Get Real-Time Trade Notification!

Wednesday, June 25, 2008

A Gnashing of Teeth Capitulation, Beatles Style


Same picture, different day, and you might be happy to know the boatload of July OEX Puts I am hauling should be doing just fine sometime in the next couple days.

But let me be honest... Those 520s? They probably will not be in-the-money anytime soon.

A double, a triple, or more? Oh yes, a most distinct possibility. And just days from now.

What's ahead on the road to OEX 520 hit me like a ton of bricks this evening. The capitulation: maybe it wouldn't be the weeping kind. You know ... the one I've been talking up ... the one I suggested on Monday was probably off the table.

That's right ... it's the one which, up until last Thursday (6.19.08), was looking to unfold a lot like the crash of October '87 ... the Big Bang kind, where suddenly in a matter of days, 20% ... vaporized ... a bloody, tear-laden, shock to the irrational senses of the CNBC kind.

Apparently, however, this just will not do. So, beyond objective rationale for supposing the moment has passed for the market to collapse in a crash event, what better things might come in a different kind of capitulation ... namely, the gnashing of teeth kind?


OEX 5-min

Might not a seemingly never-ending ratchet to new, post-5.19.08 lows better serve the purpose of making Maria (and all the other perma-bulls) moan like a lost child once bottom finally is reached sometime over the weeks ahead?

Let me tell you. That girl's negative sentiment back in October '02 was the next best thing to Wall Street ringing an "all clear" bell.

Beside forecasting a trip to levels at which major indexes bottomed back in '04, I am willing to bet the last thing Maria Bartiromo will be is "hot for action" following a prolonged, tortuous decline to my tentative S&P 100 objective in the vicinity of 520.

The above short-term chart of the S&P 100 presents something of a template revealing what might unfold before the stock market bottoms and subsequently proceeds to melt up. It's also suggesting one be very careful in picking spots to trade OEX options.

Right now, however, the direction is clear. A sharp decline is near. Yet, I suppose some reading this might be incredulous ... overcome with nervousness caused by incompetents who give technical analysis a bad name with words like "oversold."

Well, you go have yourself a look at the NYSE and NASDAQ McClellan Oscillators. You tell me if something about their behavior since mid-April '08 up to the present moment is suggesting anything other than stark, underlying weakness. Show me some plainly evident divergence signaling the March low will hold, and thus indicating the market is on the verge of melting up.

Oh, I know, the McClellan Oscillator is just one technical measure. It simply is not prudent to rely on one single indicator when there is so much at stake...

So, go look again at the CBOE Put/Call Ratio. Take a gander at the VIX, too.

They're all suggesting the same thing...

LOOK OUT!

Helter Skelter.

Oh, here she come...


* * * * *

© The Risk Averse Alert — Advocating a patient, disciplined approach to stock market investing. Overriding objective is limiting financial risk. Minimizing investment capital loss is a priority.

Analysis centers on the stock market's path of least resistance. Long-term, this drives a simple strategy for safely investing a 401(k) for maximum profit. Intermediate-term, investing with stock index tracking-ETFs (both their long and short varieties) is advanced. Short-term, stock index options occasionally offer extraordinary profit opportunities when the stock market is moving along its projected path.

Nothing is set in stone. Nor is the stock market's path of least resistance always known. More often than not, there are no stock index option positions recommended.


There's an easy way to boost your investment discipline...

Get Real-Time Trade Notification!

Tuesday, June 24, 2008

The Letter "L" Brought to You by Don and His Big Forehead


Hey... Remember that Dukes of Hazard thing I did yesterday ... screeching the brakes on a crash event, doing a couple donuts and pealing off in the opposite direction?

Well, Yee haw! Let's do it again...

We have here today an Elliott Wave view whose love for a handful of July OEX 520 Puts is as deep as these slightly tarnished gems are out of the money.

Before I elaborate, let me just say I am truly delighted to have these jewels in my possession right now. Even if I am wrong about their worth astronomically exploding over the next several days, the odds they will ever become an albatross are about as near zero as can possibly be. This market is going lower. You can quote me on that.

Though still true that, "Lovers, Not Market Forecasts, Are For Marrying," there is every reason to believe the stock market did not hit bottom today. In fact, it did nothing but add further weight to all the evidence I have presented these past many weeks suggesting a giant thud is in store.

Now, once this meltdown finally comes to pass — be it now (as I am thinking today, knowing tomorrow to be sure is but another day), or some weeks away — an even bigger melt-up will in all probability follow. Let's not forget that.

Indeed, already my wheels are turning. What kind of cute headlines will I come up with when the market launches on its moon shot?

"Wall Street and Luskin Agree: Auto Industry Shutdown Good For America"

"$10 a Gallon Drained from Main Street Fuels Wall Street into Orbit"

"Dow Up 3 As Middle Class Wealth Pours into Market Celebrating Obama Landslide"

Alright, let's get back to the current act in the big show (or as Maria Bartoromo would say, giving it her best Ed Sullivan, "really big shew")...


OEX 5-min

If you have been following my Mr. Market Twitter, you might recall a certain anticipation I've had toward OEX RSI at 5-minute intervals. I've been expecting it to rise above its peak set last Thursday (6.19.08). Well, the wait is over.

Not that it happened today ... because, in fact, it didn't. Today's advance in the S&P 100 failed to carry RSI higher than last Thursday.

Rather, up until today I have been taking a slightly different view of the S&P 100's decline since last Tuesday's open (6.17.08). Now I consider the area marked in red on the above chart and see price-RSI performance that fits to a tee what an Elliott Wave Guy would expect.

Except for one thing... Last Friday (6.20.08) RSI registered a new, post-6.17.08 low. Normally, RSI would have come in above its low set on Wednesday, 6.18.08.

So, what did Friday's new RSI low suggest? The S&P 100 would sink lower still. And this it did.

Then today, too, the S&P 100 sunk even further ... doing so prior to RSI ever rising above its peak set last Thursday. This suggests the S&P 100 has still lower to go ... despite today's recovery.


NYSE 5-min

Contrast the NYSE Composite's performance following its peak last Tuesday (6.17.08) with that of the S&P 100. NYSE price-RSI performance is typical. RSI troughed at the moment I would expect and diverged as the NYSE Composite sunk lower.

Today's extension of the NYSE Composite's move lower ... prior to RSI ever rising above its peak set last Thursday ... likewise suggests the index will fall further still, despite today's recovery ... and despite RSI at the same time finally extending beyond its high last Thursday.


$OEX

Earlier this month I presented my S&P 100 Elliott Wave count up to the May 19, 2008 peak. The above chart carries this forward.

Should this view be correct — should the S&P 100 be on the verge of collapsing to the area of 520 — its decline will unfold in five waves. The first two of these already have been completed.

The second wave you see — if my interpretation, indeed, is correct — is a very bearish formation. Seeing this just prior to what typically is the most powerful wave of five waves in either direction (i.e. the third wave) is like peanut butter jelly time. It says, "Look out below!"

If this view is correct, disregard the channel lines I drew on the same chart yesterday.

Last Friday's volume bump (or as Clouseau would say ... bimp) supports the likelihood the S&P 100 has further to fall.

So too does the fact no price-RSI or MACD divergence has even begun to form as the S&P 100 continues it fall from its May 19, 2008 peak.


$NYHL

Tom Petty sings... I'm free ... free fallin'.


$NAHL

Free fallin' ... free fallin'


$VIX

As the movers and shakers of volatility do their best Kevin Bacon in Animal House, saying, "Remain calm ... All is WELL!"

Did you read my comments to the article titled, "Volatility 101" at optionMONSTER?

My initial thoughts are most definitely worth considering here.

If the stock market holds up for a while on Wednesday, I may just go all in.

I need to sleep on it, though...

* * * * *

© The Risk Averse Alert — Advocating a patient, disciplined approach to stock market investing. Overriding objective is limiting financial risk. Minimizing investment capital loss is a priority.

Analysis centers on the stock market's path of least resistance. Long-term, this drives a simple strategy for safely investing a 401(k) for maximum profit. Intermediate-term, investing with stock index tracking-ETFs (both their long and short varieties) is advanced. Short-term, stock index options occasionally offer extraordinary profit opportunities when the stock market is moving along its projected path.

Nothing is set in stone. Nor is the stock market's path of least resistance always known. More often than not, there are no stock index option positions recommended.


There's an easy way to boost your investment discipline...

Get Real-Time Trade Notification!

Monday, June 23, 2008

Lovers, Not Market Forecasts, Are For Marrying


Just a quick look today at where I expect the S&P 100 to fall before a fairly substantial bounce develops...


$OEX

Somewhere just slightly south of 590 is the objective. Once this level is reached I suspect the current leg of the stock market's ongoing, multi-month correction (beginning last summer) could very well be complete.

Have no doubt: there's more to go in the market's move lower. I continue expecting a capitulation — a steep sell-off taking the S&P 100 to the vicinity of 520.

However, before this shock wave develops, I am presently expecting a bounce ... and, indeed, supposing it could be a fairly substantial one at that. Believe it or not, we might even see the S&P 100 recover its entire loss since May 19, 2008 ... and then some ... possibly right up to its 200-day moving average.

How's that for screeching the brakes on a crash event, doing a couple donuts and pealing off in the opposite direction?

Hey, that's just the name of the game. I cannot make the market do as I suspect it will ... when I want it to. Rather, I can only develop some sense about the big picture, then put the pieces of the puzzle together using what's left of the pieces scattered on the table.

The big picture, of course, is my expectation a capitulation will complete the stock market's multi-month correction beginning last summer. This likelihood is formed by evidence I have presented over many weeks prior. I continue standing behind the elevated probability this eventually will unfold.

However, the piece of the puzzle defying my expectation is the one supposing a crash event might occur right now. This has not happened. So, it's time to put this piece back on the table and wait for a better opportunity to fit it into the big picture.

I have not said anything about why, beginning in mid-May, I expected a crash event to promptly unfold, were it, indeed, time for the market's much anticipated capitulation. Beyond what possibilities an Elliott Wave Guy is capable of anticipating, there also were cyclical reasons raising my suspicion. I prefer not talking about these, though, because they seem more often than not to cast a pall of unwarranted certainty upon what are otherwise murky possibilities.

As things presently stand, I simply must take all the evidence before my eyes and suppose some slight variation in possibilities is developing. There simply is no denying it. I could fight it, but, as they say, resistance is futile. When there's money at stake I would be a complete idiot! Not gonna do it.

So, the minute the S&P 100 falls to the area of 590ish I am bailing out of my July OEX 520 Puts. At that time, too, I will be looking to go long July OEX Calls.

Just look what happened late-November through early-December '07. I suspect something quite similar is about to unfold...

* * * * *

© The Risk Averse Alert — Advocating a patient, disciplined approach to stock market investing. Overriding objective is limiting financial risk. Minimizing investment capital loss is a priority.

Analysis centers on the stock market's path of least resistance. Long-term, this drives a simple strategy for safely investing a 401(k) for maximum profit. Intermediate-term, investing with stock index tracking-ETFs (both their long and short varieties) is advanced. Short-term, stock index options occasionally offer extraordinary profit opportunities when the stock market is moving along its projected path.

Nothing is set in stone. Nor is the stock market's path of least resistance always known. More often than not, there are no stock index option positions recommended.


There's an easy way to boost your investment discipline...

Get Real-Time Trade Notification!

Friday, June 20, 2008

Did Scott McClellan Save Stock Market From Collapse?


If there ever were an occasion when political fireworks might fly, it was on Friday when former Bush White House Press Secretary, Scott McClellan, appeared before the House Judiciary Committee. Would a seismic shock develop, blowing apart the foundation of regulatory ineptness — a decades-old Washington specialty the Bush administration has elevated to world class status worthy of a satrap of the British Empire?

Not if the so-called "free press" was to have a say!

From the bog where it is often difficult to distinguish between Arthur Sulzberger, Jr. and Prince Phillip, the New York Times — in keeping with their new and improved mantra: "All the Fits News to Print" — coincidentally reported Israeli military exercises earlier this month that "American officials" (read: Dick Cheney) suggested were a rehearsal for an attack on Iran.

If the financial media are to be believed — NEWSFLASH! they're not — it was this news that rattled financial markets. An attack on Iran apparently threatens still higher global crude oil prices ... and you don't need me to explain what this means.

Any honest observer, of course, wonders whether an attack on Iran simply represents convenient psychological cover for global credit inflation whose restless liquidity seeks investment in valuable "things" physical?

First, though, he considers the timing of the New York Times' disclosure that, an attack on Iran might be imminent. Funny it should come on such a big day on Capital Hill...

Mr. McClellan's performance truly was a thing of bipartisan beauty. Both sides (but not everyone) engaged in thoughtful dialog. Nothing terribly shocking, really, came from any of it, though.

Personally, I believe Scott McClellan has done the country a great service with his candor about the "permanent campaign" adversely affecting Washington politics. I will look forward to reading his book, "What Happened: Inside the Bush White House and Washington's Culture of Deception."

So, has the next astronomical leg up in crude oil prices (and all other commodities) been delayed?

I couldn't tell you. All I know is the stock market's capitulation might be postponed a couple weeks...

I have on several occasions indicated the Elliott Wave Principle affords a measure of flexibility allowing an alternate view toward the stock market's immediate prospects while keeping one's general perspective unchanged. We might be looking at one such occasion where maintaining an open mind toward the stock market's anticipated capitulation is well-advised.

The index performance disparity we continue witnessing — S&P 100 vs. NYSE Composite vs. NASDAQ Composite — remains a concern of mine. Despite things generally proceeding as I have been anticipating, conditions reflecting a broadening of despair across wider segments of the stock market have been defying my expectation for an imminent collapse resembling the crash of October 1987.

Furthermore, Thursday's (6.19.08) advance broke ranks with the stock market's performance during options expiration week of October '87. This might be a minor thing, but were the current period marked by a similar underlying selling urgency, it seems reasonable to suppose such an advance at this late hour represents something of a red flag.

Add to this the fact Friday's decline did not decidedly negate Thursday's turn higher. Indeed, we might have anticipated a widening of issues declining versus advancing on both the NYSE and NASDAQ ... relative to, say, 6.6.08, when the market fell with its biggest thud since peaking on 5.19.08. But this did not happen.

Then came word from Jon Najarian in a CNBC interview indicating the Volatility Spread had narrowed to levels last seen at the March bottom. (Rather than explain the Volatility Spread here, check out the article "Volatility 101" at optionMONSTER.)

So, now I have doubts about the present period's parallel with October '87...

Let me show you, then, what might be the S&P 100's alternate position in moving toward a capitulation completing the multi-month correction it began last summer.


$OEX

A picture's worth a thousand words, so the only thing I should mention here is a probable, upcoming opportunity to bail out of July 520 Puts. Chances are real good the S&P 100 will move still lower from here before it bounces ... and do so sooner rather than later. So, as soon as I am ready to close out my July 520 Puts, I will alert those of you who have opted to receive Trade Notification. I expect to break even or bank a slight profit.


$CPC

The CBOE Put/Call Ratio also reveals a present similarity to the early-November '07 period. So, there's added evidence suggesting the market might stabilize here rather than crash.


$VIX

The Volatility Index presents an interesting read.

First, consider its divergence from earlier this month ... this while the market has proceeded to trade lower over the interim. On one hand I might suspect this condition reflects underlying complacency. Indeed, how can I not think so?

Yet, there's its 200-day moving average presenting something of a barrier ... a point of resistance. Now, were this 200-day moving average not an evident inflection point over the past year or so, I would not bring it to your attention. However, as you clearly can see, it has been. Although nothing is set in stone, it appears this tendency might continue.

Finally, the VIX shows the stock market is nowhere near washed out. In the grand scheme anticipating a capitulation there's a long way yet to go.


$BPNYA

Another demonstration of a technical measure indicating the stock market might be at an inflection point. We see here, too, there's a lot of room for further selling, even if this is delayed a week or three.


$BPCOMPQ

Same story at the Pump and Dump. Furthermore, the greater degree to which the NASDAQ Composite has been holding up since 5.19.08 is confirmed by how this measure is holding above its 200-day moving average. Yet, NASDAQ's lower Bullish Percent (relative to NYSE) also might be suggesting the NASDAQ Composite will fall a good bit more before it bounces.

So, then, if the stock market does not come unglued immediately (and I believe there's good reason to suspect it won't), let's get ready to play the bounce, build up our risk capital and turn this unexpected delay in the stock market's capitulation into our greater advantage...

* * * * *

© The Risk Averse Alert — Advocating a patient, disciplined approach to stock market investing. Overriding objective is limiting financial risk. Minimizing investment capital loss is a priority.

Analysis centers on the stock market's path of least resistance. Long-term, this drives a simple strategy for safely investing a 401(k) for maximum profit. Intermediate-term, investing with stock index tracking-ETFs (both their long and short varieties) is advanced. Short-term, stock index options occasionally offer extraordinary profit opportunities when the stock market is moving along its projected path.

Nothing is set in stone. Nor is the stock market's path of least resistance always known. More often than not, there are no stock index option positions recommended.


There's an easy way to boost your investment discipline...

Get Real-Time Trade Notification!

Thursday, June 19, 2008

Smoking Pots Calling Financial Kettles Black


The index performance disparity continued in earnest today and with maddening effect. Are Wall Street's soon-to-be financially distressed investment banks the writers of June OEX Puts below the market?

But alas... Goldman Sachs has put Citigroup, Bank of America and several well-known regional banks in the cross-hairs. Talk about the pot calling the kettle black! War is breaking out on Wall Street. Might the attacked soon strike back?

Could GS possibly escape the carnage sending the regionals back to 1994 ... and distressed commercials to Dubai and Asia? Methinks all financials might be due for one more round of a no confidence vote — Goldman included. Their boy at Treasury will in all likelihood fail in his attempt to saddle the People with Wall Street's ill-advised risk.


OEX 5-min

Are we now but continuing last week's grope for a bottom? I think not. Today's RSI recovery — much better than I expected — brings the index right to the brick wall it hit yesterday ... which is right where an Elliott Wave Guy would expect a resumption of selling.


NYSE 5-min
NASDAQ 5-min

Today's recovery was slightly less robust on the NYSE than it was at the Pump and Dump.

The NASDAQ ... the NASDAQ ... who do these boiler rooms think they're fooling?


$NAHL

Today's meager improvement in NASDAQ New 52-Week Highs-Lows is very suspicious. Given how the NASDAQ Composite held up quite well all day — raising the probability the boiler rooms are located right on Wall Street — there should have been a broader impact on issues supporting the 1.5% launch higher ... at least you would think anyway. That there wasn't suggests the lug nuts probably are about to fall off.


$NAAD cumulative

There must be plenty of bargains to be had on NASDAQ, right? Just look at NASDAQ's cumulative advance-decline line. It's in free-fall. This simply is not the kind of condition indicative of healthy financial underpinnings capable of withstanding the round of heavy selling I have been anticipating.

Will this situation improve once the stock market hits bottom and the melt-up I am forecasting commences?

Probably. But not much more than it did from August '06 through February '07.

The condition we are seeing at the fringe of equity finance (NASDAQ) is precisely as one would expect over the months and years leading up to a major bear market. Say hello to my little friend: Dow 3600...


* * * * *

© The Risk Averse Alert — Advocating a patient, disciplined approach to stock market investing. Overriding objective is limiting financial risk. Minimizing investment capital loss is a priority.

Analysis centers on the stock market's path of least resistance. Long-term, this drives a simple strategy for safely investing a 401(k) for maximum profit. Intermediate-term, investing with stock index tracking-ETFs (both their long and short varieties) is advanced. Short-term, stock index options occasionally offer extraordinary profit opportunities when the stock market is moving along its projected path.

Nothing is set in stone. Nor is the stock market's path of least resistance always known. More often than not, there are no stock index option positions recommended.


There's an easy way to boost your investment discipline...

Get Real-Time Trade Notification!

Wednesday, June 18, 2008

Perfectly Poised for a Crash and a Melt-Up


Welcome back, friend, to my stock market forecasting oasis. You're here again at a most fortunate time. Money seeds we have just planted ... in ground rich in rock solid analysis ... are about to bear fruit.

The U.S. stock market accu-forecast is calling for several hot days of severe selling, with a 70% chance of a thunderous crash, followed by a heavy shower of tears.

Right now, all continues looking a lot like October 1987. Wednesday of options expiration week then, saw the S&P 100 sink and close to a new post-peak low. And so, too, was true today.


$OEX

How about that nice bump in volume. We like seeing this because a still-unfolding capitulation rightly should bring more (and more) shares to market.


OEX 5-min

Yes sir, look at today's RSI when trading opened with a thud. It's the lowest reading since the S&P 100 took a hard turn south on Friday, June 6, 2008. Thus, we see RSI confirming the index's decline to a new, post-6.6.08 low. What else could we ask for?

Well, there's the fact RSI has yet to sink as low as was registered on Tuesday, June 3, 2008. What is this suggesting? It's telling me the S&P 100 has yet to blow. There's more selling still to go.

Now, how about that nice RSI recovery to a point of balance between buy-side and sell-side strength, this while the S&P 100 more or less trended sideways. Do you remember the last time we saw this happen?

It was during the stock market's initial leg down following its May 19, 2008 peak.

Everything presented yesterday suggesting further selling is imminent remains intact. In fact, if there ever were three consecutive days during which I was anticipating a steep decline, I would not want things under the covers looking any different. The set up for a collapse is, indeed, perfect.

Now about the "why" of what looks to be coming, I should like to expand a bit on a recent thought. I spoke of it last Friday (6.13.08) in "How Jim Cramer Might Soon Regret His S&P Oscillator Forecast."

There I detailed the June OEX open interest situation ... which, even now, remains much the same. I mentioned that, if you have read "Reminiscences of a Stock Operator," you have some better sense of how strong hands in the stock market work to shake weak hands of their shares.

Surely, should the S&P 100 be driven lower going into Friday's expiration, a raft of Put options will be moved "in the money." Subsequently, come early next week, the need to meet financial obligations could drive the writers of these positions into creating a tidal wave of selling.

You probably have not been given to consider a possibility so simple. So, let me describe what present circumstance rationalizes this view suggesting strong hands now are about to behave no differently than they did in October 1987 ... because, indeed, a big, bad, earth shattering collapse could have less to do with the typical spin about trouble here, there and everywhere, and instead be a manufactured event simply meant to shake weak hands of their shares.

Truth is this scenario seems to back the story behind the performance dichotomy we're seeing in major indexes. There's a reason the NASDAQ Composite has been holding up better than other indexes. For one, since the peak in 2000 it has been the most battered. Thus, there could be a perception of more unrealized value waiting to be pumped to irrational extremes.

No doubt there's also some measure of over-confidence and/or fearlessness giving rise to declining volume since the March bottom. Given the stock market's performance over the past quarter century, though, is it really any wonder?

Likewise, it plainly appears the greater preponderance of players do not wish to miss the next big rally. So, the embedded psychology behind dreams of American financial pie baked with the faith of our fathers remains very much alive.

Furthermore, outside the demise of Wall Street Structured Finance, the mechanisms for creating copious loads of credit continue lifting the financial system's burdensome debt load like a well-oiled body builder. Add to this a $3.5 trillion stash of steroids sitting in low-yielding money market accounts and we have an explosive mixture...

Here we call it melt-up fuel.

However, the simple fact of the matter is shares are not being offered up for sale.

So, maybe an October 1987-style panic is what's needed to get the show back on the road. It worked then, so why not now?

Think about it.

The crash of ‘87 was in the grand scheme of things a shakedown — a transfer of shares from weak hands to strong. You only need consider what followed the crash. The market never looked back.

This time, however, I don’t suppose we’ll be so lucky. Fortunately, though, we have plenty of time to explore the approaching prospect of a Dow 3600 bear market...

* * * * *

© The Risk Averse Alert — Advocating a patient, disciplined approach to stock market investing. Overriding objective is limiting financial risk. Minimizing investment capital loss is a priority.

Analysis centers on the stock market's path of least resistance. Long-term, this drives a simple strategy for safely investing a 401(k) for maximum profit. Intermediate-term, investing with stock index tracking-ETFs (both their long and short varieties) is advanced. Short-term, stock index options occasionally offer extraordinary profit opportunities when the stock market is moving along its projected path.

Nothing is set in stone. Nor is the stock market's path of least resistance always known. More often than not, there are no stock index option positions recommended.


There's an easy way to boost your investment discipline...

Get Real-Time Trade Notification!

Tuesday, June 17, 2008

McClellan Oscillator Trumps S&P Oscillator to Steal Mad Money Show


I see nothing deferring the possibility these next several days could bring a tsunami of selling. In fact, all the evidence seems only to raise the likelihood the stock market's trend downward is about to accelerate.

There has been one thing bugging me lately. I suspect it has been bothering you, too. It's the slow pace at which this much anticipated capitulation phase of the stock market's multi-month consolidation is developing. This decline is slated to take out lows set during January/March '08 and set up the stock market for a subsequent melt-up. So, come on already! Let's go!

Yesterday I alluded to this slow pace at which selling presently is developing ... noting the performance disparity between the large-cap S&P 100, the NYSE Composite and NASDAQ. This suggests a lot more selling probably is in store for the stock market...

...but it says nothing about when this thing will get cooking with gas.


$OEX

Considering the circled areas, I might reduce the picture that says a thousand words to just two: Patience Pays.

The smaller circled areas probably are more revealing in the context of present expectations. However, a potential decline considerably larger is currently unfolding. That's why I also highlighted the early-October '07 through late-December '07 period.

Stick around as it might ... fighting the path of least resistance ... the S&P 100 invariably fell apart ... and with a vengeance.

So, in as much as the above circled areas contain but the beginnings of a much larger decline, the S&P 100's relatively slow descent from it May 19, 2008 peak might be seen similarly. The index's performance thus far in a capitulation projected to sink it to the vicinity of 520 is very much in keeping with its prior behavior throughout its multi-month correction.


$BPOEX

This chart suggests a pending collapse is by no means out of the question. There are plenty of stocks in the S&P 100 yet to turn over. Oh, and don't let the warm temperatures outside fool you. It's like mid-January in the land of large-caps, where big time money managers roam.

Now, as you know, I evaluate several simple technical measures to substantiate Elliott Wave outlook. So, let's take a look at a few of these because they all say, "Look out below!"

First, I give you the NYSE McClellan Oscillator. (Per the various components presented on this chart, you can get a thorough explanation at DecisionPoint.)

Just to refresh your memory ... the McClellan Oscillator revealed the stock market's underlying weakness throughout the entirety of its advance since March 17, 2008. This I have amply noted over the past couple months (see "To Sir Elliott, With Love," for example).

Now observe how the NYSE McClellan Oscillator continues confirming the stock market's weakness. The oscillator is locked on the sell side (below 0) and has been unmistakably trending down since the NYSE's May 19, 2008 peak.

Last Wednesday in "Market Trades Like Being Slapped in the Face by a Woman," I indicated "the NYSE and NASDAQ McClellan Oscillators' ... present dive to the sell-side — clearly breaking down, and supporting the prospect of a pending market meltdown — sets up for a similar bounce to the zero line as occurred last October '07 ... just before the stock market decisively turned over." I also said, "Coincident with the recovery of both oscillators we obviously would expect both indexes to rise, too."

This projection has come to pass over the past few days. So, next up is the stock market's dive to the depths.

Now look at the 5% and 10% indexes in the bottom panel of the NYSE McClellan Oscillator chart. First, note how both indexes since May 19th are trending down in a similar fashion as occurred from early-December '07 through mid-January '08. I'm not sure if the current period's greater steepness means anything. It could.

Finally, observe how the 5% and 10% indexes are similarly positioned to where they stood right before the stock market came unglued in mid-January '08.

Confirming those underlying technical conditions I presented yesterday, the McClellan Oscillator and its components seem to be suggesting things are about to turn volatile.

And speaking of volatility...


$VIX

Let's just say the Volatility Index is not saying the stock market is "oversold."

Likewise, we should expect the VIX to register its worst reading yet since the stock market began its multi-month consolidation last summer.


$CPC

Back on May 30, 2008 I wrote, "Elliott Wave Guy Take Aim in Stock Market Turkey Shoot" and indicated how the CBOE Put/Call Ratio suggests the stock market's January/March '08 lows probably do not mark "bottom." This view strictly is out of expectation for a sell-off reflecting a correction-ending capitulation.

Thus, the Put/Call Ratio itself, as well as its MACD, should register readings worse than those put in at any time since last summer. As you can see, the door is wide open right now to a period lasting several days taking sentiment to the promised land...


From the Mouthpieces of Friend and Foe Alike to the U.S. Constitution...

* * * * *

© The Risk Averse Alert — Advocating a patient, disciplined approach to stock market investing. Overriding objective is limiting financial risk. Minimizing investment capital loss is a priority.

Analysis centers on the stock market's path of least resistance. Long-term, this drives a simple strategy for safely investing a 401(k) for maximum profit. Intermediate-term, investing with stock index tracking-ETFs (both their long and short varieties) is advanced. Short-term, stock index options occasionally offer extraordinary profit opportunities when the stock market is moving along its projected path.

Nothing is set in stone. Nor is the stock market's path of least resistance always known. More often than not, there are no stock index option positions recommended.


There's an easy way to boost your investment discipline...

Get Real-Time Trade Notification!