Saturday, May 31, 2008

Reading Between the Lines Marking Extremes in Volatility


Do you ever give yourself to reading between the lines?

I do it all the time.

I give you the case of Jim Cramer who on Friday said something I quite agree with...

He claimed next week was going to be a "fulcrum week" in the stock market. He was keyed on Toll Brothers and Hovnanian — homebuilders. Both companies are reporting next week.

Cramer was recalling a conversation he had a few weeks ago with Robert Toll. I heard it myself. In no uncertain terms Mr. Toll gave a bleak analysis of the home building market. Cramer was at a loss for words, and let me tell you that says a lot.

So, there he was opening his Mad Money show on Friday pointing to the two major league homebuilders reporting next week, and recalling his conversation with Robert Toll ... reminding viewers how bleak it was ... all in the context of calling for a fulcrum week in the stock market.

And, of course, he did this with all the well-rehearsed red, white and blue spin you come to expect from such a polished outlet of Wall Street hype as CNBC.

Now let's think about this...

Did Jim Cramer just announce his agreement with me the stock market is at risk of cratering? Was he doing the best he could to warn everybody? Could he have been any more convincing about what to expect?

Let me tell you something. Jim Cramer may be a lot of things to a lot of people, but one thing he is not is a knife catcher.

Funny thing, too, he told the story of the worst investment he made for his charitable trust, Action Alerts Plus. It was Charter Communications. The moral of the story? Don't try catching a falling knife. Of course, that's not how he put it, but the conclusion was the same nevertheless.

So, what's he doing, then, by reminding us of Robert Toll's bleak outlook for the homebuilding market? Is he trying to call a bottom or is he revealing the homebuilders are a falling knife?

Well, really, I don't want to read too much into this. I mean, after all, GM, AIG and C — American stalwarts — were each clubbed for some double-digit percentage loss just in the month of May (2008).

Now, I've read a few books on the crash of 1929. Today's breaking companies are much like those that broke in late '28 and then in '29. They created a breading ground for growing volatility, much as I am forecasting dead ahead.

First a meltdown. Then a melt-up. Then Dow 3600.

And can you believe this might all unfold by 2011? Truth is odds are quite good.

Oh, and trust me, I can show you how this would transpire entirely within the realm of all that is quite natural ... all that has happened many times before.

Right now there are more investment banks than you can shake a stick at standing at the very precipice where furious selling would likely carry these firms right over the edge.

Surely, someday, some of these firms, indeed, will be swept away like Bear Stearns. Things like this in the world of finance are as natural as night and day. Furthermore, because problems on Wall Street are man-made, the consequences likewise will be just as natural as peace and war.

Now, let me be clear here. These vital firms control a vast tangle of financial assets at the core of the American economy. The viability of some significant chunk of these is widely being questioned, with many believing the worst of the "credit crisis" is not behind us. However, what's of interest right now is the role financials might play in the stock market's pending meltdown.

Truth is shares of these firms have already arrived at the precipice in a flurry of selling. Look at Lehman Brothers, Merrill Lynch, Morgan Stanley, JP Morgan/Chase, and many other Wall Street houses. The volume of shares traded in financial companies over the past year's "credit crisis" has been quite pronounced, relatively speaking.

FACT: In the past volume spikes have stood as a sign of strong, underlying support. That's why I will assume the worst of the financial stock selling fit has already hit the market (for now). The Washington fix is in, as everyone was assured during the Bear Stearns take down.

This notwithstanding, though, a great deal of tidal turbulence is revealed through the ongoing LIBOR saga. I mentioned the other day the British Bankers' Association's Friday release of its initial report addressing recent turmoil building among financial institutions dependent on the LIBOR system. The one outstanding thing you can see in the reporting of this news (see the IHT and the NYT) is something of a rebellion developing between Mother England and her children on Wall Street. Like a "know-it-all" teenager, Wall Street appears bent on assigning blame for its present problems on a parent who "just doesn't understand."

These are the seeds of Dow 3600.

Wall Street may talk a good game about finding new adoptive parents friendly to its way of thinking, yet the City of London surely will not hesitate reigning in its child with disciplinary measures that threaten a complete withdrawal of support. They did it in 1930 and if need be, they will do it again. The trend is your friend.

So, this in a nutshell summarizes the state of the financial system. Its credibility hangs in precarious balance. Yet, it probably will not soon fall over the edge in spectacular default. Someday, yes. But now? I think not.

What sector(s), then, might lead the stock market lower during its imminent meltdown?

Well, how about those commodities! Energy especially. You'd have to be blind not to see trouble in the present arrangement, no matter how you look at it.

Most disturbing is not inflated prices. Rather, it's that we got here at all. Heck, crude could sink to $90 later this year and this fact would live on. This, in and of itself, is a problem. It stands to affect market psychology for some time to come.

Obviously, pressure is growing to reign this in. Yet, what people generally fail to see is how commodity inflation has bolstered the share prices of many publicly traded companies. It's a significant reason why the stock market remains buoyant, despite the hit financial stocks have taken over the past year.

Seeing clearly the brakes are being applied to the commodities market, the stock market, in its famed capacity to look ahead some months, stands likely to suffer.

I suspect stocks benefiting from commodities inflation will lead the stock market sharply lower over the next few weeks.

Yes, indeed, energy prices are likely peaking ... at least for the time being. Likewise, I believe the same holds true for commodities prices in general.


$CRB

We've already begun to see over the past couple months action indicative of topping in the Commodities Research Bureau index. This conclusion is evidenced by the divergent relationship forming between the CRB and the two technical measures presented on the above chart.

As an Elliott Wave Guy I would also make the case the CRB's path of least resistance over the months ahead could drag the index to as low as 250.

I'll not go on and on. I just wanted to give you some sense of the dynamics I see at work and hope this perspective provides some insight into why I believe the stock market is likely to become quite volatile over the next few years ... in both directions.

* * * * *

© The Risk Averse Alert — Advocating a patient, disciplined approach to stock market investing. Overriding objective is limiting financial risk. Minimizing investment capital loss is a priority.

Analysis centers on the stock market's path of least resistance. Long-term, this drives a simple strategy for safely investing a 401(k) for maximum profit. Intermediate-term, investing with stock index tracking-ETFs (both their long and short varieties) is advanced. Short-term, stock index options occasionally offer extraordinary profit opportunities when the stock market is moving along its projected path.

Nothing is set in stone. Nor is the stock market's path of least resistance always known. More often than not, there are no stock index option positions recommended.


There's an easy way to boost your investment discipline...

Get Real-Time Trade Notification!

Friday, May 30, 2008

Elliott Wave Guy Takes Aim in Stock Market Turkey Shoot


Hey...

You've gotten to know me. You have seen I am exceedingly cautious, methodical and prone neither to hype nor hope. You know I want to play options only when I am dead sure the stock market is at a point where a quick exit is assured. This way, if things aren't just right, I'm out ... not giving away any more time value than reason justifies.

Well, that's where I, and everyone following, are at. And being on top of this I will have you know — keeping in mind I am careful not to hype anything ... and wishing to stay that way —

IT'S GONNA BE A TURKEY SHOOT.

I'm serious.

We're gold.

It's all very simple. Odds resting strongly on an imminent stock market meltdown ... have been, and remain, the substantiated view of this Elliott Wave Guy.

Let's review...

Was it not a bounce I forecast this week? And did I not tell you the Elliott Wave Principle affords an ample measure of flexibility to match the game's underlying reality?

The degree to which the one — the only — S&P 100 chart with an Elliott Wave count is altered by the reality of the bounce is so insignificant as to entirely justify my not going into explaining any of it here. Truly it would only bore you.

As you know I have taken a few, simple technical views and explained how what we are seeing before our very eyes (under the covers) strongly supports the negative outlook the Elliott Wave cautions.

Of course, it's important that, as time proceeds, you stay on top of these things and confirm all remains well. You want to see everything still falling into place, as was originally anticipated.

Well, the truth of the matter is all is well and falling into place. Revealing technical measures are uniformly moving in the very direction one would expect at a time when the stock market historically has been vulnerable to falling decisively. The same points of view I have previously presented continue supporting my negative outlook and confirming it all the more.

I should remind you this forecast of imminent "doom" is a prelude to a stock market melt-up I continue projecting.

You should not lose sight of this when talking heads freak out during the pending collapse.

Now, you could take my reading on the NYSE and NASDAQ McClellan Oscillators, and see how my April 25, 2008 analysis still holds up (as does my follow-up, May 16, 2008 analysis). You would quickly conclude the stock market's underpinnings have only grown weaker, too.

You also could look again at the CBOE Put/Call Ratio.


$CPC

If you consider MACD (presented in the bottom panel), you see the Put/Call ratio is in a similar position to February '08 and December '07. During both these prior periods the stock market was decidedly falling. Again, the trend is your friend.

Now, take a look at the peak this reading registered last August 2007. I suggest it should be exceeded as the stock market collapses straight ahead.

Why is this?

Because corrections end with fear-filled capitulations. Such things — their presence or absence — are confirmed by underlying technical action.

If you're really paying attention, you see further evidence above showing why January/March 2008 could not be the stock market's bottom. The CPC's MACD should have exceeded its August '07 peak, baby.

Here now, I'll go slowly...

Summer 2007 was but the beginning of the market's present multi-month correction. A fear-filled capitulation should bring more pronounced Put buying than came at the correction's beginning. We simply did not see this January/March 2008 when the stock market was cratering.

Add this to a most reasonable Elliott Wave view suggesting the worst is yet to come ... and you have in a nutshell my utter certainty at this advanced, long-anticipated moment. That's how patience pays, I say.

And I believe just how much will be presently revealed.


$OEX

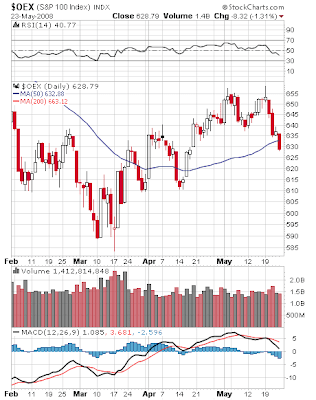
That's what an imminent collapse to the area of 520 on the S&P 100 might look like. The marked areas stand out for their suggesting such a decline could, indeed, happen ... and stat.


OEX 5-min

Now, what if this thing decides to hang around for a few more days? What if the bounce off the first leg down in the stock market's unfolding meltdown "needs" to carry the S&P 100 upward to 647 before the landslide begins?

Of course, I am asking out of consideration for my position's time value. And my thoughts on this, right now, are fairly simple.

First, I could not purchase the next higher OEX strike (in this case, the 625) at a price I paid for my 620. And second, this is why I begin a speculation like this putting only $500 at risk.

Let's put it this way. I simply have a high degree of confidence the S&P 100 will move in my position's favor soon enough (and with much fervor) to present an opportunity to bail out if need be. Truth is I see no reason to even remotely consider this need, though ... not even if the S&P 100 lurches to 647 before falling to the canvas.

It's well enough $500 is a tiny stake. Risk is low because any last-gasp advance to 647 simply stands as a worst case scenario. Even if this occurs, it probably will unfold rapidly, and reverse even faster. In other words, if the stock market should continue holding up, it likely will be only for a day and not much more.

Were this to happen, might we possibly anticipate a price-RSI performance exhibiting a measure of irrational exuberance more extreme than when major indexes topped on May 19, 2008?

Yes, we might.

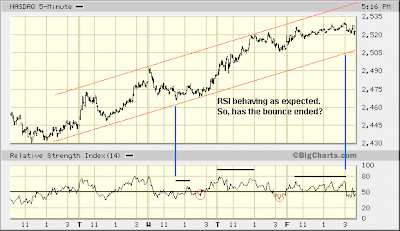
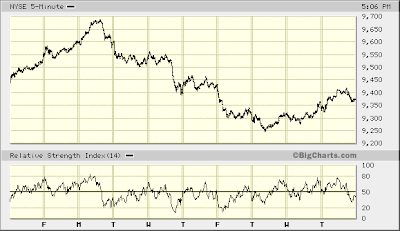
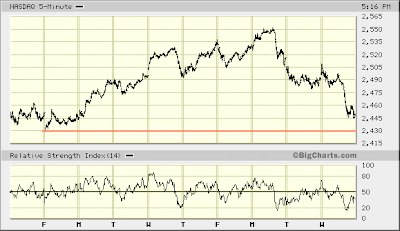
But is it also possible the S&P 100 already completed its bounce? The stock market's "generals" failed today to extend yesterday's gain — unlike the broad market. Is this not a reaffirmation of a foretelling weakness being displayed in a market prone to killing its generals?

It could be.


NYSE 5-min
NASDAQ 5-min

As you can see, the same questions surrounding the stock market's immediate prospects (i.e. over the first couple days trading next week) are raised by its broadest measures. Maybe they've peaked, maybe they haven't. Either way, there's not much further to go before the really big show begins...


Commodity Policies Set for Revision
(This very well could be what leads the stock market's meltdown)

Should Not Political Pressure Only Grow?

* * * * *

© The Risk Averse Alert — Advocating a patient, disciplined approach to stock market investing. Overriding objective is limiting financial risk. Minimizing investment capital loss is a priority.

Analysis centers on the stock market's path of least resistance. Long-term, this drives a simple strategy for safely investing a 401(k) for maximum profit. Intermediate-term, investing with stock index tracking-ETFs (both their long and short varieties) is advanced. Short-term, stock index options occasionally offer extraordinary profit opportunities when the stock market is moving along its projected path.

Nothing is set in stone. Nor is the stock market's path of least resistance always known. More often than not, there are no stock index option positions recommended.


There's an easy way to boost your investment discipline...

Get Real-Time Trade Notification!

Thursday, May 29, 2008

Just Like When Brian Bet Stewie Mike Tyson KOs Carol Channing


I do believe we little ones are about to collect big on our tiny wager betting on a seeming long-shot ... that is, once someone asking, "Where's my money," bloodies that smart aleck dog, Wall Street.

Might some real-life "Stewie" be the British Bankers' Association, which on Friday releases its initial report reviewing the LIBOR system? Could this raise suspicions of financial fraud within the banking industry to frightening proportions?

I got the search warrant out looking for anything suggesting whether today's [anticipated] advance presented a problem. I might as well have been looking for a mango grove on Antarctica.

On Tuesday I suggested index price targets that, "would work for me ... with or without some sort of RSI divergence signaling a completion of the presently unfolding, counter-trend rally."

We hit those targets today...


NYSE 5-min

For the NYSE Composite I indicated the area of 9400-9450 ... and Bingo was his name-o.


NASDAQ 5-min

And for the NASDAQ Composite I said 2505-2520 would work for me...

"For assuredly, I say to you, whoever says to this mountain, ‘Be removed and be cast into the sea,’ and does not doubt in his heart, but believes that those things he says will be done, he will have whatever he says."

(And I have neither once cursed a fig tree nor a money tree!)


OEX 5-min

As you can see, the chart of the S&P 100 to which I applied an Elliott wave count yesterday did not unfold as I had suggested it might. Now you should understand why I choose not to glaze over your eyes covering this stuff. The Elliott Wave Principle simply is far too flexible an analytical tool — extremely useful as it is — to go into all the details highlighting [finite] possibilities.

Besides, it's a lot easier quoting Christian Scriptures.

That said, though, I highly recommend you learn the Elliott Wave Principle. You could, for example, not only better analyze "the stock market," but also look at a chart of, say, Microsoft and see why it probably is about to fall from $28 to somewhere in the mid-teens.

(My apologies to the cast of CNBC's Fast Money. They've been persistently pumping the creator of the Vista operating system ... and, not only am I an unhappy user, I see with my own eyes MSFT might just be perfectly poised to break lower than it has traded in the past ten years.)

Getting back to the S&P 100 ... take a look at price-RSI action on the chart above from late Monday, 5.19.08 (the day the index topped and turned over, beginning what I believe will be its much anticipated meltdown) through mid-day Wednesday, 5.21.08.

Note how RSI generally remained biased to the sell-side (i.e. below 50) and was seemingly improving — appearing to diverge — while the S&P 100 continued moving lower. Then came Wednesday's (5.21.08) afternoon thud.

Now, take a look at this...


OEX 1-min

It's the chart of the S&P 100 over the past ten days plotted at one-minute intervals (the prior chart is plotted at five-minute intervals).

You see a similar price-RSI performance late this afternoon after the index topped and turned over going into the close. This could mean the bounce off last week's decline is over. The S&P 100 appears poised to move lower on Friday.

Also notice how near today's top RSI reached a buy-side extreme not seen since the S&P 100 peaked on Monday, 5.19.08. This fine display of irrational exuberance is a fitting prelude to the market meltdown I believe is at hand.

Those on my list were notified of a trade I initiated today. CLICK HERE for instructions on how to receive real-time OEX trade notification, so you can follow along.


(Presented before the U.S. Senate Committee on Homeland Security and Governmental Affairs, May 20, 2008 ... If nothing else, read the first paragraph on page 4)

* * * * *

© The Risk Averse Alert — Advocating a patient, disciplined approach to stock market investing. Overriding objective is limiting financial risk. Minimizing investment capital loss is a priority.

Analysis centers on the stock market's path of least resistance. Long-term, this drives a simple strategy for safely investing a 401(k) for maximum profit. Intermediate-term, investing with stock index tracking-ETFs (both their long and short varieties) is advanced. Short-term, stock index options occasionally offer extraordinary profit opportunities when the stock market is moving along its projected path.

Nothing is set in stone. Nor is the stock market's path of least resistance always known. More often than not, there are no stock index option positions recommended.


There's an easy way to boost your investment discipline...

Get Real-Time Trade Notification!

Wednesday, May 28, 2008

Will the Real Amazing Capitulation Please Stand Up!


I will never forget it... It was October 2002 and the stock market was falling to its lowest levels of a three year bear market (whose duration and extent I had forecast in January 2000, by the way). It was then I discovered "The Maria Bartiromo Sentiment Index."

Poor girl was just moribund. You would have thought she had just been told Ted Kennedy was her real father. She was depressed and finding it impossible to squeak a single Pollyannish word. You couldn't help but suppose a bottom was at hand.

Of course, being an Elliott Wave Guy I had a strong suspicion. However, I wanted to share this with you because, who knows, I might learn tomorrow Dick Cheney is my real father and have a fatal heart attack.

So, now that you're aware of "The Maria Bartiromo Sentiment Index" you should have a pretty good idea when the stock market is soon to melt up. Just listen for a fatal tone of anguish fearing ratings are about to plummet. (Goodbye big raise ... hello $5 a gallon!)

Continuing this trip down memory lane, allow me to take you back a couple years earlier...


$OEX

I marked a memorable week in April 2000. Over those five short days I multiplied a $5000 OEX Put position into a $40,000 take. You bet it was sweet.

And there's a reason I wanted to show you this.

Take a close look at trading during early April 2000, just prior to that big, 12% down week. Focus in on Tuesday, April 4, 2000 — an incredibly volatile day. First up, then down, then back up. Having traded in a nearly 60 point range, the S&P 100 finished the day just 7.33 points lower. That same day the NASDAQ Composite was down as much as 13% (HUGE!), only to close 3% lower.

It simply was one of those days that "cleared the air." It raised the red flag signaling, "Beware!" A lot of technical damage was done.

What followed, though, was what I wanted to show you. You see how the S&P 100 advanced over the next three days right back to the high it reached on April 4, 2000? It was one of the most pathetically weak advances I have ever seen. It was screaming, "Trouble!"

And this was precisely what I had anticipated following the stock market's April 4, 2000 whip-saw. That's why I took on a big OEX Put position on Monday, April 10, 2000.

Now, here's the thing you should know... There's a lot of similarity between trading following April 4, 2000 and trading since the March 17, 2008 bottom.

We have the red flag whose waving I most recently covered in "To Sir Elliott, With Love." And we have the crisis of confidence whose character effectively reveals underlying weakness by way of a persistently diminishing volume of shares traded on the NYSE.

My concern is only all the more compounded by an evident lack of willingness among the stock market's vested interests to offer up shares for sale since the March 17, 2008 bottom ... despite growing pressure on the physical economy and well-hidden risks in the financial system. This simply demonstrates a degree of complacency scarcely ever rewarded throughout the stock market's long history.

And finally ... last week ... the long anticipating meltdown began ... with a slaughter of the stock market's generals.

Oh, and by the way...

Jeff Mortimer, Senior Vice President and Chief Investment Officer—Equities at Charles Schwab Investment Management, announced today on CNBC, "The March lows were an amazing capitulation."

Well, that's what makes a stock market! And you know what Mr. Mortimer? Even if I were Ralph Kramden, I would have no compunction whatsoever to panic and say, "Hummana, hummana, hummana."

That's the nice thing about having a healthy measure of skepticism I guess.

I get that from my mother. She once told me not to believe everything you hear ... and only half of what you read. See mom, I listened!

Of course, there's that little thing called "evidence" suggesting the "amazing capitulation" is but days from exploding onto the scene. And yes, I remain quite sure of it ... so, the half of what you read my mom says you can believe hinges on her well-known reputation for calling out Jeff Mortimer whenever he is wrong.


OEX 5-min

A Risk Averse Alert first! Elliott Wave counts. Oh joy. Can you imagine if I bored you to tears explaining all of this?

But you get the idea. I think the market's bounce has just a bit more to go.

You've heard the expression "dead cat bounce," right? Well, baby, this is it ... an options time value killing extravaganza ... just purring like a little kitten.

It shouldn't last much longer, though. When to say when probably will be here (finally!) before week's end.


NYSE 5-min
NASDAQ 5-min

As you can see, all the above indexes are within striking distance of the respective bounce targets I indicated yesterday.

You should also duly note the rotation from the market-leading NASDAQ to the NYSE Major League took center stage over the course of today's trading. This is just as one might expect in the waning moments before Mr. Market rolls over and plays dead...

* * * * *

© The Risk Averse Alert — Advocating a patient, disciplined approach to stock market investing. Overriding objective is limiting financial risk. Minimizing investment capital loss is a priority.

Analysis centers on the stock market's path of least resistance. Long-term, this drives a simple strategy for safely investing a 401(k) for maximum profit. Intermediate-term, investing with stock index tracking-ETFs (both their long and short varieties) is advanced. Short-term, stock index options occasionally offer extraordinary profit opportunities when the stock market is moving along its projected path.

Nothing is set in stone. Nor is the stock market's path of least resistance always known. More often than not, there are no stock index option positions recommended.


There's an easy way to boost your investment discipline...

Get Real-Time Trade Notification!

Tuesday, May 27, 2008

Paving the Way for a Squeaky Bartiromo On-Air Meltdown


Did you happen to notice the NYSE Composite finished slightly negative today while the NASDAQ Composite rose 1.50%? Oddly enough, too, the NYSE advance/decline ratio was 19/11. Now that's curious! Nearly two stocks up for every stock down and the NYSE Composite finishes lower.

As best as I can tell, there were no specific sectors putting a drag on today's NYSE trading. I simply must assume the very gravity of the stock market's still unfolding crisis of confidence was subtly revealed as such. The problem really is apparent, too, seeing how the NYSE struggled to turn around today, and follow the lead of its electronic brethren of pump and dump fame.


NYSE 5-min
NASDAQ 5-min

This morning's pullback to the boiler room gap open on NASDAQ came as a bit of a surprise. This steeper than expected fall notwithstanding, though, NASDAQ's RSI maintained its upside bias throughout the day as the index proceeded to lead the stock market higher. So, this suggests the market's bounce (projected by yours truly) still has legs.

The question is how much follow-through might we reasonably expect?

NASDAQ 2505-2520 would work for me ... with or without some sort of RSI divergence signaling a completion of the presently unfolding, counter-trend rally ... (more below).

The NYSE Composite topping out in the area of 9400-9450 similarly is a rational objective to an Elliott Wave Guy. Likewise, seeing the NYSE Composite outperform its NASDAQ counterpart from here to the top would be a welcome development, given the outlook for an imminent meltdown.


OEX 5-min

In keeping with prospective NYSE and NASDAQ bounce targets the S&P 100 should top in the 635-640 range. (The lower the better ... maintaining harmony with the large-cap drain that has thus far dragged the stock market lower since last Monday, 5.19.08.)

Now, if we see a pop tomorrow carrying indexes to their above stated objectives ... with respective RSI readings reaching an eye-opening extreme ... this, indeed, would be about the most beautiful thing we could hope for here. Given anticipation for an accelerating decline culminating in a crash over the days ahead, such a fine display of irrational exuberance would be a most fitting prelude to that end.

One "danger" here is the market turns lower tomorrow and Thursday, only to scream higher on Friday. This scenario would have the market's "bounce" turning into a sideways consolidation, and taking longer to unfold. There's reason to suppose, though, this will not happen, and today's bounce will end sooner (say, tomorrow) rather than later.

On Friday (5.23.08) I said, "The next day or three could raise a sense of urgency about the outlook I presented last week suggesting the stock market is about to embark on an accelerated decline resembling the crash of October 1987." I am feeling this already.

If there's one thing I would prefer seeing by the close of business this Friday (5.30.08), it is the stock market trading lower and still giving every indication it is on the verge of falling apart early next month...


(See why David Einhorn, President of Greenlight Capital, was giving CNBC's Maria Bartoromo fits today about Wall Street investment bank transparency ... fingering Lehman Brothers in particular ... much to Squeaky's "astonishment.")

* * * * *

© The Risk Averse Alert — Advocating a patient, disciplined approach to stock market investing. Overriding objective is limiting financial risk. Minimizing investment capital loss is a priority.

Analysis centers on the stock market's path of least resistance. Long-term, this drives a simple strategy for safely investing a 401(k) for maximum profit. Intermediate-term, investing with stock index tracking-ETFs (both their long and short varieties) is advanced. Short-term, stock index options occasionally offer extraordinary profit opportunities when the stock market is moving along its projected path.

Nothing is set in stone. Nor is the stock market's path of least resistance always known. More often than not, there are no stock index option positions recommended.


There's an easy way to boost your investment discipline...

Get Real-Time Trade Notification!

Friday, May 23, 2008

$500 Looking to Come Up Roses Over Wall Street War Dead


So, I did not pull the trigger on a trade. I simply am satisfied to see my outlook more definitively confirmed before jumping in. This worked fine in '02 and it will work again. Patience pays with certainty guiding when to say when. As I indicated yesterday, this is where I am at.

It has been a good week forecasting the stock market's every little move. Wednesday's thud and today's drop were definitely playable. I have been gun shy, though, because I am anticipating something much bigger. And this probably was a mistake on my part. A $500 initial stake could easily have been turned into $750 or more with a couple, quick hit trades. The added pad would have helped going forward.

This is mildly distressing because bounces this week have been a bit more problematic. They practically have been non-existent. This more or less kept me from initiating any trade.

But I am not complaining. It's all good. Weakness this week further confirms my crisis of confidence thesis, reflected by the low volume of NYSE trading leading up to Monday's top. Buyers failing to step up to the plate with the market moving lower this week only further reveals potential danger.

Likewise, the distribution of selling this week across the various indexes I follow continues demonstrating how complacency remains ingrained among the stock market's vested interests.

Should the market bounce as I expect early next week and the volume of shares traded shrink to an even more pathetic level, then forget about it. It's game over. An avalanche likely will follow soon after.


$OEX

When the generals are weak, how strong can the army be? Look how much ground the S&P 100 lost this week.

What's reassuring, too, is selling did not possess any of the characteristics indicative of capitulation. There's every reason to believe this week's decline was but the beginning of a turn lower in the stock market, rather than completing a consolidation of recent advances (say, since mid-April).

Of course, this is quite as one would expect given the wealth of evidence the stock market's advance off its March 17, 2008 low last week appeared near a turning point. Indeed, as I indicated last Friday, "If ever there were a time when a reversal of fortunes could come sweeping down upon the stock market like an avalanche, that time is now." Having sensed, "There simply can be no further delay," it has been reassuring to see Mr. Market dutifully obey.

Thus, "certainty" I claimed yesterday that, "the stock market very much appears on the verge of a meltdown," is elevated by such confirmation as this week's trading has given my outlook.


$NYA

As you see, this week's trading did not impact the broader NYSE Composite index as greatly as the high-capitalization S&P 100 index. On Wednesday I indicated "[this] suggests there's still a lot of selling yet to come." It still does.

Of course, nothing is set in stone. The next day or three could raise a sense of urgency about the outlook I presented last week suggesting the stock market is about to embark on an accelerated decline resembling the crash of October 1987. Despite showing little sign of buy-side strength this week, chances are the market is about to bounce.


$COMPQ

I wanted to throw in the NASDAQ Composite chart for good measure because performance across both major U.S. stock exchanges is consistent with my outlook, both over the next few days and over the next few weeks.

Today's decline to a new low for the week coincided with a lower volume of shares traded on both exchanges (relative to Wednesday). This indicates an exhaustion of selling sweeping across the stock market this week. Hence, my sense the market is poised to bounce.

Although both the NYSE and NASDAQ Composite indexes are finding support at the same relative levels, NASDAQ once again is showing how it demonstrates a leadership role in both directions. Its advance beginning two weeks ago and its decline this week were of greater magnitude, percentage-wise, than occurred on the NYSE.

Both indexes are similarly showing a building, underlying technical weakness. Note how both RSI and MACD at present are registering lower readings than two weeks ago. Subtle though it may seem, this condition is supportive of my outlook for a lot of selling yet to come.


NYSE 5-min
NASDAQ 5-min

You see here a closer look at how, even despite today's selling taking both the NYSE and NASDAQ Composite to new lows for the week, NASDAQ appears to be paving the way for the stock market to bounce.

However, sometime over the next week or so we should see the stock market accelerate lower. So, here's hoping for a bounce with volume bordering on pathetic...

* * * * *

© The Risk Averse Alert — Advocating a patient, disciplined approach to stock market investing. Overriding objective is limiting financial risk. Minimizing investment capital loss is a priority.

Analysis centers on the stock market's path of least resistance. Long-term, this drives a simple strategy for safely investing a 401(k) for maximum profit. Intermediate-term, investing with stock index tracking-ETFs (both their long and short varieties) is advanced. Short-term, stock index options occasionally offer extraordinary profit opportunities when the stock market is moving along its projected path.

Nothing is set in stone. Nor is the stock market's path of least resistance always known. More often than not, there are no stock index option positions recommended.


There's an easy way to boost your investment discipline...

Get Real-Time Trade Notification!

Thursday, May 22, 2008

Precious Few Investors Will Not Be Caught With Their Pants Down


Experience reveals it is a rare moment when virtual certainty about the stock market's imminent fate prevails. If you have been at the game of investing for as long as I have, then you understand how precious a thing "certainty" is. It is a sense as rare as air on the moon.

Those of you who have been reading my musings over the past couple months know I am careful to convey a reasonable tone of diffidence. I am generally mindful not to pound the table about anything.

Still, the stock market very much appears on the verge of a meltdown. I believe the next few weeks stand to be the ugliest seen on Wall Street in several years. And as much as certainty is possible, I am, in fact, quite sure of it.

This might be new news to you. So, consider my confidence ... look closely at the opportunity I am freely presenting ... and make this blog your Memorial Day weekend assignment. A low-risk opportunity to turn chump change into something you can use to help make your life beautiful is here.

To those of you who already know the plan here is where we stand...

Save providing a great opportunity to initiate an OEX Put position, trading today was a favorable follow-up to what has thus far transpired this week. What I want to see now is really quite simple.


OEX 5-min

First is selling taking the S&P 100 decidedly below Wednesday's (5.21.08) low. Then, a recovery right back to the area in which the S&P 100 traded today. You should get a feel for the potential dimensions of this via the lines drawn on the above chart.

This could all happen tomorrow. I would very much like to be positioned before the upcoming long, Memorial Day weekend. However, I will let the market decide when to say when.

What's really good to see at this point is nothing suggesting this week's turn lower is anything but a pause in the stock market's advance since the March 17, 2008 low.

Now, this might strike you as odd. You might think I would prefer seeing growing signs of underlying weakness.

Truth is it's the perfect set-up for a bloodbath. The path is being left wide open for maintaining such disbelief as sustains complacency well into an accelerating decline.

So far this week, top to bottom, the S&P 100 has fallen 3.5%. However, scarcely a dent has been made in those various technical readings reflecting the underlying state of the stock market I have presented here recently.

Indeed, anyone other than an Elliott Wave Guy might take this as a sign of strength. And who knows? Maybe it is.

Yet, if the stock market is on the verge of collapsing, then is not this seeming show of "strength" rather to be expected? After all, since when does a majority of the stock market's vested interest act accordingly prior to a heart-stopping crash?

NEWSFLASH! When the stock market sells off sharply, most players are caught with their pants down.

We are seeing precisely the measure of oblivious disregard for danger that perfectly sets the stage for an unmitigated disaster. Last Friday's "You Are Here" looms large.

* * * * *

© The Risk Averse Alert — Advocating a patient, disciplined approach to stock market investing. Overriding objective is limiting financial risk. Minimizing investment capital loss is a priority.

Analysis centers on the stock market's path of least resistance. Long-term, this drives a simple strategy for safely investing a 401(k) for maximum profit. Intermediate-term, investing with stock index tracking-ETFs (both their long and short varieties) is advanced. Short-term, stock index options occasionally offer extraordinary profit opportunities when the stock market is moving along its projected path.

Nothing is set in stone. Nor is the stock market's path of least resistance always known. More often than not, there are no stock index option positions recommended.


There's an easy way to boost your investment discipline...

Get Real-Time Trade Notification!

Wednesday, May 21, 2008

Crude Oil Lubricates Gears Driving Stock Market Into Meltdown


"In my capacity as the chairman of a significant political action committee, I must focus my comments on the top-down reality of the present situation. The onrushing collapse of the global floating exchange rate monetary system is accelerating, in a hyper-inflationary mode. Nothing is being done by any governments around the world to stop it. Today, in May, with petroleum prices soaring past $130 a barrel, with prices of food and other basic commodities skyrocketing, with the collapse of the international banking system moving apace, it is certain that the situation we shall encounter in June, July and August will be far more severe than the crisis we face at this moment, as bad as it already is.

"We have been gripped by a global, hyper-inflationary crisis since approximately July 25, 2007, three days after my announcement of that condition. We are now approaching an actual breakdown-crisis, more or less like that hyper-inflationary crisis which struck Weimar Germany in the Autumn of 1923. Whatever the actual date of the global breakdown event, we are entering a new phase in the present world, hyper-inflationary depression. Up until this moment, all policymakers in London, on Wall Street, and in Washington, are being insane, in their denials of this reality."

— Lyndon H. LaRouche Jr., May 21, 2008


Yesterday I said, "I think there's one more trip into new, post-3.17.08 high ground before the fireworks begin." This possibility remains faintly alive. However, its pulse was significantly weakened today, so I do not think odds of it occurring are all that good now.

This afternoon's collapse was just a thing of ugly. It was the very essence of the crisis of confidence I have been hammering on for some days now, and it swept over the stock exchange like a dark, ominous cloud. Call me what you will for having recently forecast trouble ahead. Just be sure you understand luck does have some part in it.

I mean it... Nothing is set in stone. I am loath to pound the table about anything ... even now. Instead, I am intent on letting the market announce when it is reasonably safe to pull the trigger. I believe the moment to act upon such rare opportunity as I have been forecasting for some weeks now has finally arrived.

In fact, I almost jumped in today just before 1:00 p.m... I held off, though, because one particular element of uncertainty was unsettling my will to take the risk. It took this afternoon's thud and a reasonable view toward trading disparities occurring in the various indexes I follow to conclude that the very conditions we should wish in place prior to a meltdown are, indeed, before our very eyes.


OEX 5-min

Interestingly enough, large-cap indexes (like the S&P 100) which have been lagging notably over the past couple months are now leading the way lower. To be honest, it was this condition's manifestation today (prior to this afternoon's meltdown) ... wherein the Dow Industrials were getting slapped around while the broader market was being coddled ... that made me unsure whether one final advance to new, post-3.17.08 high ground might still be in order.

Then came underlying truth's revelation ... bringing all sectors to equally join in the carnage by the end of the day.

And yet, the large-cap S&P 100 continues in its forward position, where it apparently is slated to lead the way still lower. You see this by the fact the index has fallen below its low set on Friday, May 9, 2008.

Contrarily, the broader NYSE and NASDAQ Composite indexes have yet to cross below the lows they each respectively set at that time...


NYSE 5-min
NASDAQ 5-min

What we're seeing here makes a great deal of sense in light of expectations for an imminent mini-collapse.

Large-caps are where the big money in the stock market is at (forgive me for stating the obvious). So, were a crisis of confidence indeed real (and I most certainly believe it is), then it stands to reason large-cap indexes, like the S&P 100, should behave just as we are witnessing and, indeed, lead the way lower (at least initially).

What's more, that a performance disparity persists between the large-cap S&P 100 index and broader indexes like the NYSE and NASDAQ following this afternoon's swoon ... suggests there's still a lot of selling yet to come. Soon enough the broad market's negative performance should dwarf that of large-cap indexes like the S&P 100. This, quite simply, is how sustained declines typically unfold.

Recall those "just not right" technical conditions underlying the stock market's performance over recent months. Add to this the evidence I am presenting here showing how the present crisis of confidence is manifesting itself through the performance of the various stock indexes I follow. Top this all off with a concern that surely must be growing in all relevant circles of interest — no matter what analytical methodology (technical or fundamental) they subscribe — as energy prices continue their parabolic ascent.

Indeed, this latter concern is becoming less abstract with each passing day. Today, both AMR and the U.S. Congress demonstrated how the threat of skyrocketing energy prices is very, very real.

You don't need to be a financial genius to fathom the catch-22 vested interests in the stock market are presently facing. On the one hand, profit prospects for U.S. corporations are beginning to look increasingly tenuous, at best. And on the other, it's simply much too early to think about how one might protect one's equity stake without risking a blow out of one's financial wherewithal. In fact, it appears we are fast approaching a moment when the fear of suffering an unrecoverable loss might become the overriding motivation driving decided action in which safety is sought at all costs.

What we have here is the making of a perfect storm ... precisely what I have been forecasting. I can hardly believe my eyes.

So, here's hoping we see some strength tomorrow providing an opportunity to initiate an OEX Put position. Specifically, I want to see the S&P 100 rise to the area where I almost pulled the trigger today (645). We might not be so lucky, but that's okay. Right now, it is well enough that conditions for rapidly multiplying $500 into five-figures over the days ahead are appearing increasingly likely.

I'm not sure how many weeks it has been since I raised the probability the March 17, 2008 low would be taken out. Originally I had given this likelihood a 40% probability, but then subsequently raised it to 70%.

It sure seems that, if this probability is to become manifest, the moment of truth has arrived...


* * * * *

© The Risk Averse Alert — Advocating a patient, disciplined approach to stock market investing. Overriding objective is limiting financial risk. Minimizing investment capital loss is a priority.

Analysis centers on the stock market's path of least resistance. Long-term, this drives a simple strategy for safely investing a 401(k) for maximum profit. Intermediate-term, investing with stock index tracking-ETFs (both their long and short varieties) is advanced. Short-term, stock index options occasionally offer extraordinary profit opportunities when the stock market is moving along its projected path.

Nothing is set in stone. Nor is the stock market's path of least resistance always known. More often than not, there are no stock index option positions recommended.


There's an easy way to boost your investment discipline...

Get Real-Time Trade Notification!

Tuesday, May 20, 2008

Wall Street All Filled Up With Fudge?


Suddenly, the two recent waterboardings on Wall Street make some sense. The stock market could, indeed, fall apart tomorrow ... but, like I said yesterday, I think there's one more trip into new, post-3.17.08 high ground before the fireworks begin.


OEX 5-min

Were it not for clues indicating things under the covers are just not right ... and were it not for other indications suggesting the stock market is near to turning over ... I might be wise to consider other credible possibilities as we approach the final month of this year's second quarter.

Yet, here we are once again with hopelessly bankrupt financial institutions facing the challenge of convincing vested interests to swallow still greater helpings of fudge baked at the Fed. Yes Larry, credit may be easing, but do you know what the trouble is? No one but you and your Tory crew is believing it will do any good ... and this is a HUGE problem defying spin. The crisis of confidence simply cannot be shouted down, sir.

So, is it any surprise, then, the group leading today's decline was the still-leveraged-to-the-teeth financials? This group is not just one of many. No! Indeed, for the past couple decades (up until last year) financials were the very engine of earnings growth for corporate America. And that engine has seized up. Wall Street structured finance — the real-life wicked witch of the West — is dead.

(FYI: former JP Morgan/Chase CEO John Lipsky called Structured Finance "the lynch-pin of the U.S. economy" back in '02 when he testified before a Senate Committee investigating the collapse of Enron. The accuracy of this statement is testified to by the extraordinary nature of measures taken by both the Fed and the Congress since the so-called "credit crisis" began last year.)


* * * * *

© The Risk Averse Alert — Advocating a patient, disciplined approach to stock market investing. Overriding objective is limiting financial risk. Minimizing investment capital loss is a priority.

Analysis centers on the stock market's path of least resistance. Long-term, this drives a simple strategy for safely investing a 401(k) for maximum profit. Intermediate-term, investing with stock index tracking-ETFs (both their long and short varieties) is advanced. Short-term, stock index options occasionally offer extraordinary profit opportunities when the stock market is moving along its projected path.

Nothing is set in stone. Nor is the stock market's path of least resistance always known. More often than not, there are no stock index option positions recommended.


There's an easy way to boost your investment discipline...

Get Real-Time Trade Notification!

Monday, May 19, 2008

On the Second Wall Street Waterboarding Within a Week


What a day...

You know, it's all well and good to note how the low volume of trading on the NYSE over recent weeks reflects a crisis of confidence on Wall Street. However, what good is this observation when the consensus trade holds its position while prices are bid higher? You can imagine my consternation as another low volume tribute to Goldilocks carried indexes higher, with scarcely a pause along the way, right into mid-day today.

On the plus side ... supportive of my view the stock market is about to turn sharply lower ... is the fact the NASDAQ Composite has been under-performing the NYSE Composite ever since last Wednesday (5.14.08) ... a day that was rather similar to today, particularly by its avalanche of selling going into the close.


NYSE 5-min
NASDAQ 5-min

Now, there's a reason I did not publish any analysis of 10-day index charts in my last two posts. Truth is trading last Wednesday (5.14.08) bewildered me. I did not quite know what to make of the late day price-RSI collapse (in fact, I still don't ... at least not conclusively).

One good turn deserves another they say. In as much as last Wednesday's (5.14.08) turn-around came unexpectedly, so too did today's.

Looking at the NYSE Composite ... RSI confirmed the index's rise all the way to today's top, just as it had last week prior to Wednesday's (5.14.08) late-day collapse. Again, this sort of price-RSI performance is atypical (I discussed this last Wednesday). It suggests the stock market has farther to rise.

Be that as it may, the NASDAQ Composite is no longer showing the same leadership it was demonstrating early last week. Its advance has largely stalled since its peak last Wednesday (5.14.08).

Will the NYSE Composite now follow suit and similarly stall while the NASDAQ Composite begins to show distinct signs of turning over? Obviously, this is what I will be looking for. Of course, I would expect this to occur with all due subtlety, the likes of which Mr. Market has made into a science.


$OEX

The S&P 100 finally traded at a new, post-3.17.08, intra-day high today. High-cap indexes (like the S&P 100 and the Dow Jones Industrials) have been lagging badly over the past couple months. Their leadership today confirms the stock market is in the late stage of its advance off the March 17, 2008 low.


OEX 5-min

Another meaningless trend line for your viewing pleasure. We should like to see the S&P 100 take a leadership role over the days ahead as the stock market reaches its summit and falls off the precipice. Could it trade all the way up to the top of its rising wedge? Could it pull off another sideways levitation, much as occurred following April '08 options expiration?

Time will tell...


A New Inflationary Epoch
(Scroll toward the bottom to read this article)

* * * * *

© The Risk Averse Alert — Advocating a patient, disciplined approach to stock market investing. Overriding objective is limiting financial risk. Minimizing investment capital loss is a priority.

Analysis centers on the stock market's path of least resistance. Long-term, this drives a simple strategy for safely investing a 401(k) for maximum profit. Intermediate-term, investing with stock index tracking-ETFs (both their long and short varieties) is advanced. Short-term, stock index options occasionally offer extraordinary profit opportunities when the stock market is moving along its projected path.

Nothing is set in stone. Nor is the stock market's path of least resistance always known. More often than not, there are no stock index option positions recommended.


There's an easy way to boost your investment discipline...

Get Real-Time Trade Notification!