Sunday, May 31, 2009

Bullish the U.S. Dollar is Bearish Global Equities and I AM


Do you know how easy it is to be bullish the U.S. dollar right now?

Sure, there is a growing threat of a global hyperinflationary blowout of the dollar-anchored financial system. If the past year is any indication, the process should involve the simultaneous ratcheting down of physical economic activity and explosion of financial intervention. Along the way every attempt to resuscitate pre-crisis conditions should invariably fail (much as has thus far been the case) and lead to the next level of breakdown.

Still, belief in the possibility of success over coming months and quite possibly extending through the next couple years likely is to prevail to an extent more enduring than hindsight might prove prudent.

Let's face it. The stars [of power] are not exactly configured in such a way as will allow the dollar to crumble without a fight. So, although the risk of a dollar collapse likely will build, the actual moment when all faith is lost must be delayed while every attempt is made to regain balance.

During this interim, then, wisdom advises one be a dollar bull. Here's why...
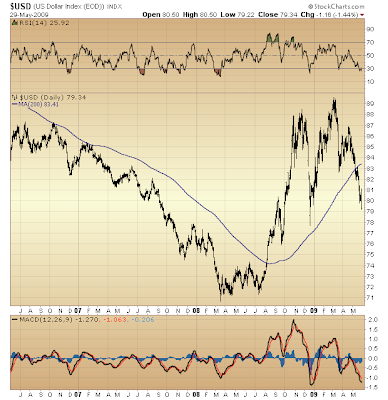

$USD

What is the U.S. Dollar Index's 200-day moving average doing?

Behold! It is rising.

Thus, the U.S. dollar's trend clearly is rising, and so it is easy being a dollar bull. RSI and MACD being a wee bit oversold here certainly helps add conviction (seeing how the U.S. Dollar Index currently is trading below its [rising] 200-day moving average).

It is instructive, too, I believe, to view the U.S. Dollar Index's reversal last year and the positive impact this had on its 200-day moving average. Stock market bulls take notice. Nothing of the sort has yet to occur in any major stock index. There, the story told by the 200-day moving average is quite uniformly bearish, indeed.

So, wrapping up this thought...

About current U.S. Dollar Index weakness: it is partly a reflection of belief in the possibility of crisis resolution success over coming months. With the [U.S. dollar-centric] financial core momentarily stabilized, hot money flows have made their way back into those lesser developed (formerly booming) regions (BRIC) shredded during last year's collapse.

Hot money also is chasing commodity production. Here, one's analysis need be a little shrewder. Some wealth surely fathoms how controlling basic "things" can act as a means of preserving capital (or power; or both), should the risk of a hyper-depreciating dollar become a reality in the not-too-distant future. Thus, some portion of movement out of the dollar might not be done in belief the status quo of recent years soon will be returning.

Now, about the U.S. dollar's bullish outlook...

How can one underestimate the potential for astronomically rising capital needs among businesses of all sorts (holding dollar-denominated liabilities) during times like these, when economic functioning remains flat on its back and stimulus in the trillions, meant to shock life back into the system, is thought too little by some?

If the trend is your friend, then the U.S. Dollar Index's 200-day moving average suggests the mad dash for dollar-denominated capital that hit the globe last year might have only just begun.

We know what impact this had on equities. Not coincidentally, stock index 200-day moving averages likewise suggest a capital-starved world could threaten another wave of selling.

You might say all things here lead to the simple conclusion that, cash is king. It's little wonder, then, very short-term U.S. Treasury securities are all the rage these days...

* * * * *

© The Risk Averse Alert — Advocating a patient, disciplined approach to stock market investing. Overriding objective is limiting financial risk. Minimizing investment capital loss is a priority.

Analysis centers on the stock market's path of least resistance. Long-term, this drives a simple strategy for safely investing a 401(k) for maximum profit. Intermediate-term, investing with stock index tracking-ETFs (both their long and short varieties) is advanced. Short-term, stock index options occasionally offer extraordinary profit opportunities when the stock market is moving along its projected path.

Nothing is set in stone. Nor is the stock market's path of least resistance always known. More often than not, there are no stock index option positions recommended.


There's an easy way to boost your investment discipline...

Get Real-Time Trade Notification!

Saturday, May 30, 2009

As Goes GM, So Go Many a Financial Asset


What in the world happened Friday, 3:00 - 4:00 p.m.?


OEX 5-min

All "like from like" similarities were progressing so perfectly. RSI was contracting to buy- and sell-side balance as the S&P 100 continued correcting its 5.20 - 5.21 decline ... then bang, she went straight up into the close. In the last hour both the OEX and its RSI defied my expectation.

So, what to make of this?

Well, there might be follow-through at the open Monday. However this likely will not change my near-term, negative outlook one bit.

The Elliott read continues to see the market's counter-trend rally off March '09 bottom ending early in May. As first suspected about a week ago, it looks like some 3-wave, Elliott Wave formation has been unfolding since. This week's trading simply advances this probability.

Any advance out of the gate Monday, following Friday's late-day surge, should only bring the market nearer the end of the middle wave — wave b — of the 3-wave, Elliott Wave down, forming since early May.

As long as the underlying technical state remains supportive of this view, then one of these days the third wave of this formation — wave c — should bring the sharp move lower I am anticipating.

If nothing else, this past, holiday-shortened week demonstrated volatility is alive and well...

Tuesday (5.26.09) began with quite the determined reversal. Then to close out May taking both NYA and COMP to the slightest of new highs ... doing so largely during the final 15 minutes of trading ... seems so purposely contrived, given still diminishing volume of trade at present lofty levels.

One thing I suspect the mainstream has spent too little time contemplating...

The spillover financial affect on all things connected to GM's pending bankruptcy. If in hindsight some quarters believe it was a mistake to let Lehman Brothers go, I am wondering if in hindsight GM might prove the same. Hard to imagine this sort of thing (given GM's size) being associated with anything other than the next leg down in the stock market.

* * * * *

© The Risk Averse Alert — Advocating a patient, disciplined approach to stock market investing. Overriding objective is limiting financial risk. Minimizing investment capital loss is a priority.

Analysis centers on the stock market's path of least resistance. Long-term, this drives a simple strategy for safely investing a 401(k) for maximum profit. Intermediate-term, investing with stock index tracking-ETFs (both their long and short varieties) is advanced. Short-term, stock index options occasionally offer extraordinary profit opportunities when the stock market is moving along its projected path.

Nothing is set in stone. Nor is the stock market's path of least resistance always known. More often than not, there are no stock index option positions recommended.


There's an easy way to boost your investment discipline...

Get Real-Time Trade Notification!

Friday, May 29, 2009

The Icing on an Over-Baked Cake


Decidedly bearish, near-term and intermediate- ... with abundant technical evidence revealing growing underlying weakness ... today's futures-driven charge into close is seen as but icing on an over-baked cake: the sorry excuse for bullish trading that was the entire month of May 2009.


$NYA

Starting with a low-volume surge covering about two-thirds of the entire month's gain (5.4.09) ... soon to follow was an active bailout at top (5.6.09 - 5.8.09) ... with the rest of the month spent twisting in the wind ... ending positive on notably low volume ... and relative strength and momentum weakening.

So, with major indexes ending on or near their best readings for the month (rather than going out negative, as I suggested possible the other day) recent insights anticipating buoyancy over the next couple months seem all the more well-placed.

However top set on May 8th still is thought significant. Trading since is seen beginning a retracement of gains made since March '09 bottom.

The better part of the NYSE Composite's anticipated turn lower, giving back, say, 38.2% of March - May gains, likely lies straight ahead...


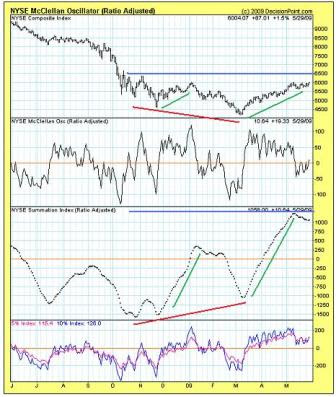
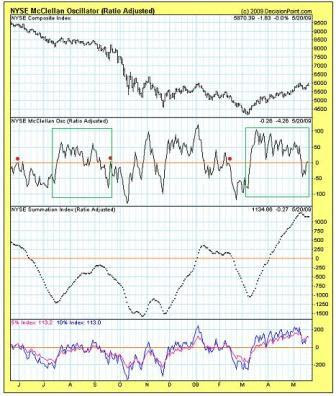
NYSE McClellan

The market's current underlying technical condition seen from the perspective of the NYSE McClellan Oscillator (and Summation Index) bears striking similarity to this same time last year...


NYSE McClellan

The NYSE Summation Index, right now, is higher than where it stood at the market's peak in October 2007. I point this out because at the May 2008 peak the NYSE Summation Index likewise exceeded its October 2007 high. Knowing what followed, might this technical condition be seen as the face of optimism misplaced? Because, here it is in our midst again ... and this time consensus appears even more "positive" (certain, convinced, etc.) that, bottom is in.

Consider, too, what positive, sustained momentum has been registered (via McClellan Oscillator readings above 0) since November 2008 bottom, such as has lifted the Summation Index to this positive level well-beyond its October 2007 peak. Then, look how little the NYSE Composite has in fact recovered.

By this measure the stock market is in serious trouble.

Now regarding presently deteriorating momentum revealed by the Oscillator... Minor differences notwithstanding in the lead-up to this moment (now versus this same time last year) ... a period of serious selling pressure nevertheless (and still) appears imminent.

Yet by these minor differences, now versus last year, one also might suppose pending weakness will not presently lead the NYSE Composite to a new low (like happened last July). This view dovetails an outlook projecting a couple months of relatively buoyant trading ... the sort of thing leading to a growing conviction bottom is in (that gains from March '09 bottom simply are being "corrected").

Nevertheless, some indication of pending further weakness (intermediate-term) likewise should develop during this period of buoyancy in which the market is projected to sink (imminently) then get back up (going into August '09).


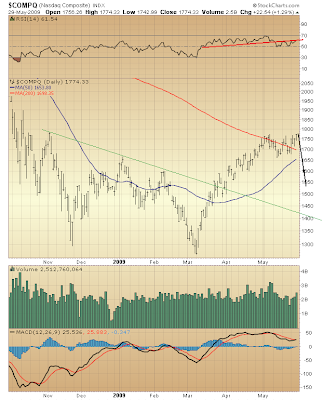
$COMPQ

NASDAQ led the way higher off March '09 bottom, and has led the way, too, in the process of turning over. You see this most graphically via the RSI panel. Much like January's decline led to a reversal of COMP's RSI trend (from up to down), so too has been the result of NASDAQ's decline earlier this month.

Seeing how the earlier instance "set up" NASDAQ's February - March '09 decline, it's clear NASDAQ could soon find itself under concerted selling pressure.

My wonder here is what to expect, COMP v. NYA, in relation to an intermediate-term outlook forecasting capitulation...

Despite anticipating buoyancy over the next couple months, how might subsequent capitulation be telegraphed, becoming a greater likelihood, by selling straight ahead?

Might COMP correct 61.8% of its gains from March '09 bottom (whereas NYA corrects only 38.2%)? Remember, I was the one who, a month and a half ago, was pointing out how near COMP was its 200-day moving average, whereas NYA still was far below its 200-day. Yet this disparity was "repaired" (and in the process resulted in NYA leading COMP in its gain off March '09 bottom!).

So, some kind of notable performance disparity certainly is not outside the realm of possibility looking down, right now, from here. Indeed, with an eye toward the market's ultimate capitulation sometime over the next year or so, better expect added evidence over the next couple months that, despite prospective, relative buoyancy, underlying weakness continues to build.


(Coming this weekend: "Bullish the U.S. Dollar is Bearish Global Equities and I AM")


Fast Money
* * * * *

© The Risk Averse Alert — Advocating a patient, disciplined approach to stock market investing. Overriding objective is limiting financial risk. Minimizing investment capital loss is a priority.

Analysis centers on the stock market's path of least resistance. Long-term, this drives a simple strategy for safely investing a 401(k) for maximum profit. Intermediate-term, investing with stock index tracking-ETFs (both their long and short varieties) is advanced. Short-term, stock index options occasionally offer extraordinary profit opportunities when the stock market is moving along its projected path.

Nothing is set in stone. Nor is the stock market's path of least resistance always known. More often than not, there are no stock index option positions recommended.


There's an easy way to boost your investment discipline...

Get Real-Time Trade Notification!
Thursday, May 28, 2009

Knocking Down a Bear With Legs


This 24-second video pretty well sums up the situation with my bearish position...


So, I believe my shot is hitting the right mark ... but the damn thing has legs holding everything up. Yet by an increasing look of fatigue and by gravity ... I still believe the market will give and hit the floor.


OEX 5-min

A counter-trend rally following last week's initial, 5-wave decline (5.20 - 5.21) continued today. Similarity to last Wednesday's (5.20) counter-trend rally persists.

Any moment now the market's legs look to give out. A growing number of technical indications continue suggesting gravity likely will have its way. By the simple manner decidedly weakening technical conditions are persisting a large thud just as well could come sooner rather than later.


Fast Money
* * * * *

© The Risk Averse Alert — Advocating a patient, disciplined approach to stock market investing. Overriding objective is limiting financial risk. Minimizing investment capital loss is a priority.

Analysis centers on the stock market's path of least resistance. Long-term, this drives a simple strategy for safely investing a 401(k) for maximum profit. Intermediate-term, investing with stock index tracking-ETFs (both their long and short varieties) is advanced. Short-term, stock index options occasionally offer extraordinary profit opportunities when the stock market is moving along its projected path.

Nothing is set in stone. Nor is the stock market's path of least resistance always known. More often than not, there are no stock index option positions recommended.


There's an easy way to boost your investment discipline...

Get Real-Time Trade Notification!

Wednesday, May 27, 2009

Buy in June, After the Swoon?


Continuing the theme of this week's well-scripted action (it's a treat when this happens)...


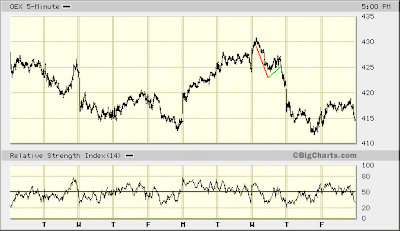
OEX 5-min

If similarity of the whole to the first part continues (i.e. "like from like"), it's possible correction of the S&P 100's initial decline (5.20 - 5.21) completed today ... and the greater bulk of selling I have been anticipating is imminent.

In fact, this view suggests the S&P 100, right now, trades well north of the mid-point of what is projected to be its larger, 5-wave decline from May 20th. If these larger five waves unfold similarly to the initial five waves down (5.20 - 5.21), then the next couple days could get quite interesting.

The red center line drawn through the S&P 100's first wave down (5.20 - 5.21) simply is curious. It's the Helix gone OEX. Its formation was determined by the initial move lower and subsequent reaction on 5.20. The entire 5.20 - 5.21 decline more or less rotated around it.

So, I propose a new center line might find the OEX rotating around it all the way down to a prospective target in the 360 - 370 range. This new center line's formation was determined much like the first: from the initial decline (5.20 - 5.21) and subsequent reaction (through today). See the similarity? Curious.

As you can see, the prospective mid-point of this new center line is just south of OEX 400. Oddly enough, the S&P 100's 50-day moving average happens to be in the same neighborhood.


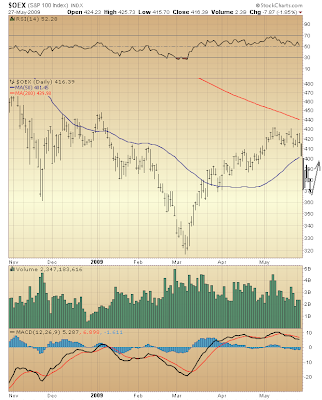
$OEX

So, hey, the next couple days just might validate "Sell in May and go away" ... then lead straight to "Buy in June, after the swoon."

Everything technically supports the possibility of a sudden snap here. One thing upon another has been falling into place (and remaining there). The shape of things supports a view that, the stock market could be one tremor away from an avalanche.

Mr. June OEX 400 Put sees its reasonable possibility ... recognizing, of course, nothing is set in stone ... and believing there is time to react should something different develop.

In the quest for scripted action, however, what else is there to say? So far, so good...


Fast Money
* * * * *

© The Risk Averse Alert — Advocating a patient, disciplined approach to stock market investing. Overriding objective is limiting financial risk. Minimizing investment capital loss is a priority.

Analysis centers on the stock market's path of least resistance. Long-term, this drives a simple strategy for safely investing a 401(k) for maximum profit. Intermediate-term, investing with stock index tracking-ETFs (both their long and short varieties) is advanced. Short-term, stock index options occasionally offer extraordinary profit opportunities when the stock market is moving along its projected path.

Nothing is set in stone. Nor is the stock market's path of least resistance always known. More often than not, there are no stock index option positions recommended.


There's an easy way to boost your investment discipline...

Get Real-Time Trade Notification!

Tuesday, May 26, 2009

On the Highest Confidence Reading Since Lehman


Can you believe CNBC's Closing Bell failed to broadcast the following credit...
"Today's trade scripted by TC at the Risk Averse Alert."


OEX 5-min

Did you hear today's Consumer Confidence upside surprise brought the best read since Lehman Brothers went bankrupt last September? What contrarian is not doing his best Ace Ventura "Rahehealy?" Given today's low volume accompaniment, might mending confidence absent a willing bid set up for a real-life demonstration of how money talks and b.s. walks in times of tanking 200-day moving averages?

Of course, a brief trip around the technical horn yields nothing but signs reading, "Beware!" So, there is no trouble here being a bear.

Real quickly, then, have a look at how NASDAQ might be taking up its typical leadership role, and providing advanced indication a decided turn lower is imminent...


$NYA
$COMPQ

Having recently noted how buy-side relative strength has been harmoniously persisting across the broad market, providing "support" (and possibly lessening the depth of any pending decline) ... we see in the above view a noteworthy RSI contrast, NYSE versus NASDAQ.

There has been a breakdown in NASDAQ's relative strength trend. Thus, the broad market's prospective turn lower is not only being telegraphed, but the very message of trouble ahead appears to have been largely delivered.

Need more proof? Check out NYSE and NASDAQ McClellan Oscillators.

A 15-20% haircut might be served promptly.


Fast Money
* * * * *

© The Risk Averse Alert — Advocating a patient, disciplined approach to stock market investing. Overriding objective is limiting financial risk. Minimizing investment capital loss is a priority.

Analysis centers on the stock market's path of least resistance. Long-term, this drives a simple strategy for safely investing a 401(k) for maximum profit. Intermediate-term, investing with stock index tracking-ETFs (both their long and short varieties) is advanced. Short-term, stock index options occasionally offer extraordinary profit opportunities when the stock market is moving along its projected path.

Nothing is set in stone. Nor is the stock market's path of least resistance always known. More often than not, there are no stock index option positions recommended.


There's an easy way to boost your investment discipline...

Get Real-Time Trade Notification!

Monday, May 25, 2009

Plotting an OEX Put Position


Here's why, late in the trading day Friday (5.22.09), the eye I had toward opening an OEX Put position was turned ahead to Tuesday (5.26.09)...


OEX 5-min

Take a close look at Wednesday's (5.20.09) initial move lower: its short 5th wave ... and then the counter-trend reaction that followed: the relative extent of its recovery.


OEX 5-min

The entire trip down, Wednesday - Thursday, appears notably similar to the initial move lower on Wednesday ... including the relatively short 5th wave ending it.

So, why not look for a similar counter-trend reaction?


OEX 5-min

From Thursday's low observe: a 5-3-5, a-b-c (zig-zag) up ... and a 3-3-5, a-b-c (flat) down.

Are these waves a and b of an a-b-c counter-trend rally "correcting" the S&P 100's decline since Wednesday? Then, wave c [up] (five waves) looks to unfold before another strong bout of selling develops.

Considering prospective similarity to Wednesday's counter-trend rally, OEX 421-424 presents a target area for establishing Put positions.


$OEX

As you know there's good reason to assume selling is due here. The main question is how much...

The S&P 100 Elliott Wave count you see above is quite compelling, particularly by way the "Rule of Alternation" is demonstrated (a 5-3-5, zig-zag, down ... followed by a 3-3-5, [irregular] flat, up).

In the realm of reasonable possibility the way is open for a strong move lower at this point. It could come in five waves or three. By way of the Dow Industrials the latter appears more likely.

Just how steeply the market might imminently fall remains a mystery. Watch MACD as it approaches its zero line (should it in fact continue trending down). Were a dragged out topping process to develop over the next couple months, we should expect some momentum measures (like MACD) to remain positive.

* * * * *

© The Risk Averse Alert — Advocating a patient, disciplined approach to stock market investing. Overriding objective is limiting financial risk. Minimizing investment capital loss is a priority.

Analysis centers on the stock market's path of least resistance. Long-term, this drives a simple strategy for safely investing a 401(k) for maximum profit. Intermediate-term, investing with stock index tracking-ETFs (both their long and short varieties) is advanced. Short-term, stock index options occasionally offer extraordinary profit opportunities when the stock market is moving along its projected path.

Nothing is set in stone. Nor is the stock market's path of least resistance always known. More often than not, there are no stock index option positions recommended.


There's an easy way to boost your investment discipline...

Get Real-Time Trade Notification!
Sunday, May 24, 2009

A Little Calm Me Down, Courtesy a Very Bearish Trend


Sometimes you just have to consider the simplest things to get your bearings on forecasting probabilities...


$SPX

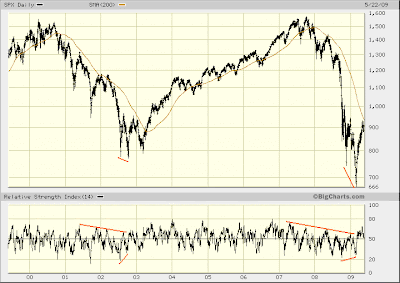
I mean, come on. Just look at the S&P 500 200-day moving average. What does it project?

At best the S&P 500 might be bottoming. Indeed, the index might have bottomed already. Yet even in this case some period of pressure retesting the March '09 low probably is better expected here. Contrast the present moment with late-2002. You see what I mean.

Equally probable — if not more so — is the trend beginning October 2007 will continue. How does one not consider the rate of descent thus far and conclude it'll be a miracle if a bottom here can be pulled off.

Which leads to the least probable likelihood of all...

Just look how far from left field the S&P 500 already has come just to approach the underside of its 200-day moving average! Odds the index continues its ascent, cutting through the 200-day moving average and turning it up, are slim.

However...

Some kind of merciless grind over the next couple months — essentially going nowhere — remains possible.

This concern relayed Thursday is bolstered by the observation that, daily RSI for all major indexes remains on the buy-side (i.e. above 50). Contrarily, back in May '08 relative strength was deteriorating in large-cap indexes, while only the more speculative (like NASDAQ) held to the buy-side.

So, the present, harmonious display of buy-side relative strength could be indicating any pending decline still might find support around respective 50-day moving averages (or nominally lower).

Nevertheless, some simple big picture perspective is useful here. Larger probabilities are clear. The fast-sinking S&P 500 200-day moving average plainly reveals a very bearish trend...

* * * * *

© The Risk Averse Alert — Advocating a patient, disciplined approach to stock market investing. Overriding objective is limiting financial risk. Minimizing investment capital loss is a priority.

Analysis centers on the stock market's path of least resistance. Long-term, this drives a simple strategy for safely investing a 401(k) for maximum profit. Intermediate-term, investing with stock index tracking-ETFs (both their long and short varieties) is advanced. Short-term, stock index options occasionally offer extraordinary profit opportunities when the stock market is moving along its projected path.

Nothing is set in stone. Nor is the stock market's path of least resistance always known. More often than not, there are no stock index option positions recommended.


There's an easy way to boost your investment discipline...

Get Real-Time Trade Notification!

Friday, May 22, 2009

Building Up for a Sudden Scare?


Came close to opening an OEX Put position today. Decided to wait until Tuesday, thinking one more bounce might be in store before the market finally falls through the floor. We'll see. I'll have more to say on Monday (my holiday treat)...

Yesterday's perspective was of levitation possibly developing over the next couple months.

Today, let's consider the levitation we're presently in the midst of. Just because this condition's persistence suggests a relatively buoyant market might result (as put forward yesterday) does not at all mean considerable risks are off the table.


$COMPQ

Exactly one week ago I wrote NASDAQ RSI and MACD were suggesting a bounce might be in store.

Bingo. Now, look at the present similarity to early-June '08. How's that for UltraShort ETF comfort?

Here again I put forward the crazy, Helix-like, center line around which the imploding NASDAQ Composite appears to be rotating.

Judging by the condition of things right now (relative to this time last year) a moment of truth could be at hand. If months ahead offer capitulation, then a decided turn lower — holding the 50-day moving average below the 200-day, just like last year — appears imminent.

Obviously, then, last night's targeting of support at the 50-day moving average vastly underestimates selling potential here. That curious center line proves all the more interesting, itself, when you consider a .618 retracement of gains made since March bottom targets COMP 1460.


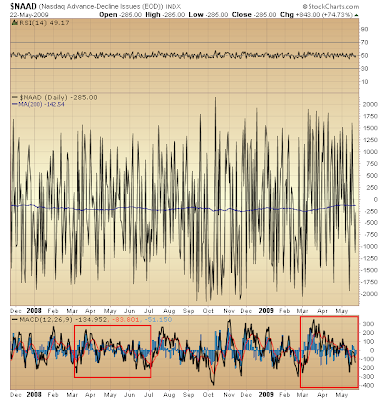
$NAAD

From March to mid-May '08 a counter-trend rally persisted amid weakening underlying conditions as highlighted above. Ditto March to May '09.

Following May '08 peak a period characterized by increasing underlying weakness developed.

Ditto the present moment?


NASDAQ McClellan

I wanted to get a better sense about how during counter-trend rallies over the past year instances of growing McClellan Oscillator weakness map to periods preceding the bulk of NASDAQ Composite selling.

I'm not really sure how helpful this is. Given the Oscillator's relatively significant deterioration in the present instance ... yet with scarcely a scratch on NASDAQ ... either COMP will not fall to its "center line" (1460), or it might descend there in rapid order.

Judging by the McClellan 5% and 10% indexes NASDAQ's rally off March '09 bottom rightly might be seen (by its limited reach above the 0 line) as a counter-trend rally ... albeit the strongest since October 2007 top ... rather than a reversal of trend.

You might also say the McClellan 5% and 10% indexes are at an inflection point. So, you see why yesterday I suggested another couple months of relative buoyancy might be in store.

Tonight, however, the thought is what if at this inflection point the market falls hard in response to weakening technical conditions?


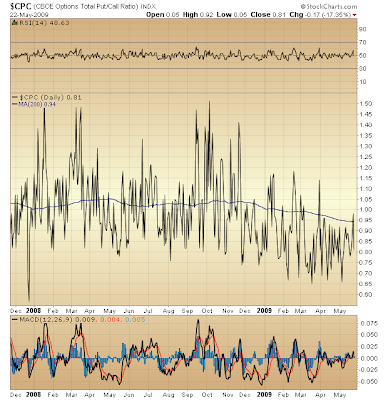
$CPC

Not one day in nearly two months have more Puts than Calls traded on the CBOE. See, too, how this condition compares to the May-July '08 period, particularly in light of the Put/Call Ratio's relationship with its 200-day moving average. Per any pending decline's possibility, one might say it is in fact time for a pickup in Put activity.

Then again, which trend is your friend here? And so, what about this pronounced slant in Call activity we see of late (after so much selling over the past 18 months)? Is it largely speculative or is it short position hedging?

Either way the implications are negative (and support the case for capitulation).

So, maybe we're due for a scare...


Fast Money
* * * * *

© The Risk Averse Alert — Advocating a patient, disciplined approach to stock market investing. Overriding objective is limiting financial risk. Minimizing investment capital loss is a priority.

Analysis centers on the stock market's path of least resistance. Long-term, this drives a simple strategy for safely investing a 401(k) for maximum profit. Intermediate-term, investing with stock index tracking-ETFs (both their long and short varieties) is advanced. Short-term, stock index options occasionally offer extraordinary profit opportunities when the stock market is moving along its projected path.

Nothing is set in stone. Nor is the stock market's path of least resistance always known. More often than not, there are no stock index option positions recommended.


There's an easy way to boost your investment discipline...

Get Real-Time Trade Notification!

Thursday, May 21, 2009

Might a Fine Crop of Complacency Be Grown This Summer?


How about that... The market is trading as though many underlying technical measures were at something of an inflection point. Go figure!

Still, the simple fact indexes continue to hold up suggests the way might be paved for grinding out [nominal] further gains off March '09 bottom over the next couple months or so.

In other words, heads up...


$INDU

I failed to notice yesterday the Dow Jones Industrials Average traded to a new high, post-March '09 bottom.

What's the big deal, you wonder?

Well, with all the money tied up in these thirty stocks something about the psychology driving the stock market might be usefully discerned. With a significant interest willing to pony up cash buying the widely-held, relatively-lagging, mainstay issues among the Dow 30, an element critical to a buoyant stock market becomes evident: confidence.

Apparently, in some corners broad market gains made since bottom ... glistening like a diamond ... are seen out of the windshield rather than the rear view mirror. Thus, too, new positions are more likely to be defended.

Nevertheless, given what has passed it probably is reasonable to assume any prospective market-moving interest is bound to be fragile. In other words, it must be handled with care by those cooler minds who no doubt recognize the waning attractiveness of equities in this still very disturbing macro environment.

How better to cultivate such trust as brings wallets to open than facilitate some sort of suspended animation ... something looking like a consolidation of gains made since March '09 bottom?

The Dow Jones Industrials slight reach into new high ground yesterday raises this possibility.

RSI ... remaining on the buy-side (above 50) ... bolsters the likelihood another turn higher could unfold ... taking the Dow 30 upward to its [still declining] 200-day moving average.

MACD ... likewise on the buy-side of its range (above 0) ... and appearing late-April-ish ... similarly concurs this possibility is real.


$SPX

Seen in the context of the past year RSI and MACD certainly offer a very clear picture of improved underlying strength. Recently stretched to a relative extreme (indeed, registering their best readings since the market's October 2007 top), both measures appear to be regaining "balance" amidst a relatively narrow, sideways trade in the S&P 500.

Thus, might the market soon again find legs. This, clearly, has been the friendly trend since March '09 bottom. Duly noted ... and brought to light all because the Dow Jones Industrials traded at a new high yesterday.

I should say, though, something of a red flag was raised this week by the extent to which all indexes challenged their May 8th peaks. This while by some measures the market appears at a moment of truth. Could the seeming conflict be indicating support lies not much lower? Respective 50-day moving averages might mark the floor.


SPX 5-min

Might some 3-wave corrective form (i.e. a-b-c) beginning at the S&P 500's peak on Friday, May 8th be seen unfolding?

Could its "c" wave [down] be forming from yesterday's peak? Then, the 4th of its 5 waves appears to be unfolding (you see confirmation of this via RSI improvement relative to the 2nd wave yesterday afternoon). One more turn down, and an Elliott corrective wave from May 8th could be completed.

Indeed, the S&P 500 could trade 40 points lower and bottom sometime as soon as Friday afternoon. 850 is the vicinity of the S&P 500's 50-day moving average.


$VIX

They say a picture is worth a thousand words...

Two lines drawn above in the RSI panel speak volumes about the market appearing at an inflection point. VIX RSI's sudden surge to 50 (coinciding with a follow-through to today's bump in volatility) seems a most reasonable possibility here.

The stock market's better than expected turn higher this week is a telling clue presented in the midst of challenging technical conditions. There's something to be said about how relatively well prices have held up despite growing technical pressure.

Further selling might be relatively muted, then.

Let's keep an eye open to the possibility that, over the next few months the market might remain relatively buoyant. Bear in mind, this does not change the outlook for a bear market-ending capitulation whose commencement would only be delayed, and begin at levels not much higher...


Fast Money
* * * * *

© The Risk Averse Alert — Advocating a patient, disciplined approach to stock market investing. Overriding objective is limiting financial risk. Minimizing investment capital loss is a priority.

Analysis centers on the stock market's path of least resistance. Long-term, this drives a simple strategy for safely investing a 401(k) for maximum profit. Intermediate-term, investing with stock index tracking-ETFs (both their long and short varieties) is advanced. Short-term, stock index options occasionally offer extraordinary profit opportunities when the stock market is moving along its projected path.

Nothing is set in stone. Nor is the stock market's path of least resistance always known. More often than not, there are no stock index option positions recommended.


There's an easy way to boost your investment discipline...

Get Real-Time Trade Notification!

Wednesday, May 20, 2009

Stock Market Momentum Fading


My "top is in," Elliott Wave view maintains its credibility by the slightest margin!

Contrarily, wider latitude should be afforded a bearish outlook whose conclusion about May 8th top is, "Whatever." Truth is even if this peak is exceeded, the market probably will remain positioned for a decided turn lower soon enough...


NYSE McClellan

Seeing instances over the past year when the McClellan Oscillator similarly was weakening, you get a sense of odds right now the market might come under some pressure.

Of course, there's nothing set in stone dictating things will play out largely like the past. Indeed, you might view the NYSE McClellan Oscillator's similar behavior to September '08 and fear another round of steep selling presently might be in store.

However, what of the NYSE Composite's much improved tenor now versus July - September '08? Better not ignore this. In fact, this week's trading seems to be driving home the point.


NYSE 5-min

So, about that "c" wave beginning late, last Friday ... the one "showing no clear sign of quitting until ... [yesterday's] last hour" ... it went into overtime this morning and then faded like Dylan Ratigan.

Let's forget about the fact today's launch out of the gate might change the Elliott Wave count from May 8th top...

(You see why I try to keep this sort of thing to a minimum. It seems more productive speaking broadly within the realm of finite Elliott Wave possibilities rather than unduly promoting one alternative over others.)

This week's comeback simply fits the entire move up from March '09 bottom.


$NYA

How might we best characterize the drive higher off bottom? No doubt, both RSI and MACD reveal the NYSE Composite's trend bias continues to the upside. Both measures of underlying strength remain on the buy-side of their respective ranges. Likewise, both have confirmed NYA's advance every step of the way.

Still, both measures are turning over. Yet why is this more significant now than was the case in April when both were likewise doing the same?

Go back and let the McClellan Oscillator tell you. Momentum is fading...


Fast Money
* * * * *

© The Risk Averse Alert — Advocating a patient, disciplined approach to stock market investing. Overriding objective is limiting financial risk. Minimizing investment capital loss is a priority.

Analysis centers on the stock market's path of least resistance. Long-term, this drives a simple strategy for safely investing a 401(k) for maximum profit. Intermediate-term, investing with stock index tracking-ETFs (both their long and short varieties) is advanced. Short-term, stock index options occasionally offer extraordinary profit opportunities when the stock market is moving along its projected path.

Nothing is set in stone. Nor is the stock market's path of least resistance always known. More often than not, there are no stock index option positions recommended.


There's an easy way to boost your investment discipline...

Get Real-Time Trade Notification!
Tuesday, May 19, 2009

An Elliott Corrective Wave With Top in Rear View Mirror


We could take the technical tour just about anywhere and still make a solid case for trouble ahead. No need to go there, then. My position stands on such merits as have been piling up here for days.

So far this week we have seen things fitting the moment ... as well as the Elliott Wave Principle.

Yesterday, a suspicious improvement in underlying conditions (as registered by the NYSE Advance-Decline differential) was noted for being fitting a moment naturally finding some players fearing they are missing the boat, as well as demonstrating standard Elliott Wave character.

Today, more substantiation of an Elliott Wave view assuming top is in ... currently finding a completed, initial move down being corrected.


NYSE 5-min

The NYSE Composite's advance from Friday afternoon is seen as a "c" wave of an a-b-c correction that began early the day before (Thursday, 5.14.09). "C" waves in the Elliott Wave Principle are third waves and, as you have read here before, typically coincide with notably dynamic underlying conditions.

Just look at that RSI ... parked on the buy-side (above 50) for hours ... showing no clear sign of quitting until ... today's last hour.

That's "c" wave character. And, chances are, this "c" wave is over. But not so fast my friend if you're thinking now is time for a quick turn south...


NASDAQ 5-min

Yesterday's suggestion that, trading this week might be range bound gains traction in view of NASDAQ Composite's unfolding since its top. The Elliott Wave Principle indicates 2nd waves sometimes retrace nearly all of the preceding 1st wave. This one might come close.

Not only that, but the market still might trade sideways for a time before falling with some vigor. Like I said yesterday, indexes could decline back to last Friday's lows, then bounce once more before finally coming unglued.

Whatever. As long as top continues to hold, everything is cool.


Fast Money
* * * * *

© The Risk Averse Alert — Advocating a patient, disciplined approach to stock market investing. Overriding objective is limiting financial risk. Minimizing investment capital loss is a priority.

Analysis centers on the stock market's path of least resistance. Long-term, this drives a simple strategy for safely investing a 401(k) for maximum profit. Intermediate-term, investing with stock index tracking-ETFs (both their long and short varieties) is advanced. Short-term, stock index options occasionally offer extraordinary profit opportunities when the stock market is moving along its projected path.

Nothing is set in stone. Nor is the stock market's path of least resistance always known. More often than not, there are no stock index option positions recommended.


There's an easy way to boost your investment discipline...

Get Real-Time Trade Notification!