Thursday, May 31, 2012

Shades of Y2k


A 10-year U.S. Treasury Note yielding a paltry 1.59% has a name: it's panic. Little wonder given rapidly diminishing prospects for the euro-zombie's survival. Likewise, too, then, do a myriad of financial claims on enterprises lacking the power of taxation also have a name: it's garbage. Of course, such nomenclature will not fly in the land of make believe.

The massive pile of debt heading for the dump in all probability will start reeking the moment even the safest securities on the planet (U.S. Treasuries) are indiscriminately sold on account of ongoing financial crisis reaching a point where bailout support from lenders of last resort has become ineffective, much as is inevitable. Obviously, we are close to this point right now. "Forward looking" equities evidently have caught a whiff of the stench about to overwhelm the trans-Atlantic banking system. Yet that fantasy generally still dominates mainstream thinking is truth revealed with evidence in belief that, "this time is different." Witness NASDAQ's darlings...


Here we find shades of Y2k in an index (NASDAQ 100) yet to fall below its 2011 peak, while the "old economy" has yet to even exceed that former peak! (See "Ominous Divergence") In other words, there is a long, looooooong way lower yet to go. A 38.2%-ish fall from the year's highs finds present circumstance appropriately complacent, and that's not just me talking, but the sentiment spoken by the picture above.

If there's anything "different" this time, it is the degree to which a sense of sheer panic lurks just beneath the surface. Yet so long as U.S. Treasuries — the biggest mountain of mispriced risk yet made on Wall Street over the past thirty years — maintain their shine, fantasies old and new might continue, and this even were equities still doomed to fall of their own weight from this moment forward, much as is occurring right now. Were this disposition more or less maintained throughout the market's presently unfolding setback, and were this current leg lower far from over (which by all indications appears to be the case, no matter how "oversold" some technical measures appear in absolute terms), then prospects for a panic sinking major indexes back to levels last seen in the 1987-1994 will move squarely onto the radar. We can cross that bridge once we get to it. For now a March-May 2000-like giveback appears underway. With panic lurking, much as the 10-year U.S. Treasury Note indicates, the speed at which 40% is clipped from major U.S. stock indexes could be more pronounced this time around.


Fast Money
* * * * *

© The Risk Averse Alert — Advocating a patient, disciplined approach to stock market investing. Overriding objective is limiting financial risk. Minimizing investment capital loss is a priority.

Analysis centers on the stock market's path of least resistance. Long-term, this drives a simple strategy for safely investing a 401(k) for maximum profit. Intermediate-term, investing with stock index tracking-ETFs (both their long and short varieties) is advanced. Short-term, stock index options occasionally offer extraordinary profit opportunities when the stock market is moving along its projected path.

Nothing is set in stone. Nor is the stock market's path of least resistance always known. More often than not, there are no stock index option positions recommended.


There's an easy way to boost your investment discipline...

Get Real-Time Trade Notification!

Wednesday, May 30, 2012

Ominous Divergence


Apparently, the burden of maintaining the market's levitation has reached capacity limits in the land of make believe...


$NYAD cumulative

Above is the NYSE cumulative advance-decline line since 2011. Old news is the fact that, were the NYSE Composite Index tracking this measure's relentless increase since March '09 bottom — the cumulative advance-decline line over the interim having risen to far exceed its 2007 peak — the composite index might be well into record territory by now. The fact that it isn't reveals the direction money belonging to strong hands has taken. Strong hands are O-U-T, leaving weak hands to exercise increased selling restraint, that prices generally might continue to rise. This has been the way of it since the very first bailout fix brought the market to bottom in March '09, and has consistently remained so right up to the present moment.

However, new news is that, whatever was being bid up earlier this year to the effect of lifting the NYSE cumulative advance-decline line still higher from its March '09 depths — bringing the measure to far exceed its early-July 2011 peak — its consequence, broadly speaking, proved to be of diminishing effect. The NYSE Composite index failed to exceed its 2011 best...


$NYA

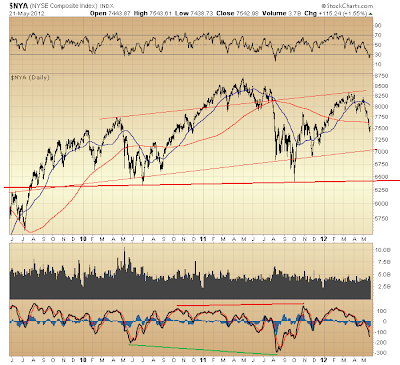
Weak hands either holding on for dear life or not letting go of "undervalued" prizes (both actions combining to restrain selling), no longer are providing enough tide to lift all boats. In fact, adding to the NYSE Composite Index's negative divergence with the NYSE cumulative advance-decline line are momentum matters pertaining to the index that, all the more distinguish the market's advance since early-October 2011 as technically suspect in contrast to the market's advance following the May 2010 "flash crash" and its aftermath. I covered this some weeks ago, well before index momentum (bottom panel) turned negative. A suspect technical condition is all the more confirmed, then, by the NYSE/cumulative advance-decline line divergence.

With momentum continuing to trend lower, today's hard turn away from the NYSE Composite's 200-day moving average is fitting reaction given the technical backdrop. Which point of reference, indeed, might prove interesting to anyone thinking there is similarity presently with the latter half of June 2011 (as both RSI and MACD are similarly poised), prior to the market's bounce into early July. Then, though, $NYA was above its [rising] 200-day moving average. So, improving RSI and MACD at the time might have been thought more likely indicating conditions suitable for keeping the market's trend intact and effecting a bounce.

Now, however, not only is $NYA below its 200-day moving average, but the moving average itself is trending lower. So, presently improving RSI and MACD might be more a matter of mere technical circumstance coincident with a pause that refreshes. Today's clubbing could mean the market is as refreshed is it will get for the time being.


Fast Money
* * * * *

© The Risk Averse Alert — Advocating a patient, disciplined approach to stock market investing. Overriding objective is limiting financial risk. Minimizing investment capital loss is a priority.

Analysis centers on the stock market's path of least resistance. Long-term, this drives a simple strategy for safely investing a 401(k) for maximum profit. Intermediate-term, investing with stock index tracking-ETFs (both their long and short varieties) is advanced. Short-term, stock index options occasionally offer extraordinary profit opportunities when the stock market is moving along its projected path.

Nothing is set in stone. Nor is the stock market's path of least resistance always known. More often than not, there are no stock index option positions recommended.


There's an easy way to boost your investment discipline...

Get Real-Time Trade Notification!

Tuesday, May 29, 2012

Financial Core Nearing Free Fall


Right on cue, the Chairman of the Shadow Fed, feet firmly planted in fantasy land where euro bonds is the name of the next shiny can aiming to keep the EMU alive, took to the airwaves tonight to commence application of needles to the Angela Merkel voodoo doll. No doubt, there isn't a board of directors of a too big to fail bank working that doll like it's a clogged air filter.

And why shouldn't they? Gasping for air is a condition adequately describing stock price action for investment banks these days. Take Goldman Sachs, for example...


company chart (GS)

What a nightmare. This stock is poised to be destroyed and it is not alone. What's more, all the "faith" put in the financial system's backstop has had a good couple years now showing itself rather thin. Just like 2008, then, the market's leadership is sure to melt down as the core (i.e. finance) further disintegrates. Indeed, this end appears imminent judging by the technical state of a blue chip financial like Goldman Sachs. How ironic that, Greece — Goldman's mark — could be the one to lunge a dagger straight into the trans-Atlantic banking system's heart.


Fast Money
* * * * *

© The Risk Averse Alert — Advocating a patient, disciplined approach to stock market investing. Overriding objective is limiting financial risk. Minimizing investment capital loss is a priority.

Analysis centers on the stock market's path of least resistance. Long-term, this drives a simple strategy for safely investing a 401(k) for maximum profit. Intermediate-term, investing with stock index tracking-ETFs (both their long and short varieties) is advanced. Short-term, stock index options occasionally offer extraordinary profit opportunities when the stock market is moving along its projected path.

Nothing is set in stone. Nor is the stock market's path of least resistance always known. More often than not, there are no stock index option positions recommended.


There's an easy way to boost your investment discipline...

Get Real-Time Trade Notification!

Friday, May 25, 2012

Beware the Approaching Terror


Anyone else thinking the EMU is about to implode? Were there any serious effort to save it, then would not the order of the day involve something more than trying to pigeonhole Germany into a hyperinflationary scheme (euro bonds) whose end ventures mere further postponement of the European banking system's inevitable collapse — a reality wherein depositor runs would be a prominent feature, the likes of which already are occurring today in troubled EMU periphery countries (only adding to a mass strike's social upheaval)?

Maybe, then, the real issue is the fact the EMU is unsalvageable. There simply can be no serious effort to save it, as capital backing the European banking system's piece of Adam Smith's Leveraged Ponzi Scheme is saddled with confidence issues born of an unrepaired, fraud-riddled credit system whose virtually unregulated recklessness over decades wrought this mess in the first place. Indeed, were there any serious intention to sustain the euro, then aggressive prosecution of mortgage-backed securities fraud, say, might have been a lot more politically fashionable these past few years. That such otherwise constructive action likely would prove a catch-22 to a highly leveraged banking system but reveals the system in fact is unsustainable. Indeed, judging by the rate at which the euro-zone periphery is collapsing, this conclusion is fast becoming common knowledge.

So, the real war playing out in Europe right now rather is better seen against fantasy debt claims (particularly the mountain amassed subsequent to Greenspan's 1996 "irrational exuberance" warning, the likes of which backs the euro to the effect of more or less insuring a dubious piece of scrip is doomed to become one giant swindle) and in the cross hairs are dreamers calling for yet more hyperinflation to make these [illegitimate] claims appear real. Contrarily, increasing calls for restoration of Glass-Steagall coming in the wake of FDIC-insured JPM's fall from the fee gravy train running through the OTC derivatives market in fact suggests awareness of our frightfully vulnerable reality [lawfully] is becoming acute.

All told, trillions pledged in bailout are proving for naught. Confidence remains shot. So, there should be no doubt "look out below" is not the scream of a deranged psychotic...


SPX weekly

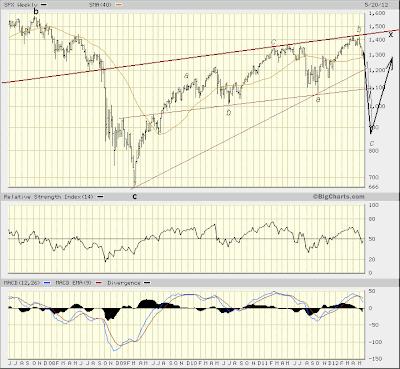
A calamitous, 5-wave decline forming the first wave (i.e. wave a) of an a-b-c "zig zag" down — technically rationalized by way of the Elliott Wave Principle in "Sell the Pops to 2021" — could develop along lines indicated above, and even blow out March '09 low before November's U.S. elections. Indeed, should the EMU collapse (as well as the securities-based Ponzi scheme on which it is built), long-lasting aftereffects could translate into a prolonged period during which March '09 levels could become wishfully prized by those holding out for the market to recover, this while it persistently sinks gradually lower over the years following its upcoming gassing (going into, say, 2021).

At this early hour, however, probably the best place to focus is on the first wave down, because even a 38.2% drop from May 1st peak could find the market still in a position to recover...


SPX weekly

The main takeaway above is that, the counter-trend rally off March '09 bottom (now thought to be forming wave x of an a-b-c-x-a-b-c complex Elliott corrective wave unfolding since Y2k) could still have legs if, somehow, the euro-zone is "saved." Let's just say I am not optimistic.

In light of this alternate possibility, though, the line of support joining June 2010 and October 2011 bottoms might prove analytically valuable. Rather, once this line becomes "resistance" will its value be proven. Should resistance hold, then elevated will be risk the market is in the midst of a 5-wave collapse, as depicted in the first $SPX weekly chart above.

Germany will be worth watching here, particularly for the sake of confirming its intention to wreck the EMU. Pressure on Germany to sign on to the euro bond hyperinflationary scheme no doubt will intensify as the European banking system craters over days and weeks ahead. Being that Germany, too, is entering a national election season, Team Fraud really has its work cut out for it convincing the German political establishment national suicide at the alter of the bankrupt casino that is the trans-Atlantic banking system it would commit backing euro bonds is in the German national interest. I cannot help but think an hour marking increase in brutality aiming to impose a policy direction virtually codifying sacrifice and want is arrived.


Fast Money
* * * * *

© The Risk Averse Alert — Advocating a patient, disciplined approach to stock market investing. Overriding objective is limiting financial risk. Minimizing investment capital loss is a priority.

Analysis centers on the stock market's path of least resistance. Long-term, this drives a simple strategy for safely investing a 401(k) for maximum profit. Intermediate-term, investing with stock index tracking-ETFs (both their long and short varieties) is advanced. Short-term, stock index options occasionally offer extraordinary profit opportunities when the stock market is moving along its projected path.

Nothing is set in stone. Nor is the stock market's path of least resistance always known. More often than not, there are no stock index option positions recommended.


There's an easy way to boost your investment discipline...

Get Real-Time Trade Notification!
Thursday, May 24, 2012

Defying a Strong Bounce


There is a consensus loudly anticipating a strong bounce here, yet extraordinarily weak technical underpinnings beg to differ...


NYSE McClellan

The NYSE McClellan Summation Index, now negative — an extraordinary state these past few years — likewise is badly diverging from its better position at the market's December 2011 bottom. Combined, these spell big trouble. And with the NYSE McClellan Oscillator — itself confirming the market's every new low since March 2012 — now approaching a state proven several times recently to coincide with the market's reversal and further retreat, this does not appear the right moment to grab at falling knives.

Index momentum remains decidedly negative. This measure is not yet showing any sign of a positive divergence, or a turn higher, like occurred during the latter half of June 2011. It's getting close, but the underlying technical condition revealed by the NYSE McClellan series suggests there will be no cigar. Further disappointment awaits. The week still very well could go out on a sour note. A still fading NYSE Bullish Percent Index (itself also having fallen below its 200-day moving average) likewise suggests momentum might not be imminently reversed higher. So, no shortage of technical evidence is presently defying those who, right now, are expecting a strong bounce.


Fast Money
* * * * *

© The Risk Averse Alert — Advocating a patient, disciplined approach to stock market investing. Overriding objective is limiting financial risk. Minimizing investment capital loss is a priority.

Analysis centers on the stock market's path of least resistance. Long-term, this drives a simple strategy for safely investing a 401(k) for maximum profit. Intermediate-term, investing with stock index tracking-ETFs (both their long and short varieties) is advanced. Short-term, stock index options occasionally offer extraordinary profit opportunities when the stock market is moving along its projected path.

Nothing is set in stone. Nor is the stock market's path of least resistance always known. More often than not, there are no stock index option positions recommended.


There's an easy way to boost your investment discipline...

Get Real-Time Trade Notification!
Wednesday, May 23, 2012

Sell the Pops to 2021


The only thing relevant about today's big turnaround is that indexes are net nowhere, day two, after spending a solid two weeks slowly, yet relentlessly sinking. Truth is brief pauses in a precipitous march lower could prove the most that can be mustered as the banking system's implosion gains momentum in Europe. Indeed, relatively substantial is the speed at which the market could collapse over weeks immediately ahead — a reasonable risk in fact, technically well-substantiated in evidence, long-established, revealing vanquished animal spirits in a market now dominated by weak hands. None of this seemingly is on anyone's radar, which, of course, is as it should be.

The market's threatened demise finds yet another Elliott wave possibility agreeing things could get nasty like it's nobody's business, yet with dire consequence few, if any, will be left to deny...


DJIA weekly

You more or less could apply the same wave count to the S&P 500 as is applied above to the Dow Jones Industrials Average. In both cases Y2k marks top to a 5-wave advance from 1932 — an advance whose correction is thought ongoing, and likely to sink major indexes minimally to levels last seen in the 1987-1994 period (with a retreat to 1970's levels not out of the question by any means).

On one hand the above wave count applied to $INDU simply adds to possibilities recently presented using $SPX. Yet this specific view exceptionally qualifies a forecast wherein the next ten years might prove extraordinarily difficult from start to finish, in fact beginning right now. If you have thought frustrating these months on end it has taken for technical weakness to develop in the lead-up to the market's long-anticipated reversal and next big leg down, just wait until the months and years yet to come spent grinding lower while increasing technical strength persistently develops until, finally, an historic bottom at last is reached.

Focusing on developments during formation of wave a from 2000-2003, one sees how the Dow's twists and turns from January 2000 to April 2001 bear a likeness to its fluctuations from Y2k to the present. This prospective view, then, puts the Dow in position right now to form an a-b-c wave down whose both initial and concluding declines each could sink the average to new lows, post-Y2k (along with other major indexes).

So, if this newly unfolding, 3-wave decline shares the prior period's relative dimension, then March '09 bottom not only could be in jeopardy very soon, but be exceeded only to form a lower bottom that, likely will prove just as transitory.

Now, the above wave count assumes wave (IV) beginning in January 2000 is forming a so-called "double three," thus making it a complex Elliott corrective wave. A 3-3-5 "irregular flat" formed the first "three" from January 2000 to March 2009 (labeled a, b and c). By way of the Elliott Wave Principle's alternation guideline, one now would assume the second "three" likely will take the form of a 5-3-5 "zig zag" [down]. As the connecting x wave off March '09 bottom appears to have completed on May 1, 2012, the second "three" evidently is underway.

The Elliott Wave Principle's alternation guideline quite thoroughly has been on display during formation of wave (IV) thus far, and adequately justifies both the above wave count, as well as likely prospect that, a 5-3-5 "zig zag" down is slated to unfold over coming months and years. Indeed, by way of the Elliott Wave Principle's alternation guideline we are well-advised to expect wave a of the now-developing "zig zag" lower to unfold rather rapidly, as this would alternate from the first wave a whose slow development occurred from 2000-2003. Likewise, looking down the road some years, wave c of the now-developing "zig zag" lower could prove a rather prolonged affair, alternating from the first wave c whose rapid unfolding occurred from October 2007 through March 2009.

Alternation, too, might be applied in a similar fashion forecasting the depth that, upcoming waves a and c lower might reach, both in absolute and relative terms. Thus, wave a upcoming might dwarf wave c to follow (this, again, alternating from what occurred during formation of the first "three" in the 2000-2009 interim). Wave a might produce a shockingly deep setback, whereas wave c could prove far more subdued.

So, considering what the above Elliott wave count prospectively places in store, the trap door now open could produce a rapid descent that, once halted, will find the March '09 "generational low" a fleeting memory, and be followed by what more or less could prove a bottoming process lasting years, with many ups and downs to show for it. In other words, the many months spent making every minute count have been for good reason. Once this becomes impossible, then the battle to the bottom is on and "buy the dips" is sure to become "sell the pops" with more regularity and for a longer duration than today's consensus dares imagine even now at this very late hour in the life of the crumbling euro-zombie.


Fast Money
* * * * *

© The Risk Averse Alert — Advocating a patient, disciplined approach to stock market investing. Overriding objective is limiting financial risk. Minimizing investment capital loss is a priority.

Analysis centers on the stock market's path of least resistance. Long-term, this drives a simple strategy for safely investing a 401(k) for maximum profit. Intermediate-term, investing with stock index tracking-ETFs (both their long and short varieties) is advanced. Short-term, stock index options occasionally offer extraordinary profit opportunities when the stock market is moving along its projected path.

Nothing is set in stone. Nor is the stock market's path of least resistance always known. More often than not, there are no stock index option positions recommended.


There's an easy way to boost your investment discipline...

Get Real-Time Trade Notification!

Tuesday, May 22, 2012

Awaiting Panic


The building crisis in the trans-Atlantic banking system affecting a widening swath of debt obligations (with Japan joining the downgrade brigade today), has yet to precipitate any measure of panicked stampede, either into the barbaric relic or out of equities. Recent history suggests, however, this turn of affairs likely will accompany any new debt crisis that, right now by "official" accounts is just waiting in the wings.


$GOLD weekly

We'll really be cooking with gas once $GOLD:$SPX (bottom panel) votes "no confidence" in a manner similar to the above circled periods occurring over the past two years. Contrasting the market's setback this month with more dire possibilities these prior periods raise, the buildup for a challenge of March '09 lows appears on course to prospectively coincide with a panic into gold the likes of which has yet to even begin to materialize.


$INDU weekly

Another curiosity is seen in the relative performance of the Dow Jones Industrials Average versus the S&P 500. Subsequent to March '09 bottom whenever the Dow was relatively outperforming the S&P 500, the market was at greater risk of coming under pressure. All the more curious in this regard is $INDU:$SPX upside crossover of its 20-day EMA (exponential moving average) and/or subsequent reaction back down to it. These events have coincidentally preceded difficult moments these past couple years. And here we are again.


SPX 5-min

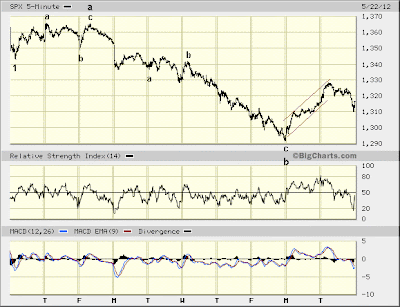
Now the question is whether five waves up from Friday's bottom form wave c of 2 (completing a 3-3-5 "running correction") and bring into the cross hairs wave 3 down from May 1st peak, or whether these five waves up from Friday complete but the first of five larger waves higher yet to form wave c, with the second of these five waves developing over much of today's trading.

Favoring the former possibility and running against the latter is momentum on daily index charts, whose position more or less remains in free fall and shows no sign yet of a turnaround. Add this to relevant $VIX and $BPNYA measures that remain as precariously poised today as has been the case over the past couple weeks. As such, expressed risk going into this week's trading has not been technically diminished in the least. As strongly as the market bounced yesterday and early today, even more strongly could it turn lower and end the week on a sour note.


Fast Money
* * * * *

© The Risk Averse Alert — Advocating a patient, disciplined approach to stock market investing. Overriding objective is limiting financial risk. Minimizing investment capital loss is a priority.

Analysis centers on the stock market's path of least resistance. Long-term, this drives a simple strategy for safely investing a 401(k) for maximum profit. Intermediate-term, investing with stock index tracking-ETFs (both their long and short varieties) is advanced. Short-term, stock index options occasionally offer extraordinary profit opportunities when the stock market is moving along its projected path.

Nothing is set in stone. Nor is the stock market's path of least resistance always known. More often than not, there are no stock index option positions recommended.


There's an easy way to boost your investment discipline...

Get Real-Time Trade Notification!

Monday, May 21, 2012

Relief, Deep Into Nasty


Up until today, it appeared a series of first and second waves down were forming from May 1st top and that a third wave sharply lower might unfold right away. Although this possibility still remains alive, some other wave count probably is developing, wherein prospectively the first wave down has completed already and the second wave presently is forming. Judging by today's NYSE Advance-Decline differential — the best of 2012(!) — it's likely a "c" wave of the second wave of five waves down began taking form today.

Still, a look at both the NYSE Bullish Percent Index and the S&P 500 Volatility Index reveals the market is deep into nasty's neighborhood, thereby confirming likelihood a third wave down could unfold over coming days. These measures jive with physical reality, too, wherein a European Monetary Union whose increasing risk of collapse finds even Cramer on guard. All ingredients combine to make for calamity whose dimension could prove far more eye popping than most observers suspect right now. Per widespread, negative sentiment as self-fulfilling prophesy rather than contrary indicator, there's the recent case of August-September 2008 tempering judgment. Sentiment was just awful then, too. The kicker now is there are more eyes on the exit, as far more debt is at risk of unraveling.


$NYA

One thing on my radar is the [rising] line of support/resistance common across major indexes, separating early-June 2009 peak from bottoms established in 2010 and then again in 2011. In the case of the NYSE Composite Index above a more foreboding momentum picture (see bottom panel) ought develop once this line of support is reached over coming weeks. A new low close (unlike what occurred 2011, versus 2010) confirmed by MACD would be fitting circumstance prior to a further fall whose end prospectively could find major indexes challenging respective March '09 bottoms, or even take these out.


Fast Money
* * * * *

© The Risk Averse Alert — Advocating a patient, disciplined approach to stock market investing. Overriding objective is limiting financial risk. Minimizing investment capital loss is a priority.

Analysis centers on the stock market's path of least resistance. Long-term, this drives a simple strategy for safely investing a 401(k) for maximum profit. Intermediate-term, investing with stock index tracking-ETFs (both their long and short varieties) is advanced. Short-term, stock index options occasionally offer extraordinary profit opportunities when the stock market is moving along its projected path.

Nothing is set in stone. Nor is the stock market's path of least resistance always known. More often than not, there are no stock index option positions recommended.


There's an easy way to boost your investment discipline...

Get Real-Time Trade Notification!

Friday, May 18, 2012

Do, Re, Mi, Fa, So, La, Ti, Do: Fat Lady Readies


An options expiration week opening with the market gapping lower and subsequently falling every day to end the week on a sour note rather reveals (particularly via increasing volume) a consensus whose retreat is not likely done, and this no matter how "oversold" some measures have become (RSI to name one). There is every reason to believe, even at this early hour, the worst is yet to come. No shortage of technical measures support this probability by their very weakness right now — a weakness that ended the week not only unrepaired, but in fact deepened.

Straight away, the S&P 500 has another good 100 points lower before any kind of bounce is likely to materialize. Next week could be nasty.


$SPX weekly

The first wave of last year's (2011) decline sank the S&P 500 to its rising trend line off March '09 bottom. With last year's decline and this year's move to a new high, post-March '09, a new rising trend line offers guidance to where the S&P 500's decline from its May 1st, 2012 high might likely end. Adding to this probability is a line of S&P 500 support/resistance at 1200-ish, this going all the way back to 1997.

Both weekly relative strength and momentum are well-poised for a further setback whose depth probably is a question of whether the trans-Atlantic banking system implodes with the euro-zone, or, somehow, the right balance of debt restructuring and hyperinflationary bailout forestalls the banking system's collapse. Although I might be convinced on account of history to side with the darker colored projection above, I am having a hard time imagining monetarist magicians pulling a rabbit out of their hat. There's a good chance the fat lady is about to sing and send March '09 lows into the dustbin of "generational low" history.


$SPX

Two alternate Elliott wave counts assigned to the market's counter-trend rally off March '09 bottom are shown above, and these correspond with projections drawn on the S&P 500's weekly chart. Presently, the configuration of support/resistance likewise finds 1200-ish a reasonable S&P 500 target.


Fast Money
* * * * *

© The Risk Averse Alert — Advocating a patient, disciplined approach to stock market investing. Overriding objective is limiting financial risk. Minimizing investment capital loss is a priority.

Analysis centers on the stock market's path of least resistance. Long-term, this drives a simple strategy for safely investing a 401(k) for maximum profit. Intermediate-term, investing with stock index tracking-ETFs (both their long and short varieties) is advanced. Short-term, stock index options occasionally offer extraordinary profit opportunities when the stock market is moving along its projected path.

Nothing is set in stone. Nor is the stock market's path of least resistance always known. More often than not, there are no stock index option positions recommended.


There's an easy way to boost your investment discipline...

Get Real-Time Trade Notification!

Thursday, May 17, 2012

Hedging in a Transitioning Market


The CBOE Put/Call Ratio is one measure already rivaling its August 2011 peak coinciding with the market's steep sell-off early that month. As such, prospect of a double-digit percentage setback over the next few days is on the radar. According to this measure, it's now or sometime later, after a temporary bottom forms and a bounce subsequently develops (which contrary end its present, elevated level might otherwise be signaling).


$CPC

A couple "big picture" observations worth mentioning. First was put forward here long ago and deserves consideration again at this moment prospectively finding the market at the edge of the abyss. A put/call ratio upward of 2-1 (or higher) in all probability will coincide with the ongoing corrective phase of the market's 1974-2008 advance. Countless times over the duration of that advance calls dominated puts traded on the CBOE by a 2-1 ratio. So, the flip side might become a dominant trait as correction of the market's multi-decade advance proceeds over months ahead.

Thus, too, the CBOE Put/Call Ratio's present state just as well could indicate the market is not yet adequately hedged, this to the effect of poising the market for a bounce. At this point in the market's ongoing correction of its multi-decade advance — prospectively at the start of a hard turn south reasserting an unfolding corrective wave's full force — status quo hedging might not be sufficient. So, heads up per this possibility in relation to today's elevated put/call ratio.

Supporting the view that, underway might be transition to a corrective wave's nasty phase is the CBOE Put/Call Ratio's upwardly trending bias of the past couple years, this particularly as the S&P 500 proceeded to move higher over the interim. We have seen this divergent bias prove a negative a number of times over short-term intervals (January 2010, April 2010, July 2011). Whether meaningful or not over the longer duration indicated above, the mere presence of this divergent put/call ratio bias seems fitting scenery in the lead up to the market's fall over the precipice...


Fast Money
* * * * *

© The Risk Averse Alert — Advocating a patient, disciplined approach to stock market investing. Overriding objective is limiting financial risk. Minimizing investment capital loss is a priority.

Analysis centers on the stock market's path of least resistance. Long-term, this drives a simple strategy for safely investing a 401(k) for maximum profit. Intermediate-term, investing with stock index tracking-ETFs (both their long and short varieties) is advanced. Short-term, stock index options occasionally offer extraordinary profit opportunities when the stock market is moving along its projected path.

Nothing is set in stone. Nor is the stock market's path of least resistance always known. More often than not, there are no stock index option positions recommended.


There's an easy way to boost your investment discipline...

Get Real-Time Trade Notification!

Wednesday, May 16, 2012

Bearish Crosscurrents


A couple points of reference, both of which suggest there's more selling ahead...


$NYA

First, early-August 2011 the NYSE Composite's RSI fell to 30 (top panel), this following a period of technical weakening as $NYA was topping. Here we are again. As you can see, there could be a whole lot of selling straight ahead.

Coincidentally, early-August 2011 was when the NYSE Composite Index fell below its [then rising] 200-day moving average. Today the index fell below its [now declining] 200-day moving average. Should the market's long-developing underlying technical weakness (now seeing some measures, like daily RSI, reach an extreme) presently precipitate an avalanche to the exits the dimension of selling yet in store gains further perspective with indication the current backdrop is weaker than last summer.

Somewhat tempering dire, near-term prospects is the second point of reference, wherein via its similar technical setup at May 1st, 2011 top, and then its subsequent behavior, momentum (bottom panel) might be seen suggesting bottom is not far off. Nevertheless, an approach of readings at early-October 2011 bottom presently appears in store.

Of course, an historic transition possibly unfolding in one devastating blow after another could be underway. So, we instead might find momentum imminently challenging its August 2011 low as the NYSE Composite Index craters to complete formation of a head and shoulders top. The present backdrop certainly favors this possibility.


Fast Money
* * * * *

© The Risk Averse Alert — Advocating a patient, disciplined approach to stock market investing. Overriding objective is limiting financial risk. Minimizing investment capital loss is a priority.

Analysis centers on the stock market's path of least resistance. Long-term, this drives a simple strategy for safely investing a 401(k) for maximum profit. Intermediate-term, investing with stock index tracking-ETFs (both their long and short varieties) is advanced. Short-term, stock index options occasionally offer extraordinary profit opportunities when the stock market is moving along its projected path.

Nothing is set in stone. Nor is the stock market's path of least resistance always known. More often than not, there are no stock index option positions recommended.


There's an easy way to boost your investment discipline...

Get Real-Time Trade Notification!
Tuesday, May 15, 2012

At the Edge of the Abyss


The market is right on the edge of the abyss. Its passage over the precipice to a prospective point of no return awaits confirmation via the following two measures...


$NYHL

With last year as our guide and the NYSE new 52-week high-low differential falling away from its 200-day moving average, the abyss comes into view as the differential today but confirms the NYSE Composite Index's further decline from its 2012 peak, today sinking the index to its [still declining] 200-day moving average.

Already well-established is underlying weakness this measure registers. So, conditions conducive to the market's collapse are present, and not yet accounted for. This reckoning could be next on the agenda, as the market's technical condition is weak and still deteriorating.


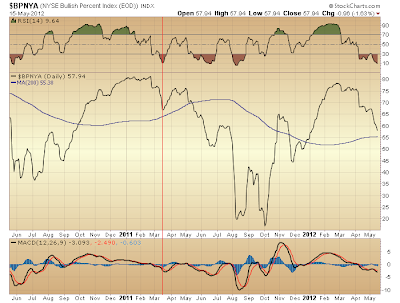
$BPNYA

The NYSE Bullish Percent Index is another technical measure presenting a snapshot of a market at the precipice. Noting this measure's similar disposition early last year one might reasonably suspect a bounce is in store. Yet were the market's collapse imminent, then in formation of but its first leg down occurring from 2012 peak to some near date, the above measure in all probability will "signal" the market's demise still to come, with today's 200-day moving average "support" becoming some soon tomorrow's "resistance" lasting over the [relatively brief] course of an evolving panic whose initiation, indeed, could be at the doorstep.


Fast Money
* * * * *

© The Risk Averse Alert — Advocating a patient, disciplined approach to stock market investing. Overriding objective is limiting financial risk. Minimizing investment capital loss is a priority.

Analysis centers on the stock market's path of least resistance. Long-term, this drives a simple strategy for safely investing a 401(k) for maximum profit. Intermediate-term, investing with stock index tracking-ETFs (both their long and short varieties) is advanced. Short-term, stock index options occasionally offer extraordinary profit opportunities when the stock market is moving along its projected path.

Nothing is set in stone. Nor is the stock market's path of least resistance always known. More often than not, there are no stock index option positions recommended.


There's an easy way to boost your investment discipline...

Get Real-Time Trade Notification!

Monday, May 14, 2012

Swooner Rather Than Later


Hey, do you remember last August?


NYSE McClellan

With the NYSE McClellan Summation Index about to go negative at the very moment when completion of a head and shoulders top in the NYSE Composite Index is prospectively imminent, this timely reminder of last August's swoon seems most fitting at the start of a week whose trading commenced this morning with a gap lower at the open...


Fast Money
* * * * *

© The Risk Averse Alert — Advocating a patient, disciplined approach to stock market investing. Overriding objective is limiting financial risk. Minimizing investment capital loss is a priority.

Analysis centers on the stock market's path of least resistance. Long-term, this drives a simple strategy for safely investing a 401(k) for maximum profit. Intermediate-term, investing with stock index tracking-ETFs (both their long and short varieties) is advanced. Short-term, stock index options occasionally offer extraordinary profit opportunities when the stock market is moving along its projected path.

Nothing is set in stone. Nor is the stock market's path of least resistance always known. More often than not, there are no stock index option positions recommended.


There's an easy way to boost your investment discipline...

Get Real-Time Trade Notification!
Friday, May 11, 2012

Anticipating Volatility: JPM Talks Its Book


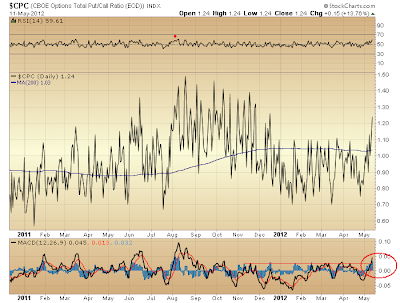
The momentum of the CBOE Put/Call Ratio's increase is warning of further selling ahead...


$CPC

While implied volatility rather indicates there is little worry over the prospect...


$VIX

Finding $VIX momentum precariously poised to rise as well puts on the radar a marked increase in volatility, much as $CPC's increase already appears to be anticipating. What of this is hedging and what of this is positioning is more difficult to say than what of JPM's posturing intends to "fix" a broken trade. The question is whether volatility frontrunners and unimpeachable bearers of bad news are one and the same...


Fast Money
* * * * *

© The Risk Averse Alert — Advocating a patient, disciplined approach to stock market investing. Overriding objective is limiting financial risk. Minimizing investment capital loss is a priority.

Analysis centers on the stock market's path of least resistance. Long-term, this drives a simple strategy for safely investing a 401(k) for maximum profit. Intermediate-term, investing with stock index tracking-ETFs (both their long and short varieties) is advanced. Short-term, stock index options occasionally offer extraordinary profit opportunities when the stock market is moving along its projected path.

Nothing is set in stone. Nor is the stock market's path of least resistance always known. More often than not, there are no stock index option positions recommended.


There's an easy way to boost your investment discipline...

Get Real-Time Trade Notification!

Thursday, May 10, 2012

A Distribution Well Done


Applying a line of support/resistance to the NYSE Composite Index — this in a manner similar to the S&P 500 as presented yesterday, yet extending over the greater duration of the market's counter-trend rally off March '09 low — an ominous construct well-along in its development suddenly appears: a head and shoulders top, looking rather symmetrical at that, with an upward bias no doubt a product of increasing expectations for endless hyperinflationary happiness...


$NYA weekly

Well, lookie there. Upwardly biased expectations diverge from downwardly biased relative strength and momentum. A timely find as both measures begin crossing into the negative. Indeed, on both counts the neckline at 7000 could be dead ahead, and then some.

I remember when the head was forming, late-2010, early-2011, identifying volume-related circumstance suggesting the market's decade-and-running distribution was done. The evidence was compelling. All the more now with this head and shoulders suggesting distribution is really done. Volume during formation of the right shoulder being muted from that during formation of the head (as is prerequisite) all the more warns of a market dominated by weak hands. Given this well-known [distribution] pattern's stark evidence of vulnerability at a rather precarious moment on both fundamental and technical fronts, a whole lot of nasty certainly could be in store, and pronto at that.


Fast Money
* * * * *

© The Risk Averse Alert — Advocating a patient, disciplined approach to stock market investing. Overriding objective is limiting financial risk. Minimizing investment capital loss is a priority.

Analysis centers on the stock market's path of least resistance. Long-term, this drives a simple strategy for safely investing a 401(k) for maximum profit. Intermediate-term, investing with stock index tracking-ETFs (both their long and short varieties) is advanced. Short-term, stock index options occasionally offer extraordinary profit opportunities when the stock market is moving along its projected path.

Nothing is set in stone. Nor is the stock market's path of least resistance always known. More often than not, there are no stock index option positions recommended.


There's an easy way to boost your investment discipline...

Get Real-Time Trade Notification!