Thursday, July 31, 2008

T.C. Parts Ominous Clouds Approaching His Sunshine Band


Although I cannot discount an [unwelcome] advance developing over the next day or three, I rather suspect the likelihood Monsieur Market rises much further from here (if at all) is slim at best.

All day today I have been concerned about whether I am missing something. The question I keep asking is whether the market's counter-trend rally since July 15, 2008 might extend in a similar fashion as occurred from March - May '08.

Truth is this could happen.

Truth, too, is most everyone (as best as I can tell) who a couple weeks ago held a negative view toward the market (and who remain bearish going forward) believes the current counter-trend rally will, indeed, extend. This is just a casual observation and is by no means conclusive.

(Any analysts you know of? Leave a comment.)

I am not about to join this group. Likewise, I doubt I will be forced to change my mind.

Given all indications under the covers, some of which I have presented here recently (going back to my most current McClellan Oscillator analysis in particular), I am, indeed, willing to go out on a limb...

It is show time!

Despite there being many [superficial] things suggesting a level of pessimism not typically preceding a collapse, under the covers pessimism does not run nearly as deep. In fact, it's practically non-existent.

Yet, too, there are certain objective measures indicating a heightened degree of negativity. To whit, there's the Investor's Intelligence poll of newsletter writers and the "Smart Money" Oscillator (hat tip to reader Mark).

Now, let me ask you this: do either of these make unlikely a collapse followed by an equally sharp advance over the next 3-5 weeks?

I think not. Furthermore, I think we might best expect this.

(I should add, though, this prospective view suggests a slightly altered Elliott Wave count than I have thus far presented. It's so minor it can wait until tomorrow's post.)


$NYAD

Just one simple point I wish to make in reference to the above chart...

Check out those instances when the MACD (a momentum oscillator) on the NYSE Advance-Decline differential rocketed strongly to the positive.

Now, map these to price action on the NYSE Composite...


$NYA

Look how pathetic the NYSE Composite's advance is in the present instance! Indeed, you also might reasonably conclude the NYSE Composite has, for the most part, shot its wad.

Now, look back again at the NYSE Advance-Decline differential and observe how its MACD weakened as the NYSE Composite was beginning to turn over. Lo and behold, it's already happening again. Yesterday's NYSE Composite advance took the index right back to the area where it peaked a week ago. However, the MACD on the Advance-Decline differential diverged. This is bearish, and...

That's the way, uh huh, uh huh, I like it, uh huh, uh huh.

(I dare you not to play that tune in your head, over and over, for the next hour or so.)

There's more revealing technical data I could present here, but it can wait...

My August OEX 520 Puts are not an immediate concern. Contrarily, my August OEX 560 Puts are. Stay tuned to Mr. Market Twitter for any action I might take on these.

(Many thanks to readers on my Trade Notification list who replied with kindness to my apology for not posting anything on Twitter today.)

* * * * *

© The Risk Averse Alert — Advocating a patient, disciplined approach to stock market investing. Overriding objective is limiting financial risk. Minimizing investment capital loss is a priority.

Analysis centers on the stock market's path of least resistance. Long-term, this drives a simple strategy for safely investing a 401(k) for maximum profit. Intermediate-term, investing with stock index tracking-ETFs (both their long and short varieties) is advanced. Short-term, stock index options occasionally offer extraordinary profit opportunities when the stock market is moving along its projected path.

Nothing is set in stone. Nor is the stock market's path of least resistance always known. More often than not, there are no stock index option positions recommended.


There's an easy way to boost your investment discipline...

Get Real-Time Trade Notification!

Wednesday, July 30, 2008

I Heard It on the X and Saw Z Top


One thing I thought to mention...

Cramer put Merrill Lynch CEO, John Thain, on his "Wall of Shame" last night. That's interesting timing ... sort of like his calling a turn in the housing market two months ago ... saying one thing (this time, financials have bottomed) ... and possibly(?) meaning something different.

And he heard it on the X — his bull side of a bottom supporting, equity duo — saying the market's rally could mean the corner has been turned. Hey Jim, I think U.S. Steel could sooner fall to $80-100 from its present $160. Go see for yourself. This is entirely reasonable.

Well, he alway says viewers should do their own homework. You do yours, then. And if you like, you can hand in mine for extra credit.


$OEX

I hope you see there's good technical reason to be holding Put positions here. It looks like a turn lower probably is near.

MACD still bears watching, yes. However, it remains negative, so the S&P 100 is not out of the woods yet.


$CPC

Just as October - November '07 coincided with but an initial move lower in the S&P 100, so too does the market's decline from May 19, 2008 likewise appear the same ... an initial move lower ... and soon enough followed by further decline, much like what unfolded December '07 - January '08. This essentially is how I am interpreting the CBOE Put/Ratio data, because it "fits" the outlook this Elliott Wave Guy continues believing both reasonable and likely.

An accelerated move lower to the area of 480-520 in the S&P 100 could unfold sooner than many presently are willing to think. That's been my story and I see no reason not to stick to it.

Oh yeah, about the buyers of Merrill's deeply discounted debt... Here's a story from February suggesting twenty-two cents on the dollar is not necessarily a bargain these days:

February 28 – Financial Times (James Mackintosh): “One of London’s most successful hedge funds imploded Thursday when Peloton Partners put the assets of its $2bn flagship fund up for sale and froze its remaining fund after geared mortgage bets left it unable to meet lenders’ demands. Rumours of the crisis at Peloton’s ABS fund, named best new fixed-income hedge fund last month, helped drive the high-quality mortgages in which it was invested to all-time lows this week as traders prepared for $9bn of assets to be dumped. The losses are particularly striking because Peloton ABS was one of the big winners from the US subprime crisis, gaining 87% last year after betting against low-quality mortgages. But last month Ron Beller, co-founder, told the Financial Times that the firm had begun investing in ‘good-quality assets that are trading at deeply discounted prices’ – including a large position in AAA-rated mortgages… ‘It is the classic story of when leverage goes wrong,’ one investor said. ‘But I can’t believe this problem is confined to these guys alone.’”


[5:00 p.m.]
That was an interesting close. It fits all possibilities Mr. Market Twitter suggested today ... all the way around.


NYSE 5-min

A new top slightly beyond last Wednesday's peak (7.23.08) remains an open possibility for the NYSE Composite. Since the start of yesterday's trek up fantasy mountain, RSI is behaving as would be expected.

If a new peak should be set, I would expect this to occur most immediately and with profoundly extreme, buy-side RSI registering. This would "fit" the big picture and could be a high water mark in the market's counter-trend rally off its July 15, 2008 lows. (Don't let the latter point slide by your eye. It's important.)

Otherwise, NYSE Composite may or may not have hit its ultimate counter-trend rally peak last Wednesday. Nevertheless, it likely is reaching the upper end of its present move higher.

Whatever the case, my August OEX Put positions are fine. I still have risk capital remaining, too. If the NYSE Composite bursts higher tomorrow morning, I probably will add to my present position.


NASDAQ 5-min

All things are more or less behaving as expected on the Pump and Dump. Whatever happens with the NYSE Composite ... my view sees NASDAQ Composite remaining below its peak today (though, this is neither preferred nor necessary).

One thing I thought revealing these past two days... Comparing NASDAQ to NYSE, you might see how the former gooses the latter. Then, once the mark is hit, the juice behind the Pump goes away.

Same squeeze, different day...

* * * * *

© The Risk Averse Alert — Advocating a patient, disciplined approach to stock market investing. Overriding objective is limiting financial risk. Minimizing investment capital loss is a priority.

Analysis centers on the stock market's path of least resistance. Long-term, this drives a simple strategy for safely investing a 401(k) for maximum profit. Intermediate-term, investing with stock index tracking-ETFs (both their long and short varieties) is advanced. Short-term, stock index options occasionally offer extraordinary profit opportunities when the stock market is moving along its projected path.

Nothing is set in stone. Nor is the stock market's path of least resistance always known. More often than not, there are no stock index option positions recommended.


There's an easy way to boost your investment discipline...

Get Real-Time Trade Notification!

Tuesday, July 29, 2008

One Day's Controlled Disintegration Does Not Make A Capitulation


I will forgo ranting about those blind souls who see light at the end of the financial industry tunnel, and continue my case for a pending stock market capitulation with no rant about today's seemingly positive market reaction to Merrill Lynch's chumming of shark infested waters ... running from Wall Street to Washington ... jam packed with varied species of pathetically weak creatures.

"Let them alone. They are blind leaders of the blind. And if the blind leads the blind, both will fall into a ditch."

Good advice. We shall see how many more blind fall in ... even were they a screaming bid tomorrow morn'.

No, there's no need to rant. But name names for posterity ... these fishers of bids ... inspired with dreams of yesteryear ... powerfully feeding the dull minded? Let no risk averse man be called Judas, then.

First accusing finger goes to the mad money man ... Mr. 0 for every macro forecast he's made since I, sometime way back, gave a 70% probability the S&P 100 was to fall below its March 17, 2008 low ... the author of the Helping Friendly Book ... the man who wrote the Helping Friend Book ... the one ... the only ... the special ... the great ... the knowledgeable ... the author of the Helping Friendly Book ... he wrote the book, okay ... he wrote the Helping Friendly Book ... and his name ... is ... Icculus.

Cramer is the great and knowledgeable Icculus.
Yeah! All his children are old enough to read Icculus.
A cold and lonely night.
Running the pace of the fright.
Look at a face tonight.

(Phish satire ... and when you read those lines to the music of Jaws, you might see how I imagine Cramer in times like these. A coming casualty presently frozen.)

It is not time for melt-up yet, Jim Cramer. Therefore, financials most probably have not bottomed. I have looked. July appears no more bottom than March.

Your victory celebration appears vulnerable to reality, Jim. It seems the free market breakdown is taking down big chunks of a tottering structure. Airlines? Autos? Nice work, Kudlow.

And why is the dollar not cratering? I am sure you will figure it out. Even though you can be ridiculous, you are by no means an idiot. I predict you will come to say as you already see (but refuse to believe?): controlled disintegration appears the order of arrangements underlying the present day.

That's the bomb Merrill detonated. Controlled disintegration. The death of denial is the bell Merrill tolled. We are fast approaching a reality phase-change. This truth and this truth alone was behind today's rally. It will be much the same during the coming melt-up.

In times like these students of history do not ignore tension concealed by a market reaction just too good to be true. Much as a healthy skepticism came in handy June 5, 2008 ... I suspect so again today.

All the more because Squeaky Maria "interviewed" two other well-traveled analysts who share Cramer's view. Though more tempered, they seem no less complacent given what's coming unglued.

I would not be so bold to stake this position were not the Elliott Wave Principle laying an analytical foundation supporting a view toward heightened volatility. True, nothing is set in stone. Still, all things suggest beware. There appears much deception. Today was no exception.

In fact, can it be otherwise, given momentous changes Merrill exposed to the world?

Call me sane. I see I am not alone...


[5:00 p.m.]
Returning to my presentation this morning...


NASDAQ 5-min

So far, a scenario similar to last Friday continues playing out. Is this count-trend advance over? Maybe.

Could kid NASDAQ rise further still ... carrying RSI to challenge this morning's peak ... possibly extending to a buy-side extreme, just like last Wednesday? Maybe.

Might today's weakening RSI ... diverging from NASDAQ's rise ... portend a decline twice as negative as yesterday's strengthening RSI proved positive today? Maybe.

Indeed, this would be most fitting confirmation a capitulation is nearly at hand.


NYSE 5-min

The same near-term possibilities here ... the same general outlook ... just a different exchange.

Some sort of price-RSI divergence might need to form before the NYSE Composite rolls over and dives to the area of its post-5.19.08 low set on Tuesday, July 15th. Thus, I continue waiting for confirmation of a low-risk opportunity to add an August OEX Put position to those I am already holding...


[1:30 p.m.]

As odd as this might seem, strong moves like today's help add clarity to the big picture. Nothing put forward last night is changed.

Per the developing shark feeding frenzy, I suspect we simply might be seeing positioning prior to the fallout ... a short squeeze helping stronger hands avoid the SEC's scrutiny.

The charts seem to agree. All indications advise looking out below.


NASDAQ 5-min

Today's pop on the Pump and Dump appears to be unfolding much like Friday's and further confirms expectations for trading within the price range established over the past couple weeks.

This morning's advance, however, begins a counter-trend rally one higher degree than Friday's (an Elliott Wave thing), and so commensurate RSI extension to a buy-side extreme stands to reason. Yet, this kind of mad rush has proven itself a ruse of late. Just look at last Wednesday.

The present moment appears to be setting up the finale to today's burst out of the gate, consolidating gains in similar fashion as the period from 11:00 a.m. to 2:00 p.m. on Friday. Likewise (and I think this is important), the move higher to NASDAQ's ultimate peak should be a struggle. This has been the trend over the past five days following what have proven unsustainable moves higher.


NYSE 5-min

Trading on the Big Board reveals a divergence of lower highs confirmed by higher RSI. This probably is setting up the NYSE Composite to fall still lower, much as was the case on Friday.

Now, just how today's counter-trend advance might conclude I cannot say. However, I will be looking to coincident action unfolding in the NASDAQ Composite for clearer indication when to add to current Put positions.

* * * * *

© The Risk Averse Alert — Advocating a patient, disciplined approach to stock market investing. Overriding objective is limiting financial risk. Minimizing investment capital loss is a priority.

Analysis centers on the stock market's path of least resistance. Long-term, this drives a simple strategy for safely investing a 401(k) for maximum profit. Intermediate-term, investing with stock index tracking-ETFs (both their long and short varieties) is advanced. Short-term, stock index options occasionally offer extraordinary profit opportunities when the stock market is moving along its projected path.

Nothing is set in stone. Nor is the stock market's path of least resistance always known. More often than not, there are no stock index option positions recommended.


There's an easy way to boost your investment discipline...

Get Real-Time Trade Notification!

Monday, July 28, 2008

Merrill, Merrill on the Wall, Which Bank Will Goldman Fall?


Let the feeding frenzy begin!

Crayons everyone ... it's time to play "connect the dots."

Merrill Lynch analyst Guy Moszkowski reports on Monday the growing likelihood Goldman Sachs, eager to establish a new and more stable source of funds, might snap up a bank "if [one] with excess deposits were available at the right price."

The operative words, of course, are "the right price" ... as in cheap ... or better yet, a steal ... literally.

But how?

Well, after the close we got a clue... Take a CDO tranche with an original $30 billion face value — recently (June) revalued at $11+ billion — and sell it off for a cool $6 billion.

Hello industry-wide write-downs! Get your bank stocks ... red hot bank stock here.

Then, possibly to assist Goldman further, Merrill announces it is going to raise $8.5 billion in new equity capital, diluting current equity holders' stake by over 25%.

Given recent reports financial firms are struggling to raise new capital, I might say we will just have to see how this goes. However, maybe it won't matter ... as long as Goldman gets their bank. In return Merrill could get absorbed, as a quid pro quo, and likewise gain access to the very same "excess deposits" Goldman apparently seeks.

One step back, two steps forward ... at least for Merrill and Goldman. As for the rest, well, get ready for a pants-ing.

Who ever could have predicted a rapidly accelerating financial industry consolidation?

This, I suspect, should hasten the stock market's capitulation...


[5:00 p.m.]
So, the Elliott Wave Guy is now looking at last Wednesday's peak a little bit differently than he has up to this point. Suddenly, there is less uncertainty about what has unfolded since. What's in store has become clearer as well.


OEX 5-min

The change in view is a rather subtle one. It simply supposes the counter-trend advance beginning on Tuesday, July 15, 2008 (labeled wave c) topped during the afternoon on Wednesday, July 23, 2008, rather than the morning.

Let me just say this slight alteration is no stretch of the rules put forward in the Elliott Wave Principle. Likewise, given what's to come, the brief moment of suspended animation marking top perfectly fits the big picture.

So too does predominantly sell-side RSI registered since last Wednesday. We have yet to see a noteworthy extreme reading, either ... and this suggests more selling is still to come.

Although what's ahead appears a lot clearer than it did this morning, I remain suspicious sideways trading within the range established over the past couple weeks could unfold over days ahead. Believe it or not, index price action on the Pump and Dump alerts me to this possibility.


NASDAQ 5-min

I am inclined to mark top in the NASDAQ Composite much as I have in the S&P 100. Here, though, it came at the open of trading on Thursday (7.24.08). Any Elliott wave geek can see a 3-3-5 wave unfolding since then — the first "3" down; the second "3" up; and five waves down in the process of forming.

Just look at today's pathetically weak RSI performance. Now, you might notice a price-RSI divergence registered over the course of the day as the NASDAQ Composite proceeded to sink lower. I am not at all concerned about this. In fact, you see something similar occurring throughout the day last Thursday. And just look at how she closed ... with RSI confirming the move lower ... thus, indicating the NASDAQ Composite would fall further still ... which, in fact, is precisely what happened today.

We should see a repeat performance.

Now, there might be some consolidation of today's losses come Tuesday ... at least during some part of the day. Or a pasting might unfold right from the get-go. Either way, I am inclined to say look out below.

Once indexes extend their losses to the area of recent lows over the past couple weeks, I'll be looking for a bounce ... maybe ... and then ... FINALLY ... the market's moment of capitulation quite likely could be at hand.


[9:00 a.m.]
It is not clear just how the trend lower from here will proceed. Despite wishing I had held onto my August OEX 570 Put (purchased at the close on Tuesday and sold Thursday morning out of fear the S&P 100 might make one last push higher — WRONG!) ... I expect an opportunity to sell some portion of my August OEX 520 Put position today or tomorrow.

I continue to be 100% certain the stock market has much lower to go before commencing a melt-up. The question is when will we see the stock market's long-anticipated capitulation. August generally has been an up month in my experience. But then again, the credit market was never so dysfunctional.

Prior to the open on Friday CNBC's David Faber indicated he could not contact a single hedge fund manager for comments. He assumed everyone was taking a three-day weekend. I had two thoughts on this.

First, I gathered we might see just how much pull hedge funds have in this market. The answer: apparently a lot. Friday being left to those whose portfolios are mandated to be more or less fully invested, we got precisely what one might expect: a nowhere trade with a slight upward bias.

And second, I thought these hedge fund guys and gals are living dangerously. Granted, one does not need to be in the office to conduct business these days. However, were things to turn rocky might being at the trading desk prove a decisive edge? So, does being away on a business day demonstrate complacency? Just a thought...


OEX 5-min

Hopefully we get a move down to the 570ish area today. I am not, however, certain the channel you see drawn above is meaningful. Like I said on Thursday, the initial move lower from Wednesday's peak appears "corrective" in form (it's an Elliott Wave thing) and suggests the market might trade sideways for a time within the range established over the past couple weeks.

That's why I want to reduce my deep out-of-the-money exposure (August OEX 520 Puts)...

* * * * *

© The Risk Averse Alert — Advocating a patient, disciplined approach to stock market investing. Overriding objective is limiting financial risk. Minimizing investment capital loss is a priority.

Analysis centers on the stock market's path of least resistance. Long-term, this drives a simple strategy for safely investing a 401(k) for maximum profit. Intermediate-term, investing with stock index tracking-ETFs (both their long and short varieties) is advanced. Short-term, stock index options occasionally offer extraordinary profit opportunities when the stock market is moving along its projected path.

Nothing is set in stone. Nor is the stock market's path of least resistance always known. More often than not, there are no stock index option positions recommended.


There's an easy way to boost your investment discipline...

Get Real-Time Trade Notification!

Thursday, July 24, 2008

Barney Frank Gives Paulson a Blank Check for a Bleeding Fannie


It appears many in Tinseltown believe today's thumping was just a speed bump on the road higher. Already, the same tired faces are claiming bottom is in. Today's slow, relentless bleed, they say, simply was but a remnant of difficulties already digested ... an echo of problems well on the way to being solved.

This, however, is not likely.

The future, you see, is being paved with a blank check the Congress has just written Treasury. And I contend this could facilitate what might be an historic consolidation of the financial industry over the months ahead.

Let's review the facts...

First came the take down of Bear Stearns and the wakeup call this imposed on Washington D.C. (in an election year no less). Call this incident a template for asset grabs on a fast track.

Then, more recently, we had a (manufactured?) shakedown of GSE debt and equity during the present, advanced stage of a still ongoing credit crisis precipitated by leverage gone wild on a revenue stream (i.e. mortgages) whose foundation was (purposely?) made weak under the guise of benevolence. (Paraphrasing a scene in the movie "Blazing Saddles," one might imagine many a former mortgage broker saying, "Income? We don't need no stinking income!")


Now, do you really think it is merely a coincidence the outbreak of crisis at the core of securities-based finance (i.e. the GSEs) occurred precisely at a time when the Congress was wrapping up the legislative process to The American Housing Rescue and Foreclosure Prevention Act?

The skeptic understands all things are not what they seem. So, under what appeared to be emergency conditions, Treasury Secretary Paulson asked Congress on July 13 to give the Treasury power to provide a liquidity and capital "backstop" for Fannie Mae and Freddie Mac.

Whala! The Congress has delivered the blank check Goldman Sachs ... er, I mean Treasury ... wanted.

Of course, the Congressional Budget Office, doing its best Alan Schwartz imitation, has assured the American public there probably is a better than 50% chance Treasury will not need to step in. Indeed, CBO says there is only a 5% chance Freddie and Fannie's losses cost the government $100 billion.

Again enters the skeptic ... recalling early cost projections of the war in Iraq ... suspecting there is a 100% chance that Freddie and Fannie's losses could cost the government ten times the CBO estimate ... easily.

Not that 20% of the combined $5+ trillion GSE portfolio is presently at risk.

However, once the pending financial industry consolidation accelerates a la BSC ... with the GSEs now having a blank check backstop at Treasury ... allowing them to absorb much of the toxic waste presently on the books of take down targets among the Cox 19 and beyond ... thus, taking the past many years' GSE portfolio expansion to a new level ... then might CBO assurances prove as devoid of credibility as an intelligence assessment coming from the mouth of Dick Cheney?

By no means has the stock market experienced capitulation in its yearlong consolidation. Maybe the grand finale has been patiently awaiting its subsequent melt-up fuel. Soon enough we will know with certainty...


A globe awash in Treasury and GSE securities points to another trend that's your friend...


$USD

(And this one leads to Dow 3600.)


[5:00 p.m.]
Up until today I have been assuming the S&P 100's initial decline from its May 19, 2008 peak was being corrected with a simple Elliott wave form whose end was nigh. Indeed, it appears this anticipated counter-trend rally reached its zenith yesterday morning.

Now, however, it appears trading over coming days could extend the S&P 100's present [pre-capitulation] correction. Price action since yesterday's peak raises this possibility. Nevertheless, once this correction finally completes a sharp move lower might then more likely unfold.

Simply put, nothing about the big picture has changed, despite a slight alteration to my present outlook. Let me explain...

As I am sure you are aware, indexes never move in a straight line. Sometimes there are periods when sideways trading develops. Here, an index moves both counter to the main trend, as well as with it, too ... and remains more or less range bound. The present correction of the S&P 100's decline from 5.19.08 might turn out to be one such instance.

Best guess right now has the S&P 100 continuing its ongoing correction somewhere within the range established over the past couple weeks. As I indicated at the start, it appears the upper end of this range was set yesterday. Thus, presently, the S&P 100 appears in the process of trading back down to the area of 55o (give or take).

Of course, this forecast move lower probably will not unfold in a straight line. There likely will be brief periods when the S&P 100 trades sideways-to-higher in the course of completing its presently unfolding decline to the lower end of its recent trading range.

Finally, bear in mind there is nothing set in stone about the perspective I am presenting here. Much as I indicated in remarks made earlier today, it simply appears the market's fade from yesterday's peak is demonstrating such characteristics as heighten the possibility I am raising.

Without going into details here, this present refinement in my view toward the S&P 100's still ongoing correction of its decline from May 19, 2008 seems rather fitting with the general character of things over the entire duration ... signaling both further selling dragging the index inexorably lower and the pending completion of the market's nearly yearlong consolidation of gains made since October 2002.


OEX 5-min

Weakness demonstrated by RSI following yesterday morning's peak was only further revealed today from start to finish. This suggests more weakness still to come on Friday. The projection of a drop to the 570 area is more or less a reasonable guess at this point.


[11:00 a.m.]
Everything about the S&P 100's turn away from yesterday's a.m. peak has the look of a corrective wave unfolding part and parcel with the index's advance since Tuesday, July 15, 2008, rather than an impulse wave beginning its much anticipated capitulation.


OEX 1-min

This morning's decline produced RSI degradation suggesting the S&P 100's advance from its Tuesday morning low (7.22.08) is reaching exhaustion (much as should be expected here). Expect one final advance lifting the S&P 100 slightly above yesterday's peak, with RSI diverging from the extreme buy-side strength it coincidentally registered then.


OEX 5-min

Curiously, the NYSE Composite has broken below its rising trend line since bottoming on Tuesday, July 15, 2008. However, this does not negate the possibility that, it too is slated to make one final advance to a level slightly higher than yesterday's peak. Like the S&P 100, the NYSE Composite's decline since yesterday morning is not unfolding in such a way as suggests the beginning of its anticipated capitulation.


NYSE 5-min

Of course, I could be wrong. My analysis here might be faulty. Nevertheless, I am satisfied to bail out of my August OEX 570 Put position, breaking even and anticipating a better entry point ahead.

I still have five August OEX 520 Put positions open, too. I am not yet sure what to do with these. For the time being I will hold, just in case my analysis here proves wrong.

* * * * *

© The Risk Averse Alert — Advocating a patient, disciplined approach to stock market investing. Overriding objective is limiting financial risk. Minimizing investment capital loss is a priority.

Analysis centers on the stock market's path of least resistance. Long-term, this drives a simple strategy for safely investing a 401(k) for maximum profit. Intermediate-term, investing with stock index tracking-ETFs (both their long and short varieties) is advanced. Short-term, stock index options occasionally offer extraordinary profit opportunities when the stock market is moving along its projected path.

Nothing is set in stone. Nor is the stock market's path of least resistance always known. More often than not, there are no stock index option positions recommended.


There's an easy way to boost your investment discipline...

Get Real-Time Trade Notification!

Wednesday, July 23, 2008

Down on Cox Farms


In case it escaped your notice... when Wall Street milks a cow, it takes every last drop and then, when the cow can give no more, Wall Street draws blood.

Witness FNM and FRE. One or both probably is on the way to being saved by zero. By no means should anyone assume the drama unfolding at the core of securities-based finance is near resolution.

The trend that's your friend is the fate of Bear Stearns, waterfall charts of the GSEs, and a hopelessly compliant Congress. All speak volumes about an ongoing power grab whose end has only begun to play out.


OEX 5-min

And speaking of cows being milked to the last drop ... I must say the situation is looking a good bit like that going into Tuesday morning's trade. In other words, I suspect any weakness at the open on Thursday will be followed by one last bump up to the top of the channel drawn on the chart above.

Much as I indicated was possible, RSI reached a buy-side extreme during this morning's burst higher out of the gate, even exceeding the level it reached last Thursday. Although this latter result generally is atypical, it is not at all unexpected at this point in the grand scheme of the market's decline since 5.19.08.

I have of late written at some length about how I evaluate RSI in the context of Elliott Wave formulations. Today's price-RSI performance fits perfectly with my outlook. The market is very near its moment of truth in a long-anticipated capitulation. So, it stands to reason underlying technical measures (like RSI) would demonstrate a measure of fearlessness most inappropriate for the occasion.

First, though, it appears the cows on Cox Farms might not yet be milked dry. So, I may cash my August OEX 570 Put if the market opens lower Thursday, then buy two back later in the day once the cows are ready for slaughter...


* * * * *

© The Risk Averse Alert — Advocating a patient, disciplined approach to stock market investing. Overriding objective is limiting financial risk. Minimizing investment capital loss is a priority.

Analysis centers on the stock market's path of least resistance. Long-term, this drives a simple strategy for safely investing a 401(k) for maximum profit. Intermediate-term, investing with stock index tracking-ETFs (both their long and short varieties) is advanced. Short-term, stock index options occasionally offer extraordinary profit opportunities when the stock market is moving along its projected path.

Nothing is set in stone. Nor is the stock market's path of least resistance always known. More often than not, there are no stock index option positions recommended.


There's an easy way to boost your investment discipline...

Get Real-Time Trade Notification!

Tuesday, July 22, 2008

Cramer as "Bull Run" Takes a Trip Down Memory Lane


About the raft of financial institutions claiming ready access to capital, experiencing no funding problems...

Here's what Alan Schwartz told the world two days prior to the Bear Stearns take down.

The trend is your friend.

Enough said.

The NYSE McClellan Oscillator is a nice read tonight. I see snake eyes on your "Bull run," Mr. S&P Oscillator, Jimmy Sachs Cox and I don't care...


NYSE McClellan

The dots point to what have proven good Put option entry points. Right now, it seems, especially so.

One thing really worth noticing is how, in the present instance ... with the McClellan Oscillator having rocketed from the negative to the plus (much as it has several times the past year) ... the NYSE Composite has barely recovered, relatively speaking. Weakness lies naked before your eyes.

Another instructive observation about the astonishing ascension of the Oscillator... It's above where it stood on May 19, 2008. A second wave in Elliott's five waves typically demonstrates an underlying technical tenor rivaling that when the first wave began. The McClellan Oscillator, then, is offering substantiation of my Elliott Wave count ... where wave 1 completed the week before last and wave 2 is wrapping up right now.

Per anticipated a steep thud ... the market's [apparent] pending decline should coincide with the McClellan Oscillator falling below zero ... that is if OEX 520 should be all the more likely (which, itself, should be somewhere in the 7600 NYSE Composite vicinity). This is the lesson I gain from the December '07 dive.

Nevertheless, whether a Titanic decline comes imminently or not, the McClellan Oscillator suggests this is a good Put option entry point.


OEX 5-min

The dots here are intended to demonstrate typical price-RSI relationships. Third waves generally are the strongest Elliott waves. RSI coincident with a fourth wave generally diverges from the second wave. Fifth wave RSI more often than not diverges from third wave RSI. When fifth wave RSI exceeds third wave RSI, chances are the five waves are forming a larger third wave (and a "c" wave is a third wave).

So, even if this market ... flush with panicking bankers ... opens higher tomorrow, driving RSI above its peak last Thursday (7.17.08) — that miserable third wave of a third wave driven by a bunch of Cox Suckers on a train that wrecked my July 550s and 520s — you git yaseff long puts, ya hear.

Heads up on really disturbing news, too...

* * * * *

© The Risk Averse Alert — Advocating a patient, disciplined approach to stock market investing. Overriding objective is limiting financial risk. Minimizing investment capital loss is a priority.

Analysis centers on the stock market's path of least resistance. Long-term, this drives a simple strategy for safely investing a 401(k) for maximum profit. Intermediate-term, investing with stock index tracking-ETFs (both their long and short varieties) is advanced. Short-term, stock index options occasionally offer extraordinary profit opportunities when the stock market is moving along its projected path.

Nothing is set in stone. Nor is the stock market's path of least resistance always known. More often than not, there are no stock index option positions recommended.


There's an easy way to boost your investment discipline...

Get Real-Time Trade Notification!

Monday, July 21, 2008

Jumping Jiminy Cramer Sachs Cox


Sorry, but I can't help myself. If the masters of television want to make jokes of truth with obfuscation of facts, then someone is bound to take the opening and make people laugh...

Here's a Goldman story that went unnoticed last week while I was vacationing at the CME. Apparently, there's been a shark sighting on Wall Street.

Move over Sea World. Hello SEC. Killer whales got nothing on this Great White shark pool. Thought you might be interested in who's playing Jaws and who will be eaten. It's the Cox 19.

Cramer, Cramer, Cramer. You're good. I'm not complaining. But sometimes you are just plain ridiculous. Here. Do this. Think of Dr. McCoy saying, "Dammit Jim, I'm a doctor not a commando!" Okay, repeat after me: "Dammit Jim, I'm a hedge fund manager, not a convincing actor!" Your rant on short selling ... c'mon who are you kidding? You're like sweet icing on a Goldman cake. Surely, you know no one is buying bank equity. The feeding frenzy has begun and the chef's specialty is assets on the cheap.

So, this is where we're at. Could it be any more in your face? And what stock market sector has been driving fear over the past year? Here come a fast ball?


OEX 5-min

This evening's news bodes selling at Tuesday's open. I'm wary whether this will be "the big one," part 1, though. There could be more "work" needed before the advance beginning last Tuesday morning (7.15.08) is completed. Nevertheless, don't imagine the coming peak will be much higher than where the S&P 100 traded this morning.

The channel drawn above is only to provide some guideposts showing the range in which trading might unfold over the next couple days. That's not to say top might not be reached in the next couple hours, though. So, heads up.


OEX weekly

There's the possible shape of things to come ... showing the coming blast lower to 520 ... followed by consolidation, possibly downward sloping, similar to wave iv of 1 ... and completed by a final fade to the vicinity of 480.

Just imagine the gnashing of teeth. You think bearishness now is bad? Hey, Maria is back ... our bottom belle. And for the time being she still is squeaking. This, I believe, coincides quite well with sentiment revealed on the options front...


$CPC

A picture is worth a thousand words I think. Here you see "like from like" possibilities ... now, relative to last December '07. It's beginning to look a lot like Christmas. And the forecast is a blizzard of shares.


$VIX

Sure looks to me like volatility could be poised to rocket higher, too.

Go figure!

* * * * *

© The Risk Averse Alert — Advocating a patient, disciplined approach to stock market investing. Overriding objective is limiting financial risk. Minimizing investment capital loss is a priority.

Analysis centers on the stock market's path of least resistance. Long-term, this drives a simple strategy for safely investing a 401(k) for maximum profit. Intermediate-term, investing with stock index tracking-ETFs (both their long and short varieties) is advanced. Short-term, stock index options occasionally offer extraordinary profit opportunities when the stock market is moving along its projected path.

Nothing is set in stone. Nor is the stock market's path of least resistance always known. More often than not, there are no stock index option positions recommended.


There's an easy way to boost your investment discipline...

Get Real-Time Trade Notification!

Sunday, July 20, 2008

Humility at High Noon


Over the weekend I received the following e-mail from a reader. I want to share it with you because what was said is entirely true...

"Tom, I detect some hubris in your notes. I don't know you, you don't know me. From what I have learned from your website and discussions, I have built up respect for you and your talents. Without doubt. Stay Risk Adverse.

"Buying far out of the money puts with a day or two left to expiration is not risk adverse. Whether it's the house's money or not.

"I offer this as just a piece of the puzzle. You've heard it all before, you've lived it.

"... Confidence in trading is essential, I know. The market may go up or down from here, you may be right with your scenario. ... What I do know, what I have learned from The Beast, is:

"Humility. The Beast rules."

To which I reply...

Guilty as charged!

(Please don't murder me)

* * * * *

© The Risk Averse Alert — Advocating a patient, disciplined approach to stock market investing. Overriding objective is limiting financial risk. Minimizing investment capital loss is a priority.

Analysis centers on the stock market's path of least resistance. Long-term, this drives a simple strategy for safely investing a 401(k) for maximum profit. Intermediate-term, investing with stock index tracking-ETFs (both their long and short varieties) is advanced. Short-term, stock index options occasionally offer extraordinary profit opportunities when the stock market is moving along its projected path.

Nothing is set in stone. Nor is the stock market's path of least resistance always known. More often than not, there are no stock index option positions recommended.


There's an easy way to boost your investment discipline...

Get Real-Time Trade Notification!

Friday, July 18, 2008

Monsieurs Gone Wild: Naked Shorts Exposing Cox


Monday could mark the beginning of the end for many of the 19 financial institutions targeted by the U.S. Securities and Exchange Commission's emergency rule curbing "abusive short selling." Truth is I suspect all things are not what they seem. There might be more to the SEC's action than meets the eye.

Let's think about this. It's a fact short selling adds liquidity to the marketplace for battered stocks. That's because short positions eventually are covered via a purchase of the shorted stock on the open market. Thus, a stock's relentless drive lower might be halted sooner as short sellers seeking to take profits step in, and buy shares to cover their positions.

Given these facts you would think the SEC emergency rule might instead require every American home owner with a mortgage to escrow a balanced long and short equity position in the GSEs. In other words, if regulators wanted to support share prices of financial institutions grotesquely leveraged to the mortgage market, it seems they would somehow attempt to widen the vested interest in the fortunes of these companies by expanding equity ownership and bolstering the market's capacity to put a floor under their share prices.

Yet, this is not what the SEC emergency rule does. Instead, it weakens the floor under the share prices of those 19 financial institutions affected, making it more difficult for anyone to short their stocks. Brilliant. So, absent any fundamental reorganization restoring confidence in the solvency of these institutions, 'tis only a matter of time before renewed selling pressure stands ready to destroy these companies whose share price safety net has been weakened.

One is left to wonder whether this result is intended. Is this the means by which consolidation in the financial industry is to be hastened?

Still, as they say, timing is everything. Announcing this emergency rule the week options were set to expire was, in the mind of this observer, a fine demonstration of how power is not a function of what you know, but rather who you know. Paper tiger or not, the SEC lit a fire under the financials, affecting a massive short covering rally of historic dimensions, making the SEC commissioner and those Wall Street interests benefiting from this decision worthy of the name Cox.

I crack me up...

Now, this little pilot project — supposedly slated to be in effect only 30 days starting Monday — might already have proven itself so effective its reach could be widened. Imagine the melt-up caused by panicked money managers fearing unwanted scrutiny from the Steal Easy Commission as it extends this rule to cover other heavily shorted sectors. Imagine, too, the assets to be grabbed for pennies on the dollar as the safety net under share prices is removed.

So, put that in your pipe and smoke it as you contemplate my stock market melt-up followed by Dow 3600 thesis.

Returning to the present moment ... the SEC, once swimming aimlessly, now smelling blood, has turned tail and given fright to a bunch of small fry ... while soon-to-be victims bob helplessly, gasping for air ... unaware their demise might be orchestrated to the tune of becoming a shark's cheap meal.

Maestro! Strike up the band.

Is the answer to Final Jeopardy about to be revealed? Make no mistake! The stock market's decline since May 19, 2008 has yet to feature a devastating, panic-stricken dive. The chart of the S&P 100 presented on July 10, 2008 simply was meant to make this case visually.

Then, on Monday, July 14, 2008 (see 11:00 a.m. update) I presented the following view showing how the trip to Ground Zero might proceed...
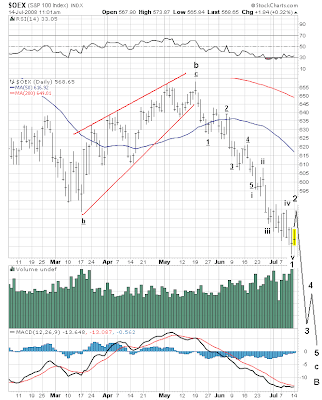

$OEX

Notice how wave 2 was projected to rise into the area where wave iv of 1 had formed. All rather elementary Elliott Wave stuff.

Hey, did you happen to notice wave iii of 1 is approximately .618 (the Fibonacci ratio) the length of wave i of 1? More geeky Elliott Wave stuff. But powerful! So, get out your calculator and tell me where wave 3 should end. You can assume wave 2 is moments from completing. Likewise, the relationship between waves 1 and 3 probably will be astonishingly similar to the relationship between waves i and iii [of 1].

Did you come up with a target of 520?

"Like from like" is a principle building block of all nature, including human nature. Feel the power...


$OEX

As I indicated yesterday, "strong recoveries of underlying technicals to levels prevailing some weeks ago when indexes traded considerably higher than they do today ... [is] precisely what one might expect ... just prior to collapse."

And let me tell you ... I wish I had, indeed, anticipated this. Instead, my sights were set on the possibility the market's underlying technical condition would continue to progressively worsen going into the moment of capitulation (i.e. wave 3). Even following Tuesday's (7.15.08) trading ... when I was anticipating a bounce of sorts ... I thought technical weakness would persist.

Bzzzz. Wrong.

And the result? Monsieur Market has cast a pall of uncertainty on imminent prospects by creating cross-currents made to deceive the greater majority of analysts and commentators. I am not one of them, though. I remain convinced the stock market is poised to blow up.

Now, you might look at the above chart, observe the sharp turn higher in daily RSI and think this suggests the S&P 100 has completed its decline from May 19, 2008. But grasshopper, have you noticed RSI remains positioned within the range where sell-side strength is evidenced (i.e. below 50)?

Likewise, observe how RSI flattened out nicely today while the S&P 100 stubbornly held below lows it reached on its worst day of trading yet (June 26 2008), post-5.19.08 top. This is encouraging because it confirms the gravity — the strength — of selling on June 26th and validates the Elliott Wave count I have indicated.

Now, what about the turn higher in MACD? Well, yes, this does bear watching. However, it still remains in negative territory and has a long way to recover before confirming a reversal in the S&P 100's declining trend.

For the moment, then, let's consider what MACD's break higher might be portending by looking at its performance in the mid-April '08 period. At the time MACD (which had been rising) broke lower as the S&P 100 declined to retest its late-March low in the vicinity of 610 (which, by the way, was considerably above the low it set on 3.17.08). Yet, MACD, though falling in sympathy with the S&P 100, held in positive territory. Thus, the market's underlying strength, though momentarily weakened, remained supportive. Subsequently, the S&P 100 launched higher and soon afterward MACD confirmed.

So, the mid-April '08 MACD break lower amounted to nothing more than a head fake. We are probably looking at the same thing right now, but in reverse.

Furthermore, that MACD descended to a fairly deep level of sell-side strength prior to its present turn higher simply lends considerable supporting evidence to the Elliott Wave count I have assigned to the S&P 100's ongoing decline from its May 19, 2008 peak. Everything "fits" expectations implied by my longstanding forecast ... both in how what has unfolded thus far is being technically substantiated ... and in how what is yet to come finds underlying technical conditions perfectly poised to confirm the stock market's pending sharp decline.

I could go through the same exercise with the McClellan Oscillators in particular, both for NYSE and NASDAQ. Much as I alluded yesterday, these too have registered "an incredible reset" ... bouncing to relative levels where one might reasonably expect the stock market to suffer a significant setback, and with all due haste. Just look back to late-December and consider the relative similarity to the present period. You will see precisely what I mean.

Also supporting my present outlook is the continuation of the relatively poorer performance of the NYSE Composite versus the NASDAQ Composite. Quite simply, I consider this circumstance something of a double-edge sword, foretelling the likelihood of further selling pressure, as well as setting up the market for its still pending melt-up.

Being that nothing is set in stone, I should add there is a possibility we could see the market hold up for some weeks before ultimately coming unglued. However, I am rather inclined to suppose the stock market's long awaited capitulation is at hand. There simply is nothing contrived or strained in supposing the moment of truth has arrived.

Of course, there is no way I could pound the table and claim some indisputable reason for supposing the time of departure is NOW. Still, the S&P 100 is positioned precisely where an Elliott Wave Guy can reasonably suppose it will either turn lower, or it won't. This simply presents an options position entry point very well-suited to the cause of low-risk trading.

So, get ready to go long August OEX Puts...
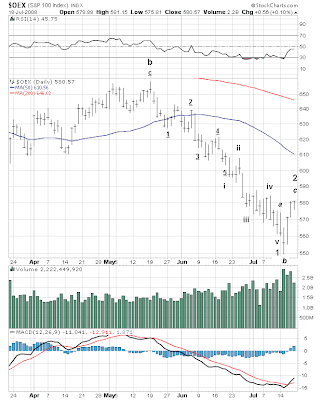

[5:00 p.m.]
The jury remains out on whether the S&P 100's counter-trend rally has completed. However, if its peak has not been reached, then it probably is but moments away. Trading today on NASDAQ supports this view. Indeed, the NASDAQ Composite probably peaked yesterday and has begun its move back down.


OEX 5-min

Despite a lot of nothing today, RSI continues holding above its low registered Wednesday morning. While neither an issue nor a point of concern, having commented about price-RSI divergence in this morning's update, I wanted to highlight the situation again and suggest the lack of sell-side RSI deterioration, today versus Wednesday, leaves open the possibility the S&P 100 could rise further before turning decidedly lower. Likewise, RSI's lift during today's last hour similarly highlights this possibility.

Now, trading these past two days also supports the likelihood that, vested interests who pulled off Thursday morning's short squeeze probably shot their collective wad. Indeed, if they had any more ammo ... or, more accurately, if they had any further need ... the past nine hours of trading might not have been quite so flat. So, there probably is not much more upside left before the S.O.S. goes out.


NASDAQ 5-min

Today's gap open lower on the Pump and Dump is likened to warnings produced by minor earthquakes just prior to a volcanic eruption. The course of trading over the remainder of the day all the more confirms the danger. However, going into today's close RSI did manage to creep into the area where buy-side strength is evidenced (i.e. above 50). So, Monday might, indeed, begin on a positive note. That said, I'm willing to bet today's gap open lower will not be filled.

A smallish bump higher Monday morning is what I am anticipating and hoping for. This will present an opportunity to establish a Put position in the August contract and make back the premium we just gave up in the July contract.

Seeing the magnitude and speed of the market's advance Tuesday - Thursday, you should find some comfort knowing our July positions shoulda, woulda, coulda been cause for celebration tonight, rather than resignation. What I mean to say is we saw proof before our very eyes how far a third wave (in this case a "c" wave) can travel. The distance we needed, though in the opposite direction, would easily have been met if wave 3 (of five waves down from the 5.19.08 peak) contrarily had begun to unfold. Conditions were so ripe for it, too! Yet, it simply was not to be. Instead, we saw how in a blink of an eye ... how in an instant ... fortunes can change.

I have much more to say, but right now let me just assure you I remain confident my account's present $1,000 risk capital (double my initial $500 stake) still stands to be multiplied by 100 (maybe more, maybe less) over the course of weeks straight ahead.

There simply is little doubt in my mind the sort of screaming volatility necessary for achieving such a feat remains highly probable.


[11:30 a.m.]
I still do not know if the move up from Tuesday morning's low is but seconds away from completing ... or if a bit more bobbing and weaving might occur in the rarefied air where grotesquely leveraged pigs like JPM hover miles above ground they stood just days ago.


OEX 5-min

As you see, the S&P 100's advance is losing steam. When my Mr. Market Twitter notes "price-RSI divergence," this is what I am referring to. This condition's manifestation implies growing weakness underlying the trend under consideration (in this case the advance from Tuesday morning's bottom).

Now here's something I prefer leaving in the background. Often times you will see RSI coincident with a fourth wave registering a reading that diverges from RSI registered during the formation of the prior second wave. Thus, assuming today's low during the first half-hour of trading were the end of wave 4, we do not see this typical fourth wave versus second wave RSI divergence. RSI remained above the level it registered during the formation of wave 2.

Does this mean wave 4 has not yet completed? Maybe so, maybe not.

Recall Wednesday's 5:00 p.m. update where I presented a 2-day chart of the S&P 100. At the time I was supposing five waves forming a wave c from Wednesday's low possibly had completed. During the formation of wave c RSI confirmed each sub-wave (i.e. waves 1-5) every step of the way. This, generally speaking, is unusual. However, I also explained why it is not inexplicable.

I bring this up because of the present lack of a fourth wave versus second wave RSI divergence occurring thus far in the advance from Tuesday morning's low. Again, I am anticipating this advance to subdivide into five waves forming wave c. Being that a "c" wave is a third wave — typically possessing the strongest underlying character — we might not expect typical price-RSI divergences. Thus, I am reluctant just yet to label waves 4 and 5 of wave c.


NASDAQ 5-min

The Composite Index tracking action on the Pump and Dump shows a different picture. We see the same price-RSI divergence developing during the formation of yesterday's top. However, we also see a price-RSI divergence comparing this morning's low versus Wednesday morning's low.

Being today's was a higher low than Wednesday's, RSI registering a lower low indicates a weakening of COMP's advance since Tuesday.

It may turn out the NASDAQ Composite still has one final advance prior to collapsing. The only "clue" I am able to discern here is the exchange favored by boiler rooms all across America is leading the way (as has been typical for many years now), demonstrating a measure of underlying weakness not yet evidenced on the Big Board.

And this is precisely what one should expect prior to Super Regulator "Flounder" entering stage right...

* * * * *

© The Risk Averse Alert — Advocating a patient, disciplined approach to stock market investing. Overriding objective is limiting financial risk. Minimizing investment capital loss is a priority.

Analysis centers on the stock market's path of least resistance. Long-term, this drives a simple strategy for safely investing a 401(k) for maximum profit. Intermediate-term, investing with stock index tracking-ETFs (both their long and short varieties) is advanced. Short-term, stock index options occasionally offer extraordinary profit opportunities when the stock market is moving along its projected path.

Nothing is set in stone. Nor is the stock market's path of least resistance always known. More often than not, there are no stock index option positions recommended.


There's an easy way to boost your investment discipline...

Get Real-Time Trade Notification!