Friday, August 29, 2008

A Metaphoric Market Forecast


There really is not much point micro-analyzing the vital signs of our sick, dying Monsieur Market. It is well enough right now just to get some truthful sense of his pathetic state...


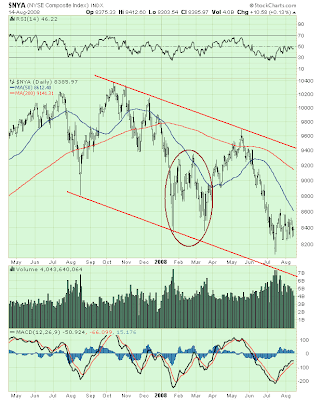
$NYA

Poor Monsieur Market. Looks like he might need ten Jim Cramer's, the privatization of Social Security, and, oh, another little old World War to grease the skids.

We really must sweep our Tory filth from the stage ... those monetarist monkeys — touch my monkey! pet it! love it! — and put the country and its business back to work again ... on a crash basis. Something like FDR ... JFK ... someone with courage enough to make all the bad debt go away ... along with those no good hens who laid so many rotten eggs.

And Senator Obama... $150 billion over ten years building windmills is chump change in Vegas, baby.

Metaphorically speaking, we'd be better off thinking like the "The Chairman of the Board" and demanding nothing less of our nation and its leaders...


Oh, but no. Wall Street's Mother demands unbridled love for such Masters of Disaster as can fill her media with mockery toward everything history teaches. With so much garbage being spewed, it's times like these American's ought really think about putting the EPA to good use.

Only the best slime for today's financial capitals of the world! And if it is a bad tree, can it bear good fruit?

We know how front page political frauds get where they are. Just follow the money. So, connect the dots. It's not hard imagining Wall Street (and probably The City, too) might soon become burnt toast. It's a safe bet because a bad tree bears bad fruit.

Well, they say be careful what you wish for. Most of the time this is just superstition. In this instance, however, it is looking like fait accompli. President Bush's "Mission Accomplished" takes on new meaning ... metaphorically speaking that is.

Actually, the risk of disaster coming from Mother's kitchen probably has more to do with the fact you cannot serve two masters. And this is what Franklin meant by "a Republic, if you can keep it" ... which necessarily requires a people who bear good fruit.


$BPNYA

As you can see, this view of the underlying situation currently is not quite like December '07 or February '08. The subtle difference supports the notion the present period is a cyclically positive one. This, I assume, might lend some longevity to the market's buoyancy since July '08.

Really, though, how much better can things get? Truth is longevity might not afford great improvement.

Observe how much juice has been expended to produce such a pitiful bounce on the Big Board. This says something, too. Taken in combination with poor vital signs shown on the chart of the NYSE Composite ... it seems quite possible, then, a trip toward July's low might soon unfold.

Even were this to happen, though, there most likely will be life still left — a pulse remaining for one last attempt at a November fix ... coming from a bad tree's sick heart ... still beating with longevity.

This bears close watching because post-election events just might unravel like a metaphor in the search for the Holy Grail (particularly the club over the head part)...

Note to Washington and Wall Street You are neither kings, nor are you fooling anyone...
* * * * *
© The Risk Averse Alert — Advocating a patient, disciplined approach to stock market investing. Overriding objective is limiting financial risk. Minimizing investment capital loss is a priority. Analysis centers on the stock market's path of least resistance. Long-term, this drives a simple strategy for safely investing a 401(k) for maximum profit. Intermediate-term, investing with stock index tracking-ETFs (both their long and short varieties) is advanced. Short-term, stock index options occasionally offer extraordinary profit opportunities when the stock market is moving along its projected path. Nothing is set in stone. Nor is the stock market's path of least resistance always known. More often than not, there are no stock index option positions recommended. There's an easy way to boost your investment discipline... Get Real-Time Trade Notification!

Thursday, August 28, 2008

Guaging Stock Market Selling Avalanche Risk


There is a serious problem being exposed by the trend in the volume of shares exchanged. It portends a certain prospect I have feared for some time, but have yet to write about. This is as good a time as any...

Trading since July's bottom exposes the fact fewer players, relatively speaking, are bolstering the market ... extending the very same tendency revealed the last time the market bounced (March - May '08).

This is an environment ripe for a selling avalanche.

Should volume's relative shrinking remain the norm while the market maintains its present buoyancy ... the threat of an awful collapse will only grow more acute.

An advancing market void of increasing selling demonstrates fearlessness. This is the antithesis to the wall of worry the market is said to climb.

Given today's systemic risks not seen for several generations, the apparent lack of worry among those who hold their shares (rather than sell, sell, sell) stands as a beacon — a virtual bell — which, I believe, any competent market historian dares not ignore.
This is why I advise the average investor not risk a dime in the stock market at the present time. This most emphatically goes out to tens of millions of clueless 401(k) participants.
Now, a lack of buying serving to add new positions also is responsible for diminishing volume since July's bottom, as is a lack of selling.

So, ask yourself, then... Would not strong hands increase their buying when an extended, positive period in the stock market is expected? Of course they would!

Twice already this year (March and July) strong hands have come to the rescue with high volume reversals following protracted declines. Yet their buying did not at all increase as the market rose. Instead, it was cut back. Why?

Clearly, strong hands have only been interested in buying time.

So, can we still expect a melt-up carrying various market indexes above peaks reached in '07?

Better first look for a powerful advance during which volume exceeds anything registered since the market's move higher got underway on July 15, 2008. Then we can be more certain strong hands are seeing green, despite our likely not knowing why this is.

Truth is this could happen. However, the fact of the matter is it has not. And because this is so, we ought be aware of the risk...

Should the combination of factors behind the market's diminishing volume of trade in some way or another persist over the weeks and months ahead ... a sudden stock market collapse could result — virtually without warning and almost overnight — in the event some earth shattering shock erupts.

Let me be clear. I am not forecasting this scenario's likelihood. Rather I simply am pointing out a potential vulnerability reflected by an ominous trend in the volume of shares traded over the course of 2008 in particular.

As you know, recently I have become suspicious toward the possibility of a market melt-up unfolding any time soon. In addition to the reason I just laid out — the volume picture speaks volumes, and this is irrespective of the fact its diminishing is heightening the potential risk of a selling avalanche — there really has been no compelling evidence strongly suggesting bottom to the market's decline since October '07 has been reached.

Recall what expectation I had over the course of the market's bounce March - May '08...

Rightly, I was anticipating a capitulation ... a sharp decline decisively taking out the low set on March 17, 2008. (You might also recall that, once this low was exceeded, many other observers similarly were calling for a capitulation.)

Did a capitulation in fact come to pass, though? Maybe. However, I have some serious doubts. What evidence I have thus far presented (via the McClellan Oscillator) just as well could be subtly inferring growing underlying weakness characterizing the market's tone (despite the suspiciously "well-behaved" manner in which the market fell from May - July '08).

Bottom line is, given the relative violence of market declines since Q3 '07, the most recent swoon hardly fits the picture of a capitulation. This was the point of my Final Jeopardy post back on July 10th.

More critically, the greater preponderance of technical evidence (outside the McClellan Oscillator) raises doubt about whether a pressure-ending sell-off has come to pass. Although I readily admit nothing is set in stone, being an Elliott Wave guy I simply must be mystified about the relative lack of technical confirmation supporting the case for a bottom-signaling capitulation.


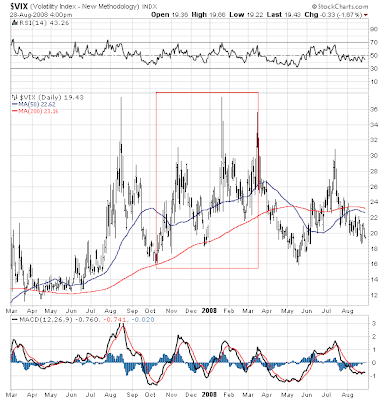
$VIX

A case in point in this regard is revealed by the Volatility Index. It seems this technical measure would likely confirm a fear-filled capitulation during a market sell-off anticipated to be severe. However, this simply did not happen going into July's bottom.

Now, had my Elliott Wave analysis not been calling for a crushing blow following the market's May 19, 2008 peak ... I might be looking at the VIX differently. I might be citing its divergent behavior over the course of the market's decline to a lower low as evidence supporting my melt-up thesis.

But that's not how I see it. At this point I would expect July's low soon to be taken out ... if, indeed, a market melt-up still is in store. Furthermore — and this is important — some additional underlying technical evidence of capitulation rightly should be expected. This should be revealed by the VIX in particular.

Chances are, though, the hour has passed on the possibility of a market melt-up. This in all probability will prove true even if July's low soon fails to hold.

The area highlighted on the above VIX chart coincides with the market's decline from October 11, 2007 through March 17, 2008. VIX performance during this period confirms an Elliott Wave view suggesting the market's ups and downs over the interim are related and form a discrete, declining impulse wave.

So, considering the market's decline to a lower low, May 19, 2008 - July 15, 2008, and seeing how VIX remained relatively subdued — diverging from what ultimately is its underlying basis: the S&P 100 — an Elliott wave view supposing the market's decline from October '07 - March '08 is but an initial move lower in a bear market with a long way yet to go gains probability. That VIX should have blown out ... but didn't ... becomes a red flag when considered in combination with volume analysis presented earlier.

Let me add one final thought. Elliott Wave-related prospects for major market indexes become much clearer at present when viewed from a perspective supposing a meltdown is in store sometime in the not-too-distant future.

Thus, evidence suggesting a heightened risk of a selling avalanche is all the more compelling and should not be ignored...

* * * * *

© The Risk Averse Alert — Advocating a patient, disciplined approach to stock market investing. Overriding objective is limiting financial risk. Minimizing investment capital loss is a priority.

Analysis centers on the stock market's path of least resistance. Long-term, this drives a simple strategy for safely investing a 401(k) for maximum profit. Intermediate-term, investing with stock index tracking-ETFs (both their long and short varieties) is advanced. Short-term, stock index options occasionally offer extraordinary profit opportunities when the stock market is moving along its projected path.

Nothing is set in stone. Nor is the stock market's path of least resistance always known. More often than not, there are no stock index option positions recommended.


There's an easy way to boost your investment discipline...

Get Real-Time Trade Notification!
Wednesday, August 27, 2008

Monsieur Market Says, "Give Me Volume or Give Me Death"


Could last year's stock market peak be the beginning of the end — the kick-off to a multi-year bear market whose dimensions prove historic? The character of the market's bounce off its July '08 low — even more so than earlier this year (i.e. March - May) — highlights this probability.


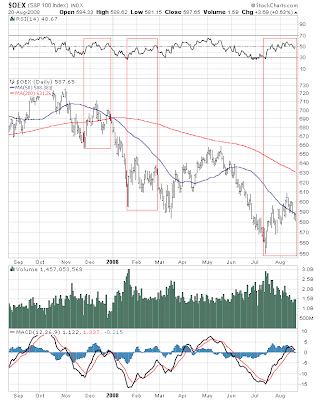
$OEX

Much as was evidenced during the market's recovery from its March 17, 2008 bottom, volume following July's low has been just plain pathetic. This is a rather revealing development. Let's see if it persists. Diminishing volume coinciding with a rising market is the kiss of death.

Trouble is there may be no further, decisive move higher from here (say, like occurred during the latter half of April '08).

No doubt, technical measures such as RSI and MACD — both much improved from July's bottom and reasonably well-positioned at present — suggest the market could continue holding up. However, both measures are beginning to fade at a foreboding threshold. Once again, direct your attention to December '07. Remember a few weeks back when I highlighted the present period's similarity?

Also noted then was the S&P 100's 50-day moving average acting like a brick wall. Further problematic is the fact that, despite the market's maddening levitation, the 50-day moving average continues to fall (not to mention its deteriorating relation to the 200-day moving average in comparison to December '07).

Now, I do not know how soon July's low will be taken out. However, I am rather certain Cramer does not know his bottom from a hole in the ground.

And about the market's melt-up prospects ... am I suggesting this is off the table?

Not necessarily.

Yet at the moment an incredible complacency quite evidently remains in vogue. Thus, it is wise to ask:

Are suspicious circumstances accompanying both pathetic bounces following each of this year's two turns lower revealing a classic distribution?

If this proves to be the case, then last year's peak might not be exceeded for years...

* * * * *

© The Risk Averse Alert — Advocating a patient, disciplined approach to stock market investing. Overriding objective is limiting financial risk. Minimizing investment capital loss is a priority.

Analysis centers on the stock market's path of least resistance. Long-term, this drives a simple strategy for safely investing a 401(k) for maximum profit. Intermediate-term, investing with stock index tracking-ETFs (both their long and short varieties) is advanced. Short-term, stock index options occasionally offer extraordinary profit opportunities when the stock market is moving along its projected path.

Nothing is set in stone. Nor is the stock market's path of least resistance always known. More often than not, there are no stock index option positions recommended.


There's an easy way to boost your investment discipline...

Get Real-Time Trade Notification!

Tuesday, August 26, 2008

Throwing Water on the Wicked Wizard of Wall Street


Oh boy. How I would love to hammer Cramer's bottom call in all things related to housing. Some other time ... soon ... I will present competent chart analysis likely to rip his conclusion to shreds.

I'll just say this right now. Typically ... at least if he is following his script ... Cramer makes a lousy macro call, then drinks Scotch on his linoleum floor. Apparently, though, the desperation for new, dumb money has become so acute that, first, a Scotch binge helping him keep a straight face, then, the kind of chart analysis sure to ruin anyone who buys into it is the order of the day.

Let me be blunt. Only commentary born of complacency would refuse to recognize the name of a formerly liberal credit system now dead, dead, dead is not Lazarus. Thus, if there were any attitude to take here at the precipice of what might likely prove to be the riskiest moment since 1929, blind, drunk and complacent is not, it seems, the wisest disposition.

It is one thing to suspect a market melt-up presenting a trading opportunity sometime in the near future ... and entirely another to claim all is well (or might soon be) such as to justify jumping in with both feet.

Indeed, this might be a good time to revisit another recent bottom call Cramer made...


XLF

Looks to me like a declining trend in financials ... a massive technical "reset" in July '08 occurring without a single notable divergence preceding it ... and now, plenty of room for a further slide, lower still, even after half of the gain made during July's short squeeze already has been erased.

I might soon need to change my name to Toto, exposing the humbug of CNBC's Wizard of Wall Street...


Okay, let's get real...


OEX 5-min

Just before the market closed today, I posted a Mr. Market Twitter saying, "Last hour bid by what is supposed to be 'smart' money probably will prove a failure over the next couple days as selling likely returns."

Well, before any serious bout of selling gets under way I suspect a drive higher towards Friday's peak (8.22.08) probably will develop. I wanted to clarify that.

And with that out of the way ... I see a play coming. Monsieur Market appears to be in trouble ... and a trip challenging July's low might be in order shortly. The evidence is in fact piling up, so stay tuned. Its presentation will be forthcoming...

* * * * *

© The Risk Averse Alert — Advocating a patient, disciplined approach to stock market investing. Overriding objective is limiting financial risk. Minimizing investment capital loss is a priority.

Analysis centers on the stock market's path of least resistance. Long-term, this drives a simple strategy for safely investing a 401(k) for maximum profit. Intermediate-term, investing with stock index tracking-ETFs (both their long and short varieties) is advanced. Short-term, stock index options occasionally offer extraordinary profit opportunities when the stock market is moving along its projected path.

Nothing is set in stone. Nor is the stock market's path of least resistance always known. More often than not, there are no stock index option positions recommended.


There's an easy way to boost your investment discipline...

Get Real-Time Trade Notification!

Monday, August 25, 2008

First Sign of a Wall of Worry Appears


How's that for sickly trading? Some cyclically positive period, huh.

Chances are there's still more selling to come following today's not-so-surprising sharp move lower. Just how much is not any more certain, though.

One thing worth noting...

Low volume accompanying a more or less straight line decline like today's indicates a greater measure of underlying fear than might first seem to meet the eyes. This is revealed simply by buyers refusing to step up. Thus, we see some sign of the wall of worry the market is said to climb.

I continue supposing the expected break below July's low might be preceded by more or less indecisive trading over the next couple weeks, providing little clarification of what's likely to unfold most immediately during the interim, and so, inspiring the briefest of analytical commentary, like today's...

* * * * *

© The Risk Averse Alert — Advocating a patient, disciplined approach to stock market investing. Overriding objective is limiting financial risk. Minimizing investment capital loss is a priority.

Analysis centers on the stock market's path of least resistance. Long-term, this drives a simple strategy for safely investing a 401(k) for maximum profit. Intermediate-term, investing with stock index tracking-ETFs (both their long and short varieties) is advanced. Short-term, stock index options occasionally offer extraordinary profit opportunities when the stock market is moving along its projected path.

Nothing is set in stone. Nor is the stock market's path of least resistance always known. More often than not, there are no stock index option positions recommended.


There's an easy way to boost your investment discipline...

Get Real-Time Trade Notification!

Friday, August 22, 2008

Playing Taps for a Rising Market on Shrinking Volume


Today's push to the upside extends the conspicuous trend since July's bottom of a market forging higher on diminishing volume. This might not mean anything to Wall Street's cheerleaders at CNBC, but to anyone who refused to drink the Jim Jones', "low volume means nothing," Kool Aid from March 17, 2008 through May 19, 2008, it is a different story.

A market rising on diminishing volume is exhibiting one (and only one) thing: complacency. If, indeed, "the market climbs a wall of worry," this should be reflected by the volume of shares exchanged.

Fear in one form or another is what makes a willing seller. Fear builds the wall of worry the market is said to climb. And fearlessness is not forever rewarded on Wall Street.

Granted, an advancing market on diminishing volume can go on longer than might seem "right." Then again, a deer will stand frozen in the headlights until it is too late, and bring many a driver to wonder how much more obvious could their vehicle's lurking danger be?

Move you stupid animal!

Splat!

Too late.

Why is it they see something coming ... something out of the norm ... yet fail to sense the gravity of the situation? Could it be some natural manifestation of fearlessness born of a critical lack of experience?

Was spring '08 that long ago? Odd, because the situation right now is all the more plainly obvious...


$OEX

As for the here and now, a number of alternative scenarios could unfold. Best guess is the market's bounce off July's low is not completed.

Still, though, the market could drop like a rock over the next couple days. Furthermore, whether it drops or not, there's no assurance the 8.11.08 peak eventually will be exceeded.

All this only is to suggest the market's anticipated decline below July's low does not yet appear squarely in the cross hairs.

There's something else I just noticed about the volume of shares traded and this could change the complexion of developments I have been anticipating...


$OEX

Yikes! Are you noticing how volume is spiking over the course of this year's trading as the S&P 100 has given back gains made over the two years previous?

What of the fact this largely has occurred near each new trough — lower than the previous — the S&P 100 has fallen to? Is this willingness to support the market but another manifestation of deer in the headlights fearlessness?

Well, I am not putting forward this question with any terrible sense of conviction. However, I do have a deep sense of suspicion.

Here's what I think this observation makes possible:
  1. The market's pending decline below July's low might unfold rather quickly ... rather than via a slow, death by a thousand cuts move.

  2. The market melt-up I have been anticipating might be a pipe dream. Last year's highs ... at least for large-cap S&Ps and the Big Board's Composite ... might not be seen again for several years.

  3. If the NASDAQ Composite miserably fails to challenge its peak set in 2007, "the stock market for the next one hundred years" might go the way of Bear Stearns.
This is not to suggest a collapse might be imminent. I still expect positive cyclical influences to bolster the market at least through election day ... and quite possibly into the new year.

Beyond Elliott Wave considerations allowing for the possibility presented here, there are observations involving underlying technical measures similarly supporting a view suggesting complacency is pervasive.

Trouble is, though, right now, these same indicators give every reason to suppose a period of buoyancy over the next few months probably is the more reasonable view to hold for the sake of identifying potential trading opportunities. This seems all the more relevant given various sentiment measures which, during periods of distress in bull markets, typically coincide with the stock market turning decidedly higher.

However, much as I have observed already with the Investors Intelligence Bullish Consensus of investment newsletter writers over the course of the year thus far, negative sentiment in a bear market is an entirely different ball of wax.

Now, one last word about the volume spikes noted above... This observation might as well substantiate the possibility the market will melt up once "the" bottom is in place (again, July's low in all probability was not bottom to the market's multi-month decline).

All evidence of fearlessness notwithstanding — or, better put, regardless of the market behaving like a deer in the headlights — there being some apparent willingness to rescue each successive decline from the abyss at least keeps the possibility of a melt-up alive. However, I am growing ever more dubious this, indeed, will happen.

So, in conclusion let me just say the next few months should reveal a lot...


(This, I argue, is behind what's bringing down FNM and FRE)

* * * * *

© The Risk Averse Alert — Advocating a patient, disciplined approach to stock market investing. Overriding objective is limiting financial risk. Minimizing investment capital loss is a priority.

Analysis centers on the stock market's path of least resistance. Long-term, this drives a simple strategy for safely investing a 401(k) for maximum profit. Intermediate-term, investing with stock index tracking-ETFs (both their long and short varieties) is advanced. Short-term, stock index options occasionally offer extraordinary profit opportunities when the stock market is moving along its projected path.

Nothing is set in stone. Nor is the stock market's path of least resistance always known. More often than not, there are no stock index option positions recommended.


There's an easy way to boost your investment discipline...

Get Real-Time Trade Notification!

Thursday, August 21, 2008

Taking the Pulse of a Dying Patient


The ever-sly Monsieur Market continues his typical way of frustrating an analyst's ability to forecast what's to come over days ahead. Whether he will rise to a new high in his post-July 15, 2008 bounce ... or soon fall to his knees in the course of suffering death by a thousand cuts ... I cannot say.

However, at the moment, though diseased, he appears strong enough to say, "I'm not dead yet."


OEX 5-min

The S&P 100's move lower since Monday, 8.11.08 evidently is a three-wave affair and, therefore, appears corrective in nature. That today's trading resulted in the index rising above its low on Wednesday, 8.13.08, suggests these three waves lower are related. Add to this improving relative strength (RSI), and you simply must conclude the S&P 100 is slated to move higher from here.

However, it is entirely possible the S&P 100 could suffer its death by a thousand cuts with a special, trend-ending form known in Elliott Wave parlance as a "wedge." Each component wave in a wedge subdivides into three waves. Thus, a wedge's first wave may have formed from 8.11.08 - 8.20.08. Me no know for sure, though.


NYSE 5-min

Quite the same picture on the NYSE. This bad boy has been on his knees for the better part of the past month, though. Bids could come into the Big Board and, indeed, carry the NYSE Composite to a new, post-July 15, 2008 high ... and still this important index — unlike all others — might yet have completed its decline since May 19, 2008.


NASDAQ 5-min

Quite a different picture at the Pump and Dump. It's possible the leadership role the exchange favored by boiler rooms all across America has reversed to the downside.

So, on one hand we see how a mountain of liquidity ... a misguided psychology believing a radically altered environment negatively affecting the one sector which over the past thirty years has become "the economy" — the financial industry — is somehow insignificant and inconsequential ... and a positive cyclical period ... are acting to hold up the stock market.

On the other hand, however, are Elliott Wave considerations suggesting July's lows are not bottom to the market's multi-month consolidation of gains made from 2002-2007.

Combining the two, the stage is set for the last act of death by a thousand cuts over the weeks ahead. Just how this likely will unfold, though, I cannot say. Bottom might be near when the SEC announces its new short selling rule sometime over the next few weeks...

* * * * *

© The Risk Averse Alert — Advocating a patient, disciplined approach to stock market investing. Overriding objective is limiting financial risk. Minimizing investment capital loss is a priority.

Analysis centers on the stock market's path of least resistance. Long-term, this drives a simple strategy for safely investing a 401(k) for maximum profit. Intermediate-term, investing with stock index tracking-ETFs (both their long and short varieties) is advanced. Short-term, stock index options occasionally offer extraordinary profit opportunities when the stock market is moving along its projected path.

Nothing is set in stone. Nor is the stock market's path of least resistance always known. More often than not, there are no stock index option positions recommended.


There's an easy way to boost your investment discipline...

Get Real-Time Trade Notification!

Wednesday, August 20, 2008

Since When is a Capsized Ship Not Sinking?


Sharks continue circling their GSE victims ... pressing to consume their vastly larger, healthier limbs ... generating much turbulence around the issue of collapsing equity values ... rather than fretting over utterly unsustainable leverage added by Mortgage-Backed Securities (MBS) these behemoths guarantee.

This latter matter is deserving of far greater attention ... irrespective of Cramer's ranting about the lack of financial transparency impacting investor confidence in the system. Furthermore, all this is secondary to criminal matters affecting real people ... whose lives have been turned upside down by a greed-driven process that filled the pool of mortgages to be securitized at an unprecedented rate.

Long before Jim Cramer ... Wall Street wisdom stated, "When in doubt, stay out." So, were there in fact much uncertainty associated with the GSEs this thought might be worth considering. However, FNM and FRE have been falling fast for over a year now, so what really is the big mystery?

It is, indeed, only whether the cynic rightly sees a manufactured crisis elevating more of the same criminal activity to become the "crowded trade" in our beloved "free market" orgy.


$OEX

The present similarity to recent periods past continues ... and suggests the market's bounce off July lows might play out a bit more before a final turn lower to bottom unfolds.

However, in keeping with the Case for Death by a Thousand Cuts it is entirely possible the S&P 100 has bounced as high as it will. As such, then, trading since last Monday's peak (8.11.08) might be the first in a series of cuts to come over the next few weeks. This possibility notwithstanding, though, a turn higher still appears in store ... once the present move lower is completed.


OEX 5-min

The price-RSI divergence formed during the S&P 100's decline Monday and Tuesday appears to have set the stage for today's bounce. However, I suspect we might see the market trade sideways for a day or three before sinking a bit lower. This would further the possibility mentioned above, wherein the S&P 100 has already begun its descent to bottom (in the vicinity of 520?).

Again, even were this the case, a move back up toward last Monday's peak (8.11.08) might be in order before any strong move lower develops...

* * * * *

© The Risk Averse Alert — Advocating a patient, disciplined approach to stock market investing. Overriding objective is limiting financial risk. Minimizing investment capital loss is a priority.

Analysis centers on the stock market's path of least resistance. Long-term, this drives a simple strategy for safely investing a 401(k) for maximum profit. Intermediate-term, investing with stock index tracking-ETFs (both their long and short varieties) is advanced. Short-term, stock index options occasionally offer extraordinary profit opportunities when the stock market is moving along its projected path.

Nothing is set in stone. Nor is the stock market's path of least resistance always known. More often than not, there are no stock index option positions recommended.


There's an easy way to boost your investment discipline...

Get Real-Time Trade Notification!

Tuesday, August 19, 2008

Seeing the Forest for the Trees


Back on July 23, 2008 I went Down on Cox Farms and reported what I saw...

"By no means should anyone assume the drama unfolding at the core of securities-based finance is near resolution," I said.

Today the former chief economist at the IMF, Kenneth Rogoff, agreed, saying, "[FNM and FRE] should have been closed down 10 years ago," adding, "They need to be nationalized." He also went on to predict, "The worst is yet to come in the U.S.," saying, "The financial sector needs to shrink; I don't think simply having a couple of medium-sized banks and a couple of small banks going under is going to do the job."

That last comment certainly indicates the kind of thinking necessary to become chief economist at the IMF. For years now this "august" institution has applied its nation-wrecking austerity formula to many a strapped, sovereign state. It was only a matter of time before the world's largest debtor nation received its due. Why they even made a movie to help jam unwelcome sacrifice down our throats!

Yet it's the push for nationalization that's of interest here. Not that I believe this will do any good to maintain the status quo of, say, the past thirty years or so. However, I suspect it could help Wall Street pick up the pieces and recapitalize for pennies on the dollar ... putting the masters of recklessness in better position to survive the financial storm likely to develop over the next several years.

This is what I was getting at when I wrote Jumpin' Jiminy Cramer Sachs Cox and said, "The feeding frenzy has begun and the chef's specialty is assets on the cheap." Momentum appears to be building.

I also see SEC Chairman Christopher Cox has let the financial markets know that, within the next few weeks a new rule on short selling will be announced. Ever the cynic, my guess is the world's hungry financial sharks will gain the means to prevent anything from gumming up the works. A disintegration unfolding too quickly is to be avoided if possible. Nevertheless, a disintegration — controlled — very much appears likely, indeed.

So, once again the news lends further weight to my market melt-up followed by Dow 3600 thesis...


$VIX

The VIX provides an interesting study in the evolution of the credit market breakdown now targeting the core of securities-based finance ... and its impact on equities trading.

Trouble erupted in the sub-prime mortgage market early in '07 when New Century Financial, the second largest sub-prime lender next to Countrywide, went belly-up in March. Then in June '07 a couple hedge funds controlled by Bear Stearns, largely invested in CDOs backed by sub-prime mortgages, were forced into liquidation. Subsequently in August '07 the carnage went global and spread to other asset-backed credit markets unrelated to sub-prime mortgages.

These were the seeds of credit destruction whose sprouting came as no shock to many. Likewise, with all the leverage built atop a shrinking physical economy providing insufficient income it is little surprise troubles have spread.

Still, the stock market rocketed higher from late-March through July '07, then higher still into its peak in October '07. What up with that?

I think the simple answer begins with liquidity ... and ends with animal spirits highly geared to take advantage of opportunities as they appear ... no matter what underlying circumstances might otherwise suggest "ought" to happen.

This little exercise courtesy of the VIX — which, itself, has behaved rather tamely since its late-August '07 peak — is meant to suggest a stock market melt-up is, indeed, possible. Truth be known, sometimes I have trouble convincing even myself of this...


[5:00 p.m.]
Today saw more of the same as yesterday unfold. In the process positive RSI divergences took further form across both exchanges. Expect a bit more of the same as a short-term bottom is made and a resumption of the market's bounce off July's low ensues...


NYSE 5-min
NASDAQ 5-min

The Pump and Dump's relative outperformance of the Big Board continues ... suggesting the market's bounce off July lows is not over ... and further providing subtle evidence of there being underlying interest in owning undervalued stocks.

This latter point lends support to my pending melt-up thesis. The desire to seek out value might indicate some significant portion of sideline cash is not afraid of growing risks.

We will see whether NASDAQ's relative outperformance of the NYSE will persist as the final move lower to bottom of the market's multi-month correction unfolds...

* * * * *

© The Risk Averse Alert — Advocating a patient, disciplined approach to stock market investing. Overriding objective is limiting financial risk. Minimizing investment capital loss is a priority.

Analysis centers on the stock market's path of least resistance. Long-term, this drives a simple strategy for safely investing a 401(k) for maximum profit. Intermediate-term, investing with stock index tracking-ETFs (both their long and short varieties) is advanced. Short-term, stock index options occasionally offer extraordinary profit opportunities when the stock market is moving along its projected path.

Nothing is set in stone. Nor is the stock market's path of least resistance always known. More often than not, there are no stock index option positions recommended.


There's an easy way to boost your investment discipline...

Get Real-Time Trade Notification!

Monday, August 18, 2008

A Stock Market Like Mid-Year 1929 With Tories Galore to Boot


The other day I linked to a Bloomberg story reporting management at J.P Morgan / Chase fessing up to problems the firm is facing. The outlook was not at all sparky. In fact, it was downright gloomy. Indeed, there is every reason to believe Still More Gnashing of Teeth Before Market Melt Up Begins.

However, something occurred to me. When the market reaches an important top the general outlook is blue skies and sunny days for as far as the eye can see. Similarly, the future typically portends nothing but stormy conditions just as the market makes a significant bottom.

Now, far be it to suggest fundamental frailties embedded within our contemporary financial arrangement suddenly will be resolved. In fact, the market's projected melt-up probably will be nothing more than a liquidity-driven short squeeze.

This should come as little wonder given how present circumstance might be likened to the first half of 1929, when stresses brought about by an imbalanced financial environment were beginning to take their toll. Eventually, by hook and by crook, these were temporarily resolved and a melt-up unfolded, leading to a top of historic proportions.


DJIA weekly

The market might be setting up similarly. However, I am only making a technical observation here supporting the present period's fundamental likeness to the 1929 investment environment. Just as some substantive shift in the underlying financial climate then unavoidably led to a stock market breakdown, the same appears to be occurring now.

Once again in our time every conceivable effort is being made to sustain the unsustainable. For a brief time, too, the fixes might appear to be working. However, massive leverage built upon a shrinking physical economy have long been the recipe for disaster. Enter, then, my outlook for a prospective decline to the vicinity of Dow 3600 sometime over the next several years.

There is plenty of time to think more about developments that might precipitate during the coming financial storm. All I know is history cannot be easily erased. Reasonable, workable solutions to difficult problems have precedent. And there is nothing to fear but fear itself.

So, here and now the evidence suggests the stock market is not far from a bottom from which a melt-up might commence, much as occurred during the summer of 1929. Let's have a closer look...


OEX weekly

Since January '08 the S&P 100 has twice moved to a new low for the year and in both instances an RSI divergence was registered. I expect this to occur once again as the S&P 100 embarks on its final decline into bottom.

With anticipation toward the market's subsequent melt-up ... weekly RSI could register a buy-side reading stronger than any over the past ten years ... as the S&P 100 extends beyond its 2007 peak. This would confirm my present Elliott Wave-based view suggesting the market currently is correcting its 1982-2000 advance ... setting up for a steep decline to the area major indexes traded during 1994 and a subsequent 1000% gain following that. Of course, nothing is set in stone.


$OEX

So, what other technical conditions might develop as the S&P 100 proceeds to form its bottom? Well, RSI and MACD divergences ... coincident with an S&P 100 falling on diminishing volume ... would be good.

Truth is, though, several possible scenarios might develop here...

One thing potentially supportive of a pending melt-up following the S&P 100's yet-to-be-seen bottom would result in both RSI and MACD exceeding respective May '08 peaks sometime during the market's present bounce. This would suggest underlying strength is building ... and provide further basis for anticipating positive technical divergences once the S&P 100 finally reaches its bottom.


$OEX

You can see why the current bounce probably has not completed. Weakening underlying conditions one should expect at a top have yet to fully form. Although these are not necessarily a precondition for a reversal in trend, the expected turn lower to ultimate bottom will more likely unfold when RSI and MACD divergences are registered as the S&P 100 reaches the top of its present bounce from the July 15, 2008 low.


OEX 5-min

The next leg up in the S&P 100 appears nearer to forming. Today's decline below last Wednesday's low (8.13.08) was confirmed by 5-minute RSI ... which, itself, has now begun to diverge. However, further price-RSI divergence probably needs to develop before the S&P 100 turns higher and moves closer to completing its bounce off July's low.


* * * * *

© The Risk Averse Alert — Advocating a patient, disciplined approach to stock market investing. Overriding objective is limiting financial risk. Minimizing investment capital loss is a priority.

Analysis centers on the stock market's path of least resistance. Long-term, this drives a simple strategy for safely investing a 401(k) for maximum profit. Intermediate-term, investing with stock index tracking-ETFs (both their long and short varieties) is advanced. Short-term, stock index options occasionally offer extraordinary profit opportunities when the stock market is moving along its projected path.

Nothing is set in stone. Nor is the stock market's path of least resistance always known. More often than not, there are no stock index option positions recommended.


There's an easy way to boost your investment discipline...

Get Real-Time Trade Notification!

Friday, August 15, 2008

Building the Case for Death by a Thousand Cuts


The probability of an expected move taking various stock indexes to new lows for the year coming by way of a sharp sell-off might be lessening. The McClellan Oscillator for both the NYSE and NASDAQ Composite indexes suggests so much. Death by a thousand cuts instead appears the more likely manner in which July '08 lows will be taken out.

I originally thought the McClellan Oscillator's burst higher in July might be likened to what happened last December '07 (see Cramer's "Bull Run" Takes a Trip Down Memory Lane). That it is holding up positive longer than I supposed, though, probably means something different. Of course, I am only speculating.

A drawn out decline completing the stock market's multi-month correction certainly would be harmonious with the entire move lower over the past year.

Likewise, this final move lower, once it gets under way, might result in the McClellan Oscillator remaining negative for an even longer duration than was the case May '08 - July '08. You will recall the Oscillator's prolonged stint in the negative was considered a condition indicative of capitulation (see Unmasking the Stock Market's Capitulation). An extended stay below zero would be harmonious with Elliott Wave expectations for a correction-ending decline, too.

I might also anticipate the McClellan Oscillator registering notably shallow negative readings, though, over the duration. This would further the case for capitulation, indicating selling finally has been washed out.


$OEX

The market climbs a wall of worry. So, when you are worried would you hold shares? Would you buy shares? No! You would sell shares and this would result in the volume of shares traded increasing.

However, precisely the opposite is happening. Therefore, a case for anticipating the present rally's failure is made.

Look for RSI divergence to form (much as occurred at the May '08 peak) before the S&P 100 turns over.

MACD appears near to reversing and returning to the negative. Of course, nothing is set in stone and things could evolve in a manner similar to early April '08. One notable difference now versus then, though, is no price-MACD divergence developed prior to the present launch higher. So, I am more inclined to think MACD's current position suggests a reversal lower is near.

Moving forward, though, we might expect positive MACD divergences to form as the S&P 100 sinks below its July 15, 2008 low. Already a positive divergence has developed ... comparing July's S&P 100 bottom to January's (not shown). Further MACD divergences forming as the S&P 100 bottoms over the weeks ahead would be favorable confirmation suggesting a melt-up likely will follow...

* * * * *

© The Risk Averse Alert — Advocating a patient, disciplined approach to stock market investing. Overriding objective is limiting financial risk. Minimizing investment capital loss is a priority.

Analysis centers on the stock market's path of least resistance. Long-term, this drives a simple strategy for safely investing a 401(k) for maximum profit. Intermediate-term, investing with stock index tracking-ETFs (both their long and short varieties) is advanced. Short-term, stock index options occasionally offer extraordinary profit opportunities when the stock market is moving along its projected path.

Nothing is set in stone. Nor is the stock market's path of least resistance always known. More often than not, there are no stock index option positions recommended.


There's an easy way to boost your investment discipline...

Get Real-Time Trade Notification!
Thursday, August 14, 2008

Still More Gnashing of Teeth Before Market Melt Up Begins


It is painfully evident the stock market's present buoyancy has less to do with renewed interest in owning equities than it does a seeming lack of will to collectively sell at the current moment.

Whether one might think this is madness, given the fact credit market stress continues, is irrelevant. The lack of any concerted, fear-filled sense of urgency to sell and possibly precipitate a panic probably is a telling sign ... at least by some relevant measure anyway.

Needless to say ... of all people who are keenly aware of lurking, grave danger at the credit juice bar, we should be the least bit surprised once the market melts up as I suspect it will ... in the not too distant future.

However, I am not about to read too much into the market's present resistance to playing its traditional role as a forward-looking indicator. It might still be "business as usual" at CNBC, but the ruse the Bank of England's largest OTC derivatives junkie just pulled is bound to bring new meaning to "Mad Money."

Vain attempts to buttress a sense there is no longer much to worry about — which fantasy its purveyor's fear can only be exposed when eyes are turned away ... revealing just how so-called pillars of finance cowardly fess up — is not the kind of behavior breeding confidence, and stand as a clarion call to Dow 3600 sometime over the next 3-5 years.

Fine, you say, but what about right now?

Well, maybe the combination of $3.5 trillion sitting in money market accounts and a decidedly bearish sentiment among investment newsletter writers is enough to engender a mad dash from one sector to the next ... in spite of terribly persistent credit market risks.


Investors Intelligence

Still, I cannot give too much credence to the growing hoard of sideline cash. It has been building for some time, and as I have said before, Maria, it is there for good reason.

One might also say the same for present bearish sentiment. This, too, relatively speaking, has been persisting for quite some time. In fact, more or less all year..

Note how at the May peak there were fewer than three bullish investment newsletter writers for every two who were bearish. Still the market sank, resulting in most major indexes taking out respective lows set on March 17, 2008. Who is to say an even lower ratio might not become a self-fulfilling prophesy, then?

All I know is further wave of selling taking out July's lows remains a high probability. In fact, I am sure of it, Cramer. Once it is over, then you can have your "Bull Run."

The only thing presently defying certain discernment is just how Monsieur Market might fall. Will it be a slow, maddening drop, further manifesting the gnashing of teeth sentiment I thought possible a couple months ago (after assuming a 1987-like crash event probably was off the table) ... or will the next leg lower unfold rather quickly?

At this point I prefer assuming the former possibility rather than the latter.


$NYA

I am assuming the NYSE Composite's ultimate bottom lies not much further below its July low. The vicinity of 7600 has been its target for months now. This is where it remains.

The present period is beginning to look just as similar to what followed the January '08 bottom as it does December '07. Up until now I have been considering this latter similarity as being more indicative of what probably is to come ... thinking bottom might arrive sooner rather than later, and with all haste given cyclical considerations discussed yesterday.

However, a sharp break lower simply has not been forthcoming. So, maybe death by a thousand cuts lasting into October and resulting in all manner of technical divergences further heightening the likelihood of the subsequent melt-up I am expecting will be the way things proceed.

Bottom line the NYSE Composite has not yet bottomed. Soon enough it is likely to fall and take out its July 15, 2008 low. Again, just how the move lower might unfold I cannot say.

Right now, a move up to the 50-day moving average might be in order before the NYSE Composite turns lower and finally completes its multi-month consolidation. Furthermore, the trip to bottom might once again bring rotation back into NYSE-listed stocks and hit NASDAQ relatively harder...


$COMPQ

I wish I had sooner seen developments unfolding in the NASDAQ Composite as shown here.

First, consider the move down in November '07 ... up to the bounce in December '07. Note how this decline is much like the larger drop from the same starting point to the March '08 low.

Now, consider the bounce subsequent to each decline. The "like from like" similarity is uncanny. Here, too, we see the NASDAQ Composite presently appearing much like it did in December '07.

Does this imply NASDAQ is near to being throttled? Again, I don't know. I rather think not ... despite being quite sure the March '08 low will be taken out sometime over the weeks ahead.

If only I had seen this coming. I probably would not have so soon positioned myself strongly on the Put side. I am not happy about this misfortune. Still, I have little doubt this gaff soon enough will be atoned...


* * * * *

© The Risk Averse Alert — Advocating a patient, disciplined approach to stock market investing. Overriding objective is limiting financial risk. Minimizing investment capital loss is a priority.

Analysis centers on the stock market's path of least resistance. Long-term, this drives a simple strategy for safely investing a 401(k) for maximum profit. Intermediate-term, investing with stock index tracking-ETFs (both their long and short varieties) is advanced. Short-term, stock index options occasionally offer extraordinary profit opportunities when the stock market is moving along its projected path.

Nothing is set in stone. Nor is the stock market's path of least resistance always known. More often than not, there are no stock index option positions recommended.


There's an easy way to boost your investment discipline...

Get Real-Time Trade Notification!

Wednesday, August 13, 2008

Going for the Gold in Stock Market Cycling Event


Back in May I raised the possibility suggesting a 1987-like crash might unfold. This was in keeping with analysis indicating a capitulation had yet to develop since last year's Q3 peak. More critically, though, an easily arrived-at Elliott Wave view heightened the probability lows set on March 17, 2008 were only a temporary resting point ... rather than termination of the stock market's multi-month correction of gains made from 2002-2007.

But within a matter of only a couple weeks I backed away from supposing a 1987-like crash might usher in the market's capitulation, instead believing this less likely given developments over the interim.

One reason why I changed my mind so quickly had to do with certain cyclical guideposts within my analytical repertoire. One is the decennial cycle and the other is the presidential-term cycle.

(Bear in mind I generally give cyclical considerations a back seat to other, less arbitrary technical measures I would argue are more complementary to Elliott Wave analysis.)

Combined, these two cycles suggest an upward bias in the stock market during the second half of '08. Thus, it seemed reasonable to assume the further past mid-year we moved, a decidedly negative outlook anticipating a crash event might not be well-advised. So, my sense back in May-June '08 was a crash would either unfold immediately, while these two particular cycles were only beginning to rise in unison, or it would not develop at all.

Now, although I concluded a crash event was unlikely soon after I had raised the possibility, I did not back away one bit from the 70% probability I had given to the likelihood March '08 lows would be taken out. In other words, a sell-off reflecting capitulation still was in the cards.

Elliott Wave possibilities supportive of further selling ... plus underlying technical conditions indicative of a climate conducive to weakness ... alone formed my expectation for a declining stock market in which some substantive demonstration of capitulation might be expected. This view I held despite contrary cyclical considerations.

However, whether what subsequently developed from May 19, 2008 - July 15, 2008 qualifies as the full manifestation of what I had anticipated is rather doubtful. Yes, there are some things one could cite as indicative of capitulation. But the evidence does not at all seem conclusive. That is why I rather expect still further selling before a bottom finally is in place.

So, it turns out cyclical considerations have proven pernicious to the low-risk, stock index options play I thought possible. This is all the more apparent now that the S&P 100 has taken out its March 17, 2008 low. The effect on underlying volatility has been a real bear (no pun intended), particularly given my determination to risk just $500.

In comparison the year 2002 (the last time I forecast a low-risk options trading opportunity) was a breeze. I just did not miss a single twist or turn. However, volatility I expected then actually materialized, which is more than I can say presently.


$OEX

The unfolding form the S&P 100 has traced since its July 15, 2008 low is, without a doubt, consolidating losses incurred since its May 19, 2008 peak. However, just how much longer this consolidation might persist is a rather frustrating mystery. Indeed, it could be over already. Then again, though, some undetermined number of days might pass before the final turn lower unfolds.

Given the cyclical considerations I mentioned above, there is reason to suspect any imminent sell-off (should this in fact be in store) might develop rather quickly ... and then rapidly reverse as the market embarks on its anticipated melt-up.

But then again, what possibility is there of something slightly different developing? Could the S&P 100's July 15th low be taken out by way of a decline best described as death by a thousand cuts ... unfolding over several weeks time ... resulting in a new low ... bottoming in the 520ish area? Might the rather unexpected, reduced-volatility decline from May 19, 2008 - July 15, 2008 indeed be forecasting this development? Would this not be fitting present cyclical considerations? Do you think just because cycles are rising, this necessarily implies the market cannot be slowly bled?

Remember, the trend is your friend ... and we might conclude a "slow bleed" has been the market's trend for quite some time now ... even prior to last year's peak when NASDAQ enters the picture.

Bottom line, I already have a post-it with a big, red L ready for Cramer once July 15th's low is taken out. As much as certainty is possible in this game, I am certain this post-it will be mailed out. Despite having been at this only a few years less than he has, I simply am astonished by how he persists in calling July 15th "bottom."


[5:00 p.m.]
Just another trading day defying gravity ... treading in mid-air ... going nowhere. The buoyancy we are witnessing seems to suggest the market might not soon embark on the sharp move lower I have been supposing would end its consolidation of gains made from 2002-2007. However, I am not willing to bet the house on this.

I submit the relatively directionless (and seemingly endless!) sector rotation we are seeing supports the broader view I hold. To whit...

Given the form this rotation is taking — more positively affecting the most beaten up sectors — we have evidence that, once this runs its course, a general recognition of there being no compelling fundamental basis for holding stocks in these sectors probably will evolve, and a resumption of the market's negative trend likely will develop. This, then, supports my outlook toward the market's July 15th low, with Elliott Wave considerations making the case bottom is not yet in place.

Furthermore, given the fact this rotation is occurring such as it is — applying drops of cash from the sea of liquidity sitting in money market funds to the task of buying stocks technically poised for a trading bounce — we have evidence of "animal spirits" necessary for launching the stock market into a spectacular melt-up. Elliott Wave considerations similarly support this distinct possibility, once bottom finally has been established.


NYSE 5-min

Today's bounce in the NYSE Composite was a lot like last Friday's. There really was no substantive RSI divergence raising the probability of a sizable rally off today's low. Rather, the turn higher might be better rationalized with a view toward NASDAQ...


NASDAQ 5-min

Gains made from Monday to Monday, 8.4.08 - 8.11.08, are holding on NASDAQ ... unlike the Big Board. Despite negative RSI since Monday's top, and despite there again being no evident RSI divergence leading into today's turn higher, the fact no selling urgency has yet to develop in secondaries might be all the reason the bid came into NYSE listed stocks once the NYSE Composite touched its floor of the past week or so.


OEX 5-min

It's a long way to Tipperary (OEX 560), but the S&P 100's late-day turn lower with RSI positioned in a way that's conducive to further selling lends hope for the blessed moment I thought would be here long before now. Truly, the wait has been sheer torture...

* * * * *

© The Risk Averse Alert — Advocating a patient, disciplined approach to stock market investing. Overriding objective is limiting financial risk. Minimizing investment capital loss is a priority.

Analysis centers on the stock market's path of least resistance. Long-term, this drives a simple strategy for safely investing a 401(k) for maximum profit. Intermediate-term, investing with stock index tracking-ETFs (both their long and short varieties) is advanced. Short-term, stock index options occasionally offer extraordinary profit opportunities when the stock market is moving along its projected path.

Nothing is set in stone. Nor is the stock market's path of least resistance always known. More often than not, there are no stock index option positions recommended.


There's an easy way to boost your investment discipline...

Get Real-Time Trade Notification!