Friday, September 28, 2012

Crowning IBM the King of Fake

Here is what motivated yesterday's perspective raising prospect a major top is in sight. It begins with "Big Blue"—IBM...


A few years back, amidst a different, index-driven Elliott wave-based view forward, the wave count indicated above was thought a good possibility. At the time IBM had corrected approximately 61.8% of its 2008-2009 loss and appeared well-poised for the grande finale of its corrective wave forming since its 1999 top. However, July 2009's broadly influential, massive short squeeze served to put IBM on a different course in forming this corrective wave. Rather than having already completed wave B, turns out this wave still was in the midst of forming...


Unfolding off IBM's 2002 bottom is but a larger, 5-3-5 "zig-zag" than that previous thought, which nevertheless still is alternating from the 3-3-5 "flat" forming off IBM's 1999 peak completing in 2002. Whether wave (c) of B reached its peak in March of this year remains to be seen, but making this a good possibility is the fact that, IBM was not one of the NYSE-listed issues counted among the sudden, out-of-the-blue explosion of issues reaching new 52-week highs earlier this month. A sea of central bank provided liquidity notwithstanding, apparently there's only so much fake to go around. Judging by volume here, too, "fake" is no exaggerated summary of the impetus behind IBM's surge these past few years.

Given yesterday's Elliott wave-based proposition suggesting the 4th and 5th waves of a "rising wedge" forming wave (c) of B in major indexes still are slated to unfold over weeks ahead, IBM, rather than in kind continuing its advance, could be among issues showing first signs of weakness.

This possibility leads to wondering about prospect for a more broad-based, first sign of weakness that could (more likely "should") be displayed vis-a-vis the NYSE's cumulative advance-decline line coinciding with completion of wave (c) of B. Long established is the fact that, were the NYSE Composite Index tracking its cumulative advance-decline line, its print probably would be close to double today's. That the Composite Index lags so badly is but more testament to an entirely "fake" impetus behind the market's advance since March '09 bottom. Prospect that a "rising wedge" is unfolding to form wave (c) of B, then, would be more effectively confirmed should the NYSE cumulative advance-decline line, on its own account, begin to present a broad-based first sign of weakness during formation of the rising wedge's 4th and 5th waves.

IBM being among post-March '09 bottom leaders with a good chance of diverging from the broad market from this point forward, there are other "issues," more aptly called "garbage," whose performance since March '09 defies "fake" because what's dragging it down is destined to become the little engine that could, instead of the "headwind"—the heavy caboose—it contrarily seems more widely perceived today...


The pain in Spain will be IBM's bane. And by no means will this stock alone be suffering the euro Ponzi scheme's collapse. For all intents and purposes every stock will suffer in ways too few today dare imagine.

(Duly note the "holding on for dear life" phenomena displayed during $EWP's lift off its March '09 bottom via the volume of shares exchanged over the interim of its subsequent advance. We'll be seeing a similar, failed consequence more broadly once major U.S. indexes peak sometime over the weeks and months ahead.)


Fast Money
* * * * *
© The Risk Averse Alert — Advocating a patient, disciplined approach to stock market investing. Overriding objective is limiting financial risk. Minimizing investment capital loss is a priority.

Analysis centers on the stock market's path of least resistance. Long-term, this drives a simple strategy for safely investing a 401(k) for maximum profit. Intermediate-term, investing with stock index tracking-ETFs (both their long and short varieties) is advanced. Short-term, stock index options occasionally offer extraordinary profit opportunities when the stock market is moving along its projected path.

Nothing is set in stone. Nor is the stock market's path of least resistance always known. More often than not, there are no stock index option positions recommended.


There's an easy way to boost your investment discipline...

Get Real-Time Trade Notification!

Thursday, September 27, 2012

New Wave Count Brings Major Top in Sight

Drum roll ... and yet another possible Elliott wave count for your consideration. This one is purposely applied to the NYSE Composite Index (instead of the S&P 500) because, while it curiously lags all other major indexes, noteworthy underlying evidence otherwise supporting this wave count combines to increase probability this could be the right view. As such, we could be a lot closer to completion of the market's counter-trend rally since March 2009 than heretofore has been assumed via the other Elliott wave count possibilities presented here over the past couple weeks detailing a 5-3-5 "zig-zag" forming off March '09 bottom...


Still keeping with the "zig-zag" prospect, here we see its "b" wave completing early October 2011. Unfolding ever since is the zig-zag's "c" wave taking the form of a so-called "diagonal triangle" (this was the term used in the 6th edition of the Elliott Wave Principle), otherwise called a "rising wedge" (which term I prefer). This is a "special" Elliott wave form because each of its five component waves subdivide into threes (i.e. a-b-c). Normally a 5-wave form subdivides in a 5-3-5-3-5 manner, rather than 3-3-3-3-3, as is the case with a "rising wedge." One defining characteristic of a "diagonal triangle" is it always will appear in the final wave in the direction of the main trend. Thus, this special Elliott wave form will appear only in the position of a 5th wave or a "c" wave. Here we see it prospectively developing to form wave (c) of B. The other defining characteristic of a "diagonal triangle" is it typically follows a move that traveled "too far too fast." Wave (a) of B off March '09 bottom certainly qualifies as such.

Suddenly, now, September's out-of-the-blue explosion of NYSE-listed issues hitting new 52-week highs meets a most fitting Elliott wave count. After having been diminishing for months on end since early 2010, this as the market continued its upward bias, we find this measure surging coincident with formation of a third wave of a third wave of a third wave of a third wave: specifically, wave c of iii of 3 of (c). Hmmm. Interesting. All the more is the fact that, every month but one over the past twelve months has resulted in a positive return. So here, too, that most major indexes have risen during eleven of the past twelve months likewise qualifies as circumstance representative of a third wave's typical dynamism—wave (c) being the third wave of the zig-zag up from March '09 bottom.

Although it is not necessary that, wave c of 3 of (c) bring one final move higher to complete an a-b-c up from early June (as suggested above)—see the wave count applied to the S&P 500 a couple weeks back, wherein I suggested an a-b-c up from early June might have completed on September 14th—the probability seems likely, as a relative strength and/or momentum divergence more often than not will register at turning points. Given decided strength both measures have displayed over the past 3-4 months (this being coincident circumstance likewise confirming the above wave count, this by how the two measures mutually display typical third wave "dynamism"), it seems reasonable to expect some first sign of technical weakening prior to formation of wave 4 of (c). So, don't be surprised if the market moves still higher over coming days before succumbing to a bout of selling that, otherwise is seen in order on account of technical circumstance presented here over recent days.


Fast Money
* * * * *
© The Risk Averse Alert — Advocating a patient, disciplined approach to stock market investing. Overriding objective is limiting financial risk. Minimizing investment capital loss is a priority.

Analysis centers on the stock market's path of least resistance. Long-term, this drives a simple strategy for safely investing a 401(k) for maximum profit. Intermediate-term, investing with stock index tracking-ETFs (both their long and short varieties) is advanced. Short-term, stock index options occasionally offer extraordinary profit opportunities when the stock market is moving along its projected path.

Nothing is set in stone. Nor is the stock market's path of least resistance always known. More often than not, there are no stock index option positions recommended.


There's an easy way to boost your investment discipline...

Get Real-Time Trade Notification!

Wednesday, September 26, 2012

October Beating With a Bat Out of Hell

More circumstantial evidence with precedent in the period leading up to the flash crash of May 6, 2010 that likewise presents a curious cyclical component suggesting a difficult October could be on tap...


$VIX

One thing certain is VIX momentum (see bottom panel) turning positive consistently has coincided with weakness in the market's post-March '09 bottom, counter-trend rally period. Considering how low VIX presently is, and this in the face of a euro-zone very much appearing on the verge of imploding, how central banks already "all in" can possibly coax an even deeper degree of complacency among equity bulls is for trapped weak hands to prove at a moment when their apparent willingness and/or capacity to add to their stakes has long been conclusively revealed challenged (this being the story told by diminishing volume over the entire duration of the market's counter-trend rally off March '09 bottom).

Now, although the current state of the Volatility Index by no means assures the market is on course for a trip to heartbreak hotel, all things considered the odds appear anything but slim. Further raising prospect for a vicious October is the Fibonacci-based cyclical curiosity I have indicated above, each instance connecting market bottoms to subsequent volatility peaks. So, it looks like the month of October might bring flight to a bat out of hell...


Fast Money
* * * * *
© The Risk Averse Alert — Advocating a patient, disciplined approach to stock market investing. Overriding objective is limiting financial risk. Minimizing investment capital loss is a priority.

Analysis centers on the stock market's path of least resistance. Long-term, this drives a simple strategy for safely investing a 401(k) for maximum profit. Intermediate-term, investing with stock index tracking-ETFs (both their long and short varieties) is advanced. Short-term, stock index options occasionally offer extraordinary profit opportunities when the stock market is moving along its projected path.

Nothing is set in stone. Nor is the stock market's path of least resistance always known. More often than not, there are no stock index option positions recommended.


There's an easy way to boost your investment discipline...

Get Real-Time Trade Notification!
Tuesday, September 25, 2012

Only a Few Days Calm Before the Storm

Although it might be too early to insist today's fairly decided turn down confirms a sharp move lower likely has commenced, the fact of the matter is this could be the case. There's precedent, too, supporting this possibility...


It has been a couple years since the market has turned down on a dime. Rather, negative technical divergences accompanying index peaks typically have preceded any decline of substantial magnitude over the past 2+ years. Looking back further, though, there's April 2010 peak standing out as a beacon.

Relative strength (top panel) confirmed the market's move higher off early February 2010 bottom every step of the way right up to April 2010 peak. Ditto momentum (bottom panel). All this notwithstanding, there were no negative divergences registered per these two technical measures prior to the lug nuts falling off early May 2010. Indeed, per momentum we find a similar situation now versus then. Likewise, relative strength's sharp turn away from peak.

Chances are, unless Europe implodes immediately (this being a possibility, as I believe it is in any case about to—too much silence from Team Fraud's captive media in the face of historic social upheaval only suggests oligarchs, soon-to-be wiped out by an unprecedented hyperinflationary blowout, are having a "Depends" moment), it otherwise seems likely every humanly possible effort to milk this moment before the feces hits the fan at least will bring a retest of the peak set earlier this month, much like occurred during the latter half of April 2010. So, look forward to a few days of calm before the storm.


Fast Money
* * * * *
© The Risk Averse Alert — Advocating a patient, disciplined approach to stock market investing. Overriding objective is limiting financial risk. Minimizing investment capital loss is a priority.

Analysis centers on the stock market's path of least resistance. Long-term, this drives a simple strategy for safely investing a 401(k) for maximum profit. Intermediate-term, investing with stock index tracking-ETFs (both their long and short varieties) is advanced. Short-term, stock index options occasionally offer extraordinary profit opportunities when the stock market is moving along its projected path.

Nothing is set in stone. Nor is the stock market's path of least resistance always known. More often than not, there are no stock index option positions recommended.


There's an easy way to boost your investment discipline...

Get Real-Time Trade Notification!
Monday, September 24, 2012

Bailout For a Civil War Threat?

Pardon me for questioning bailout junkie expectations, but a Spanish default forcing a debt write down bringing the trans-Atlantic banking system to its next "Lehman moment" might be at hand. One has to imagine conditions in Spain are near spiraling out of control given news this weekend that, the Autonomous Region of Catalonia is threatening secession. This cannot be sitting well with a Troika possessing no military to enforce its terms of surrender to the Brussels Reichsbank. Bailout requires docile sovereign institutions from the top-down imposing surrender to the Fuehrer's murderous conditions. Apparently the "wisdom" of austerity endured for the sake of propping up insolvent thieves is not homogeneously subscribed to throughout Spain's political establishment.

So, transition to expanding chaos might be about to commence, bringing unprecedented volatility to financial markets. If so, then hyperinflationary madness is likely to move into overdrive, only further quickening the pace of the physical economy's shutdown. Confusion sown as a result in all probability will be off the charts.


Bailout fail leading to debt write down no doubt would entail a mad scramble for capital, while central banks do what they must to continue propping up the banking system and faking its solvency. Ensuing chaos further crushing credit market confidence could put core debt securities on course to experiencing an historic jolt reversing the decades-running bond bull market. As counter-intuitive as it might seem in an increasingly chaotic environment, gold could be in for a beating. Technically speaking, this likelihood quite appears in the realm of possibility. Yet whether subsequent to spot gold's prospective swoon new record highs still might be in the offing is a question better pondered with more certain sense of circumstance following a credit market convulsion whose likelihood is increasing as Europe's ever-widening insolvency appears on the verge of spiraling out of control.

Per the impact on the stock market resulting from an imminent scramble for capital, the alternate wave count put forward Friday might find wave c of the second "three" of wave (b) of B promptly unfolding and bringing the S&P 500 to retest its rising trend line off 1974 bottom. Then again, upcoming might still find wave c of a of the second "three" of wave (b) of B unfolding (much as was my preferred view Friday), while likewise bringing retest of the S&P 500's rising trend line off 1974 bottom and setting up over the period following a full display of the Elliott Wave Principle's "alternation guideline" as waves b and c of the second "three" of wave (b) of B subsequently develop.


Fast Money
* * * * *
© The Risk Averse Alert — Advocating a patient, disciplined approach to stock market investing. Overriding objective is limiting financial risk. Minimizing investment capital loss is a priority.

Analysis centers on the stock market's path of least resistance. Long-term, this drives a simple strategy for safely investing a 401(k) for maximum profit. Intermediate-term, investing with stock index tracking-ETFs (both their long and short varieties) is advanced. Short-term, stock index options occasionally offer extraordinary profit opportunities when the stock market is moving along its projected path.

Nothing is set in stone. Nor is the stock market's path of least resistance always known. More often than not, there are no stock index option positions recommended.


There's an easy way to boost your investment discipline...

Get Real-Time Trade Notification!

Friday, September 21, 2012

Time For a Break

Here is yet another Elliott wave count venturing to label the component waves of wave (b) of B—this forming the middle wave of an a-b-c "zig-zag" up from March '09 bottom...


Everything up to early-October 2011 bottom is the same old, same old. From that point, though, the above, alternate view takes form. Inspiring this wave count is the evolution of the S&P 500's coincident momentum (see bottom panel). There we see noteworthy similarity to developments prior to and during formation of the 3-3-5 "irregular flat" kicking off wave (b) of B in February 2011.

Now, the 5-3-5 "zig-zag" up from early-October 2011 bottom forming wave x is perfectly copacetic with the Elliott Wave Principle's rules and guidelines. According to this tome's 6th edition (which I more or less have committed to memory since purchasing it in 1986), a connecting "x" wave can be "any three" (i.e. a "zig-zag" or a "flat"). So, we're good there.

"Trouble" (or, more aptly, "concern") enters into the picture subsequent to completion of the connecting wave x in March 2012. Being that formation of wave (b) of B began in February 2011 with the development of a 3-3-5 "irregular flat" forming the 1st "three" of wave (b) of B, the Elliott Wave Principle's "alternation guideline" suggests the 2nd "three" of wave (b) of B (this unfolding subsequent to completion of the connecting "x" wave) likely will be a 5-3-5 "zig-zag." Yet that is not what has been developing since connecting wave x completed in March 2012. This is not at all a problem, though, as "alternation" might be developing in a different manner here.

Since March 2012 completion of connecting wave x I have indicated two prospective wave counts developing, one labeled in black and the other in red. My preference right now is the red, as this could set up the second "three" of wave (b) of B to unfold in a manner rather more fully satisfying the Elliott Wave Principle's alternation guideline.

First, consider how the first "three" of wave (b) of B (i.e. the 3-3-5 "flat" unfolding from February-October 2011) developed in simple-to-complex fashion. Wave a was a simple 5-3-5 "zig-zag," while wave b was a more complex 3-3-5 "flat." Obviously, during formation of wave a the peak from which this wave down began never was exceeded. This distinction did not occur until wave b took form off March 2011 bottom.

Contrast this to the wave count indicated above in red detailing the component waves of wave a of the second "three" of wave (b) of B. It certainly is alternating from wave a of the first "three," this both in its complexity, as well as its development in relation to the peak from which it began. This suggests that, once wave a of the second "three" completes, wave b might not result in the S&P 500 reaching a new peak. This, too, should it occur, would represent another manner of alternation from wave b of the first "three" of wave (b) of B. Indeed, such a development might better be expected. Likewise, seeing wave a of the second "three" developing in a rather complex fashion to form a 3-3-5 "irregular flat" (itself appearing to unfold in complex-to-simple fashion), wave b of the second "three" thus is likely to develop in simple fashion (i.e. a simple 5-3-5 "zig-zag" higher). This, again, would present another manner of alternation from wave b of the first "three" forming wave (b) of B. as well as raise prospect the second "three" forms in complex-to-simple fashion in alternation to the first "three."

Straight ahead should bring wave c of a lower. This seems likely to retest a well-established line of support whose presence in the S&P 500 was detailed Wednesday. The five component waves forming wave c could unfold fairly rapidly and complete sometime in October. Preceding the bulk of this anticipated move lower (i.e. prior to its 3rd wave) we should see developing various technical indications heightening any sharp decline's likelihood. I'll keep you posted.


Fast Money
* * * * *
© The Risk Averse Alert — Advocating a patient, disciplined approach to stock market investing. Overriding objective is limiting financial risk. Minimizing investment capital loss is a priority.

Analysis centers on the stock market's path of least resistance. Long-term, this drives a simple strategy for safely investing a 401(k) for maximum profit. Intermediate-term, investing with stock index tracking-ETFs (both their long and short varieties) is advanced. Short-term, stock index options occasionally offer extraordinary profit opportunities when the stock market is moving along its projected path.

Nothing is set in stone. Nor is the stock market's path of least resistance always known. More often than not, there are no stock index option positions recommended.


There's an easy way to boost your investment discipline...

Get Real-Time Trade Notification!

Thursday, September 20, 2012

Do Panicked Central Banks Signal B Wave Alternation?

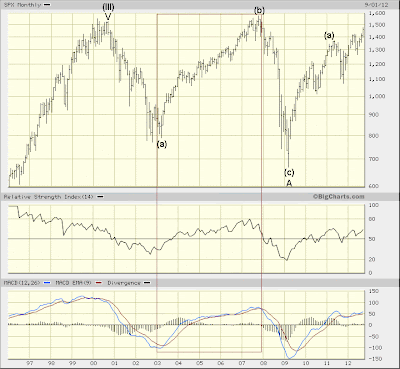
Keying in on the Elliott corrective wave forming since Y2k—this countering (i.e. "correcting") five waves up from 1932—we find opportunity to make certain assumptions about the presently forming wave B up from March '09 bottom, this unfolding as a 5-3-5 "zig-zag" and alternating from the 3-3-5 "flat" forming wave A down from Y2k top. To wit, comparing wave (b) of A (unfolding from 2003 to 2007) to wave B up from March '09 bottom—both forming a 5-3-5 "zig-zag" higher—we might reasonably set expectations of what is to come.


$SPX monthly

Being that wave B is one higher degree than wave (b) of A (i.e. a like wave of larger magnitude), we might expect its component waves to reflect a technical character emblematic of this fact. Already, in formation of wave (a) of B we see both the S&P 500's monthly RSI and MACD exceeding the same measures registered when wave a of (b) of A off March '03 bottom completed in January 2004. Likewise, in formation of wave (b) of B thus far both measures have registered a greater degree of weakness than was displayed during formation of wave b of (b) of A (this forming from Q1 '04 to Q4 '05).

Now, one thing to wonder here is whether wave (b) of B will be "like" wave b of (b) of A in its upward bias, or whether it might instead alternate and, upon its completion, display a distinct downward bias. Up to now wave (b) of B rather is forming much "like" wave b of (b) of A, similarly unfolding with an upward bias so far. Yet unlike the technical situation when wave (b) of A began unfolding off March '03 bottom, significant negative technical divergences and confirmations were registered going into March '09 bottom prior to the commencement of wave B higher. Both the S&P 500's monthly RSI and MACD diverged when the S&P 500 reached a nominal new high in 2007 (this versus their respective best readings going into the S&P 500's Y2k peak). Likewise, both measures confirmed the S&P 500's lower low reached upon completion of wave (c) of A, this versus wave (a) of A. Thus, a weakening technical backdrop might prove decisive in leading currently unfolding wave (b) of B to alternate from the upward bias the S&P 500 displayed during formation of wave b of (b) of A. Indeed, given a well-established, weakening technical backdrop, it seems entirely reasonable to expect wave (b) of B to register a good deal more technical weakness than coincided with formation of wave b of (b) of A, and in the end display a decided downward bias. Time will tell.


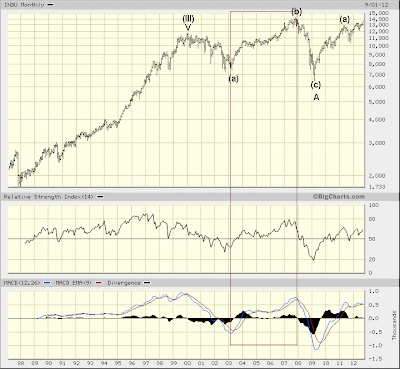
$INDU monthly

The Dow Jones Industrials Average very much presents the same picture as the S&P 500 per technical developments since Y2k. I wanted to include this here because in formation of wave (b) of A the Dow Jones Industrials Average significantly eclipsed its Y2k peak. Entirely within the realm of possibility at the present moment is prospect that wave B eventually might find the Dow's 2007 peak similarly eclipsed to some significant degree sometime over the next few years.

Likewise, just as wave (a) of B fell short of the Dow's 2007 peak, wave a of (b) of A also fell short of the Dow's Y2k peak. And just like was noted vis-a-vis the S&P 500, the component waves of the Dow's wave B off March '09 bottom are registering stronger coincident technical readings than those registering during formation of wave (b) of A, confirming it a wave of one larger degree.

Now, judging by how decidedly the Dow Jones Industrials Average's monthly RSI and MACD diverged upon the Dow reaching its 2007 peak (this versus respective best readings going into the Dow's Y2k peak) and seeing how near both measures currently are to their respective readings going into the Dow's 2007 peak, bolstered seems the case for suspecting the market might suffer a fairly steep hit in formation of presently unfolding wave (b) of B, this ultimately leading it to form with a decided downward bias and alternate from the upward bias displayed during formation of wave b of (b) of A. The same negative technical divergences and confirmations as the S&P 500 registered going into its March '09 bottom likewise set up the Dow Jones Industrials Average for a considerable bout of weakness as its wave (b) of B further develops and completes.

Again, time will tell. One thing worth noting here is that, unlike the case in the 2004-2005 period when wave b of (b) of A was forming, the Fuehrer's EMU and euro debt trap swindle today is gravely threatening the present day's concerted, open-ended, [lilliputian] central bank backstop and, more critically, is running out of viable national treasuries which to hit up for debt securities needed to paper over the trans-Atlantic banking system's still growing, gaping hole of insolvent garbage. All the more reason, then, to suspect wave (b) of B likely will display a downward bias and, as such, notably alternate from wave b of (b) of A.


Fast Money
* * * * *
© The Risk Averse Alert — Advocating a patient, disciplined approach to stock market investing. Overriding objective is limiting financial risk. Minimizing investment capital loss is a priority.

Analysis centers on the stock market's path of least resistance. Long-term, this drives a simple strategy for safely investing a 401(k) for maximum profit. Intermediate-term, investing with stock index tracking-ETFs (both their long and short varieties) is advanced. Short-term, stock index options occasionally offer extraordinary profit opportunities when the stock market is moving along its projected path.

Nothing is set in stone. Nor is the stock market's path of least resistance always known. More often than not, there are no stock index option positions recommended.


There's an easy way to boost your investment discipline...

Get Real-Time Trade Notification!

Wednesday, September 19, 2012

Insolvent Albatrosses All In

With technical measures detailed here over the past two days rather suggesting the market is likely to spend some time forming a top before turning over, the following returns to prospect that 5 waves up from June 2012 bottom will complete an a-b-c "zig-zag" up from October 2011. Once this "zig-zag" higher completes, 5 waves down taking out last year's low could follow. I say "could" because there are other possibilities. Among these is prospect the presently forming middle wave of an a-b-c "zig-zag" up from March '09 bottom — this developing since February 2011 — could evolve in a more complex fashion (i.e. a "double-" or "triple-three," or a "triangle") and likewise hold major indexes above the well-established line of support indicated below.


The above, simple 3-3-5 "flat" projected to form wave (b) of B since February 2011 targets the vicinity of the S&P 500's rising trend line off its 1974 bottom. This trend line was touched in March '09 when wave (c) of A completed, and stands to provide support again during formation of wave (b) of B. Should this trend line's retest not occur during the market's upcoming decline, while at the same time the line of support indicated above likewise holds, then there probably will be a good case for assuming wave (b) of B will take a more complex form than the simple 3-3-5 "flat" indicated above. Still, at some later point in the development of wave (b) of B the S&P 500's rising trend line off its 1974 bottom probably will be retested.

Particularly relevant right now, I think, is the juicy tidbit Mark Hulbert revealed during tonight's "Fast Money" broadcast. Apparently, all but 1.9% of stocks in the S&P 1500 (combining large caps, mid caps and small caps) are rated by Wall Street analysts as a "hold" or higher. Hulbert called this an incredible statistic. Considered in the context of persistently diminishing volume registering as major indexes are squeezed higher, it certainly suggests hopelessly insolvent vested interests are "all in" — like I have been saying, hanging on for dear life. Thus could circumstance be conducive to a collapse like that indicated above, taking out 2011 lows and setting up for a "God, save our sinking ship," panic-driven short squeeze positively dwarfing last October's. Endless liquidity central banks are committed to throwing at an insolvent banking system only heightens the possibility that, still-to-come wave (c) of B higher could prove both short-lived and simply spectacular.


Fast Money
* * * * *
© The Risk Averse Alert — Advocating a patient, disciplined approach to stock market investing. Overriding objective is limiting financial risk. Minimizing investment capital loss is a priority.

Analysis centers on the stock market's path of least resistance. Long-term, this drives a simple strategy for safely investing a 401(k) for maximum profit. Intermediate-term, investing with stock index tracking-ETFs (both their long and short varieties) is advanced. Short-term, stock index options occasionally offer extraordinary profit opportunities when the stock market is moving along its projected path.

Nothing is set in stone. Nor is the stock market's path of least resistance always known. More often than not, there are no stock index option positions recommended.


There's an easy way to boost your investment discipline...

Get Real-Time Trade Notification!

Tuesday, September 18, 2012

Still Garbage All the Same

Closer inspection of raw NYSE advance-decline data underlying the McClellan Oscillator presented yesterday certainly substantiates that "something's not right" character typical of Elliott "b" waves. Specifically, wave b of (b) thought forming since early October 2011 finds coincident NYSE advance-decline readings confirming that, fading conviction in fact is underlying the market's continued levitation.


We see this going into March 2012 peak, as well as over the duration of the market's advance since late July. Thus, massive short squeezes of October 2011 and June 2012 are better seen for what they are: trapped weak hands exploiting well-established means for buying time and slowly dripping their garbage to a segment of vested interests (mutual fund managers, pension managers, etc.) whose imperative is to put cash to work. From now until completion of an a-b-c Elliott "zig-zag" up from March '09 bottom occurring sometime over the next few years we are likely to see this same dynamic play out again and again.


Just to confirm we are dealing with garbage slowly but surely being distributed from weak hands to suckers (be they witting or just mandated via a fund prospectus as such), the market's ever so slight pullback of the past couple days should not be having such a profound impact on those issues leading the market's levitation. Were stocks instead being accumulated, it's unlikely those issues leading the market's advance would so decidedly become soft in unison.

So, underlying the market's continued levitation is the same old, same old contrived rally founded on weak hands holding onto their garbage for dear life, mindful how any serious break in the market might sooner bring their literal extinction.Thus, when wave c of (b) unfolds sometime over coming months and sinks major indexes below respective 2011 lows, we should be prepared for a "God, save our sinking ship" short squeeze making last October's look like child's play.


Fast Money
* * * * *

© The Risk Averse Alert — Advocating a patient, disciplined approach to stock market investing. Overriding objective is limiting financial risk. Minimizing investment capital loss is a priority.

Analysis centers on the stock market's path of least resistance. Long-term, this drives a simple strategy for safely investing a 401(k) for maximum profit. Intermediate-term, investing with stock index tracking-ETFs (both their long and short varieties) is advanced. Short-term, stock index options occasionally offer extraordinary profit opportunities when the stock market is moving along its projected path.

Nothing is set in stone. Nor is the stock market's path of least resistance always known. More often than not, there are no stock index option positions recommended.


There's an easy way to boost your investment discipline...

Get Real-Time Trade Notification!

Monday, September 17, 2012

Technical Grounds for Rumor Mill Troubles

Some time spent forming a top appears likely on deck. Working NYSE McClellan data from the bottom up, you should get the picture...


NYSE McClellan

5% and 10% Index peaks (bottom panel) suggest a pause of some sort is likely at hand. Most notably, the Summation Index is badly diverging from the NYSE Composite Index's surge to a new 2012 peak. This is rather unlike mid-January. So, a seemingly imminent pause could bring considerable pressure, as the stable of ponies driving the market higher is dwindling. This is much like January and February this year (see McClellan Oscillator), yet in that prior instance, despite the same diminishing participation in the market's rally, the Summation Index was confirming the move, whereas presently it is not. Then, an emboldening conviction was displayed with money lifting a proportionately increasing swath of NYSE-listed issues as the NYSE Composite eclipsed its October 2011 peak. Now, contrarily, there are but many relative laggards in the midst of March 2012 peak being exceeded.

So, how does Team Fraud work the rumor mill to sucker higher these relatively trailing issues now that the promise of hyperinflationary juice from now to eternity is fulfilled? There's no more hope which to play up! The Fed has seized the gears of the rumor mill with its commitment to open-ended QE. This leaves today's mass psychosis ignoring hyperinflation's devastating effect in position to be rudely awakened, then. Shutdown—ever more dislocation—is all Bernice can deliver. Has risk of meltdown done anything but become more acute throughout the trans-Atlantic these past several years? Then there you have it. That's all the Fed is good for now. The legacy of the Greenspan era soldiers on.


Fast Money
* * * * *

© The Risk Averse Alert — Advocating a patient, disciplined approach to stock market investing. Overriding objective is limiting financial risk. Minimizing investment capital loss is a priority.

Analysis centers on the stock market's path of least resistance. Long-term, this drives a simple strategy for safely investing a 401(k) for maximum profit. Intermediate-term, investing with stock index tracking-ETFs (both their long and short varieties) is advanced. Short-term, stock index options occasionally offer extraordinary profit opportunities when the stock market is moving along its projected path.

Nothing is set in stone. Nor is the stock market's path of least resistance always known. More often than not, there are no stock index option positions recommended.


There's an easy way to boost your investment discipline...

Get Real-Time Trade Notification!

Friday, September 14, 2012

Transitioning to Expanded Physical Chaos


There's no shortage of technical evidence suggesting the Fed's just ventured counter-balance to doomed banking system assets at grave risk of sinking all too likely will be but short time bought before promised action is forced into overdrive, Wiemar 1923. Through a tearing eye behind the present day's wink and a smile does technical evidence reveal a perceived change coming, this exposed in truth finding still fewer who with their wallets are buying into belief the efficacy of the Fed's new, open-ended "commitment" will be proven rewarding to equities. Chances are we are likely to be hearing growing concern about the Fed's increasing insolvency risk, as those not yet convinced find religion in an endless flood's destructive promise. Implicitly, this concern has been raised with today's Egan-Jones downgrade of U.S. Treasury debt.

The world as we have known it is being forced to change in ways yet unimaginable to most. The approaching, opening salvo of a dreadful normal still finds insiders freeing capital, much as the past few years, and yet also apparently well along in staking new claims in a promised central bank deluge. Such is the story of still diminishing volume. Here, the adage that, "Prices can fall of their own weight, but it takes buying to put them up" remains as relevant as ever. Wave c of (b) lower, targeting a decades-running, rising trend line very much remains on the radar.

Now, recent years' steady accumulation of physical claims on raw materials now seem a likely candidate to soon become a principal object of a new bubble driven to the heavens by the present day's accelerated version of the same old, same old central bank panic. A shakedown of weak hands via wave c of (b) down, itself, then should be seen serving notice wave (c) of B higher is at hand, this riding the same old, same old asset-backed, leveraged-enhanced euphoria and completing an a-b-c "zig-zag" up from March '09 bottom. How else will the banking system's solvency be faked but through some perversion of a dying status quo? Do not central banks reveal desperation in their venture to revive this? Food and energy inflation appear a likely means of gaining increasing cash flows needed to sustain added leverage required to keep Team Fraud's solvency dreams alive.

(All this, by the way, critically still needs an ever-greater flood of hedge-worthy credit securities: the lure of war and Treasury securities galore is no unlikely coincidence today's endless drumbeat. Thus, a frightful hit, both physically and financially, might serve to bring forth securities that are needed, while the sinking weight of wave c of (b) down upcoming might bring forth a stark, violent benchmark signaling profound changes ahead. Increasing upheaval across the globe—growing resentments among friend and foe alike— probably are a harbinger of things to come over the coming decade.)

Yet today's lender of last resort-fed bubble, too, now entering its desperation phase, most certainly will explode one day, just like all those preceding. Thus will be the moment the Fuehrer consolidates a global banking dictatorship with little resistance, paving the way for wave C down targeting major indexes to levels last seen in the 1987-1994 period and completing a large Elliott corrective wave forming since Y2k top.

Not much longer, then, will foresight likely be consumed with unrequited perception of change coming, as the Fed's physical effect, surely, will but further hasten the demise of a former status quo once backing what is now a forever lost confidence underpinning a still growing, and only but more wildly distorted credit bubble. A new dynamic surely is at hand in an age of open-ended panic.


$SPX

Another variation on an a-b-c "zig-zag" up from early-October 2011 bottom. Here, a "rising wedge" is seen forming the zig-zag's "c" wave starting from late-November 2011 bottom, with its 3rd wave just completing. The CBOE Put/Call Ratio, as well as the NYSE Bullish Percent Index decidedly confirm this view. Yet like all other technical measures, though, these simultaneously present a mixed picture characterizing the moment, this in evidence revealing fading conviction is backing the market's continued levitation. We see this above via the S&P 500's momentum off its October 2011 bottom (bottom panel), as well as accompanying volume over the duration of the market's subsequent advance.

Per the latter, there has been a consistent pattern during advancing periods since early-October 2011. During each discrete advance over the interim diminishing volume has accompanied the greater bulk of the market's rise, only to spike when a peak was reached. Presently we see this occurring again, and this right as a dynamic line of long-established resistance is being met. Chances are the new Fed fix of endless hyperinflationary happiness more or less has run its course for the moment. Coming months should see trapped weak hands trimming stakes all across the spectrum in preparation for the sequence of events likely to mark the hyperinflationary blow out of the global physical economy.


Fast Money
* * * * *

© The Risk Averse Alert — Advocating a patient, disciplined approach to stock market investing. Overriding objective is limiting financial risk. Minimizing investment capital loss is a priority.

Analysis centers on the stock market's path of least resistance. Long-term, this drives a simple strategy for safely investing a 401(k) for maximum profit. Intermediate-term, investing with stock index tracking-ETFs (both their long and short varieties) is advanced. Short-term, stock index options occasionally offer extraordinary profit opportunities when the stock market is moving along its projected path.

Nothing is set in stone. Nor is the stock market's path of least resistance always known. More often than not, there are no stock index option positions recommended.


There's an easy way to boost your investment discipline...

Get Real-Time Trade Notification!

Thursday, September 13, 2012

Fed Braces for Approaching Lehman Moment


Hat tip Bernice for exposing just how close we are to another Lehman moment. So much for math suggesting the Fed is trapped. In the new normal evidently is new math allowing central banks to embrace their own insolvency with no concern whatsoever for the little children who plainly see the emperor has no clothes.

Open ended bailout is certain to accelerate the hyperinflationary shutdown of the physical economy. However, that's tomorrow's problem. Sufficient for the day are the needs of hopelessly insolvent financial albatrosses whose European exposure sits atop insolvent mortgage-backed securities the Fed cannot take onto its balance sheet fast enough. Some of these pigs are about to be slaughtered, while the Fed greases the skids for consolidation of physical and financial assets to satisfy the Fuehrer's plans for global financial dictatorship.

Once a fascist, always a fascist, and Bernice is. Does he really think anyone buys his sophistry suggesting full employment is the Fed's objective? Does he imagine a boom in business demanding chamber maids with masters degrees? How will they even get to work as the price of gas makes the trip prohibitive? Still, criminally incompetent is a label better assigned to a press corp whose questions raised during the Fed chairman's press conference were nowhere in the ballpark located at 1923 Wiemar Germany. That's the game the Fed is playing, and the so-called "free press" evidently hasn't a clue. Or are they paid not to?


$NYHL

The NYSE new 52-week high-low differential decidedly confirms the wave count simplification put forward here Monday. Likewise substantiated is the outlook supposing a "zig-zag" unfolding off March '09 bottom is midstream in forming, whose "c" wave higher awaits completion of the zig-zag's connecting "b" wave, itself nearing the start of its "c" wave lower. Today's best reading of NYSE new 52-week highs-lows since March '09 bottom indicates further gains likely lie ahead.

But not right away. Above is one measure wherein future intentions have been disguised for the longest time. This is unlike index momentum measures, the likes of which I will still contend more likely suggest the market is not about to run away to the upside. Now, much as the NYSE new 52-week high-low differential's consistent expansion leading into the market's peak of April 2010 "signaled" the likelihood the market would extend higher following the May 2010 "flash crash" and its aftermath, the same is being signaled once wave c of (b) completing the middle wave of the a-b-c "zig-zag" off March '09 bottom comes to pass. As the currently forming wave c of b of (b) completes over days/weeks ahead, we will likely see the above measure diverging upon the peak of wave b of (b) being met, this like what occurred as wave 5 of (a) unfolded from July 2010 to February 2011. Chances are, too, during formation of wave c of (b), this as the presently approaching Lehman moment becomes manifest, the NYSE new 52-week high-low differential likely will eclipse its lows of last year.


Fast Money
* * * * *

© The Risk Averse Alert — Advocating a patient, disciplined approach to stock market investing. Overriding objective is limiting financial risk. Minimizing investment capital loss is a priority.

Analysis centers on the stock market's path of least resistance. Long-term, this drives a simple strategy for safely investing a 401(k) for maximum profit. Intermediate-term, investing with stock index tracking-ETFs (both their long and short varieties) is advanced. Short-term, stock index options occasionally offer extraordinary profit opportunities when the stock market is moving along its projected path.

Nothing is set in stone. Nor is the stock market's path of least resistance always known. More often than not, there are no stock index option positions recommended.


There's an easy way to boost your investment discipline...

Get Real-Time Trade Notification!

Wednesday, September 12, 2012

Rising Wedge Dissection


Staying with prospect that, wave c of b of (b) could be forming a rising wedge—a special Elliott impulse wave whose five component waves each subdivide into threes (i.e. a-b-c), rather than in typical 5-3-5-3-5 fashion—the following dissects the component five waves of wave c of 3 of c forming since September 4th (the first trading day of the month).

Just to review, wave (b) is the middle wave of an a-b-c "zig-zag" up from March '09 bottom. Wave (b)'s completion is believed some months away, awaiting the approaching completion of wave b [up]—this, a "zig-zag" forming off early-October 2011 bottom—followed by wave c [down] whose five waves lower are projected to challenge the S&P 500's rising trend line dating back to the index's 1974 bottom, thus targeting the S&P 500 to fall somewhere in the vicinity of 900-ish. Wave c of b of (b) is expected soon to meet an overhead, dynamic line of resistance (discussed on Friday) suggesting its completion will not see the S&P 500 rising much higher from its present level.


SPX 5-min

Very typical intra-day RSI behavior accompanying the component five waves of wave c of 3 of c. Whether wave iv of c completed on Tuesday remains to be seen. Well enough is that, relative strength registered during formation of wave iv of c has weakened in contrast to that registered during formation of wave ii of c. Upcoming should be one final lift higher forming wave v of c, and wave 3 of c of b of (b) should be in.

Assuming an Elliott "rising wedge" in fact is forming off early-June 2012 bottom, then some days/weeks subsequently should be spent forming waves 4 and 5 of c of b of (b), upon whose completion the next Lehman moment should begin simmering on course to becoming a full blown boil threatening to explode the pressure cooker containing the trans-Atlantic banking system. During that fright-filled interim wave c of (b) should form and deliver the worst sell-off since March '09 bottom.


Fast Money
* * * * *

© The Risk Averse Alert — Advocating a patient, disciplined approach to stock market investing. Overriding objective is limiting financial risk. Minimizing investment capital loss is a priority.

Analysis centers on the stock market's path of least resistance. Long-term, this drives a simple strategy for safely investing a 401(k) for maximum profit. Intermediate-term, investing with stock index tracking-ETFs (both their long and short varieties) is advanced. Short-term, stock index options occasionally offer extraordinary profit opportunities when the stock market is moving along its projected path.

Nothing is set in stone. Nor is the stock market's path of least resistance always known. More often than not, there are no stock index option positions recommended.


There's an easy way to boost your investment discipline...

Get Real-Time Trade Notification!
Tuesday, September 11, 2012

God Save Our Sinking Ship Follow-Through


As promised, following is a prospective Elliott wave count labeling the S&P 500's a-b-c "zig-zag" up from early-October 2011, this forming wave b of (b) in a larger a-b-c "zig-zag" up from March '09 bottom.


$SPX

Probably the most interesting facet of this prospective wave count is the zig-zag's "b" wave, seen taking the form of a so-called "running correction," a special 3-3-5 Elliott corrective wave whose appearance either precedes or follows an extended move in the direction of the main trend. Being that the market's move up over the month of October 2011 simply was monster ("God save our sinking ship!"), and being that well-established overhead resistance is fairly at hand, it's safe to assume the running correction appearing in the "b" wave of the zig-zag up from early-October followed the extended move forming the zig-zag's "a" wave.

Now, per this zig-zag's "c" wave, the Elliott wave count indicated above is a tentative take on a prospective "rising wedge." Even if this special Elliott wave form in fact is unfolding off early June bottom, its component five waves (each subdividing in a-b-c fashion) could unfold over a longer duration than the above view suggests. In fact it's possible three waves up from early June bottom might end up forming but the rising wedge's first wave, thus raising likelihood the market will hold up for some weeks longer. Yet even were this to happen, overhead resistance reviewed here Friday, again, should put a cap on any further gains.


Fast Money
* * * * *

© The Risk Averse Alert — Advocating a patient, disciplined approach to stock market investing. Overriding objective is limiting financial risk. Minimizing investment capital loss is a priority.

Analysis centers on the stock market's path of least resistance. Long-term, this drives a simple strategy for safely investing a 401(k) for maximum profit. Intermediate-term, investing with stock index tracking-ETFs (both their long and short varieties) is advanced. Short-term, stock index options occasionally offer extraordinary profit opportunities when the stock market is moving along its projected path.

Nothing is set in stone. Nor is the stock market's path of least resistance always known. More often than not, there are no stock index option positions recommended.


There's an easy way to boost your investment discipline...

Get Real-Time Trade Notification!

Monday, September 10, 2012

Wave Count Simplification


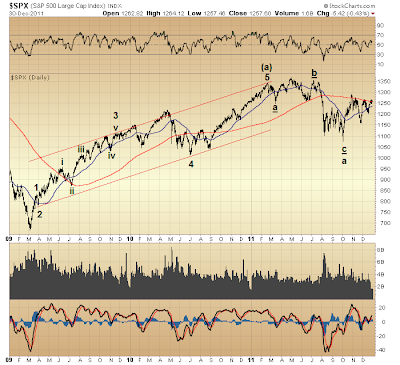
Here's a fresh look at the five component waves forming wave (a) of B off March '09 bottom, itself being the initial wave of an a-b-c "zig-zag" up from March '09 (the likes of which whose "b" wave presently is thought forming). This new found Elliott wave view is in keeping with perspective put forward here over the past couple weeks, wherein the possibility of an a-b-c "zig-zag" (5-3-5) up from March '09 is seen following an a-b-c "flat" (3-3-5) down from Y2k peak—a prospect both satisfying the Elliott Wave Principle's "alternation guideline," as well as serving to delay to sometime in the foreseeable future major indexes returning to levels last seen in the 1987-1994 period.


$SPX

Probably the most objectionable matter per this view is the labeling of wave 2 of (a). How can this rightly be considered "proportional" to wave 4 of (a)? Well, "time" plays no factor in the rules put forward in the Elliott Wave Principle. So, time elapsed forming wave 4 versus that forming wave 2 is of no regard. Yet price proportionality of corrective waves in a 5-wave sequence (i.e. the 2nd and 4th waves) has relevance in the framework of the Elliott Wave Principle (still, this more as a "guideline" than any hard-and-fast rule). So, consider what of wave 1 of (a) wave 2 corrected. Now consider what of the S&P 500's gain from March '09 bottom to the end of wave 3 of (a) wave 4 corrected. I'd be willing to bet there's proportionality founded on a Fibonacci relationship between waves 2 and 4.

The above wave count certainly lends itself to channeling on arithmetic scale. Likewise was another Elliott Wave Principle guideline satisfied when wave 4 ended within the range of the fourth wave of one lesser degree (i.e. wave iv of 3).

Further supporting this wave count is the performance of both RSI (top panel) and MACD (bottom) over the duration the five component waves forming wave (a) of B unfolded. Note that, never were respective RSI and MACD readings at March '09 bottom ever exceeded during formation of wave (a). This distinction did not occur until wave (b) of B began taking form last year.

Again, this is just one possibility among several. Right now, I like this prospective view, though, particularly on account of the fact it simplifies the view on wave (b) of B currently forming. This middle wave of the a-b-c "zig-zag" up from March '09 bottom will subdivide into a 3-wave form. Given the viewpoint indicated above, the 3-wave form slated to become wave (b) of B is unfolding as a 3-3-5 "flat." This flat's "a" wave unfolding from February 2011 through early-October 2011, itself, took the form of a 3-3-5 "flat." Its "b" wave currently forming is seen "alternating" and taking the form of a 5-3-5 "zig-zag" (whose component waves I will detail tomorrow). Although this "zig-zag" forming wave b of (b) of B probably has some days remaining before it is completed, its upper reaches are thought not far off (for reasons detailed Friday).

As wave (b) of B is more precisely taking the form of an "irregular flat"—this being confirmed as a result of the "zig-zag" currently forming wave b of (b) of B exceeding the peak from which wave a of (b) of B began to unfold last February—we have further basis for suspecting wave c of (b) of B [down] will bring the S&P 500 to fall below its low reached early-October 2011, this when wave a of (b) of B completed. Thus does the S&P 500's projected decline to the trend line formed off its 1974 bottom find further substantiation (as was suggested Friday), making the prospective wave count above all the more interesting. (At this point we might better suspect the greater bulk of the S&P 500's projected decline to its long-term [rising] trend line might not develop until early next year, although this decline's 1st and 2nd waves [of five waves down] could unfold going into year end.)

p.s. I just noticed complexity increases for every corrective wave from wave 2 up to and including wave 4. Check it out. More reason to better regard the potential validity of the above Elliott wave count alternative.


Fast Money
* * * * *

© The Risk Averse Alert — Advocating a patient, disciplined approach to stock market investing. Overriding objective is limiting financial risk. Minimizing investment capital loss is a priority.

Analysis centers on the stock market's path of least resistance. Long-term, this drives a simple strategy for safely investing a 401(k) for maximum profit. Intermediate-term, investing with stock index tracking-ETFs (both their long and short varieties) is advanced. Short-term, stock index options occasionally offer extraordinary profit opportunities when the stock market is moving along its projected path.

Nothing is set in stone. Nor is the stock market's path of least resistance always known. More often than not, there are no stock index option positions recommended.


There's an easy way to boost your investment discipline...

Get Real-Time Trade Notification!