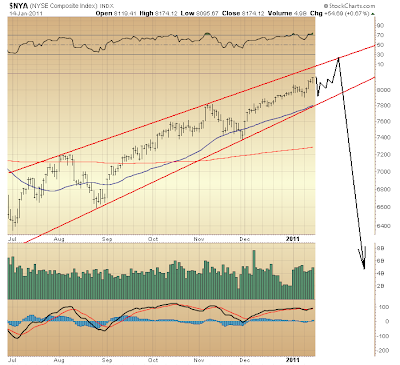
Whether five waves up from late-June 2010 bottom are forming a "special" Elliott impulse wave called a "diagonal triangle" (also called a "rising wedge") whose completion could be but days away...

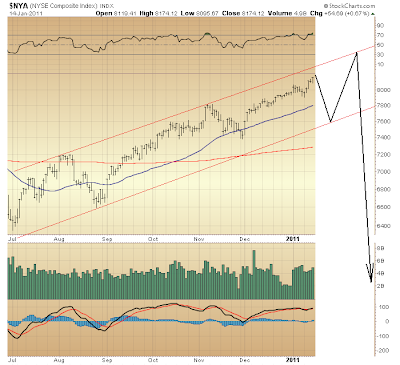
Or whether instead might be forming a more typical five wave advance whose "channel" at the moment can only be approximated — requiring further development of the fourth wave prior to the fifth wave completing — bringing the market to levitate some weeks longer...

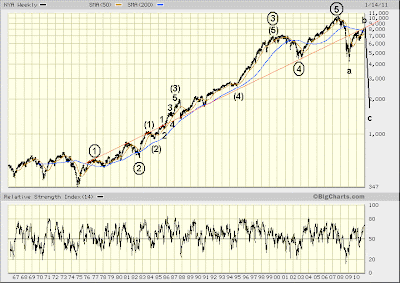
The market's relatively limited upside prospect in either case is substantiated via a long-term perspective involving a line around which has turned the NYSE Composite Index over the past three-plus decades. Arbitrary though this might seem, the manner in which this line intersects key points in a well-substantiated Elliott wave unfolding since 1974 raises sight toward how recent years' activity might be warning of trouble straight ahead...

This rising line (beginning in 1976) contains to its downside those several first waves unfolding as part of five waves up from 1974-2007. This line likewise contains to its upside those several fourth waves unfolding as part of the same five waves up from 1974-2007.
The line's upside penetration came in 1986 as a third wave of a third wave of a third wave higher unfolded. During that year, too, the number of NYSE-listed issues hitting new 52-week highs (this as a percentage of NYSE-listed issues) reached its high mark for the entire 1974-2007 period.
Curiously enough, this line's downside penetration came in 2008 as a third wave down unfolded. Making that year's negative turn in relation to this line all the more interesting is the fact that, the number of NYSE-listed issues hitting new 52-week lows set an all-time record during 2008's darkest days.
This line since has proven itself tried and true resistance, particularly over the past year. Abundant technical weakness currently in evidence suggests resistance will continue.
Although it is uncertain how much longer might persist the market's levitation, overhead resistance this line consistently has presented over the past year — and this in the midst of entirely negative [intermediate-term] technical conditions whose state only has weakened — is evidence enough to subdue the banter sure to accompany any further trade resiliency yet in store before unabated physical economic breakdown invariably precipitates what could be the most chaotic financial crisis in history sometime over the immediate months ahead.
* * * * *
© The Risk Averse Alert — Advocating a patient, disciplined approach to stock market investing. Overriding objective is limiting financial risk. Minimizing investment capital loss is a priority.
Analysis centers on the stock market's path of least resistance. Long-term, this drives a simple strategy for safely investing a 401(k) for maximum profit. Intermediate-term, investing with stock index tracking-ETFs (both their long and short varieties) is advanced. Short-term, stock index options occasionally offer extraordinary profit opportunities when the stock market is moving along its projected path.
Nothing is set in stone. Nor is the stock market's path of least resistance always known. More often than not, there are no stock index option positions recommended.
 There's an easy way to boost your investment discipline...
Get Real-Time Trade Notification!


2 comments:
I see on your graphs that there have been a number ups and then downs over time on the NYSE. But what technical indicator shows that there is going to be a drastic decline? The economy is supposedly improving per other financial experts.
Also where would you recommend placing funds prior to this in order to ride out the storm you might say? Bonds?
There is no one technical indicator elevating the probability of collapse. Rather there are a preponderance of technical measures supporting the above Elliott wave count applied to the ups and downs of the NYSE Composite Index from 1974 on.
Whether imminent is wave c taking major indexes down to levels last seen in the 1987-1994 period -- this completing an a-b-c corrective wave that began in October 2007 -- in truth is uncertain. Wave b up from March '09 bottom could extend in such a manner as leads major indexes to trade sideways over the next few years. Yet in this instance, too, there's little doubt that, building underlying technical weakness is suggesting that, major indexes probably are trading near the upper end of their respective ranges over these next few years. (Indeed, this has been my position at every high major indexes have reached while the market has levitated over the past year. Truth is in the present instance the technical case against any broad-based breakout only is the more conclusive.)
There remains every technical reason to fear even the mere possibility that wave c down could unfold over a mere matter of days and weeks sometime this year, indeed, even prior to the end of 2011's first quarter. If you believe as I do that money talks, then let me assure you the absence of "animal spirits" -- a reality missed by some well-known observers -- is a profound vulnerability whose risk was born out in May 6th's "flash crash," and remains very much alive still.
My response to those observers citing an improving economy recently has been given and can be summarized in a word: fantasy. I will write more about this in a post dated January 17, 2011.
Per a sane investment posture at this time, think capital preservation. If you're Warren Buffett looking to preserve billions of dollars, then you would buy a railroad. If you're the average Jane or Joe, then you buy Treasury bills.
Post a Comment