Friday, January 30, 2009

Identifying Pigs About to be Slaughtered


Why is it common stocks historically have offered the highest returns? And why is it corporate bonds offer higher yields than a government-insured, bank savings account?

The answer, of course, you already know. So, let me ask you this...

Why are so many fools promoting the perpetuation of wildcat finance? Whose interest do Monetarist Monkeys serve working overtime putting forward unsubstantiated claims that nationalization of the banking system is the worst idea since Coke mistakenly changed its original formula more than two decades ago?

Consider fundamental principles surrounding questions I am raising here. Now, look over to the left under "Things I Believe."

There it is! The answer to everything...

"Bulls make money, bears make money, and pigs get slaughtered."

My, how pigs squeal as they sense their demise.

Jim Cramer, the raging monetarist monkeyThis is precisely what we are witnessing before our very eyes in protests to nationalization. It is the sight and sound of pigs on the verge of being slaughtered.

There's Martin Feldstein from Harvard University. And there's our boy Shemp.

If you asked the likes of these two the same questions I began with, I bet their answer speaks of risk and reward. Risk is why stocks and bonds historically deliver superior returns. Which, of course, implies investors are responsible for performing due diligence.

Does not Cramer repeatedly preach the need for doing one's "homework?" For what? To learn how much feed is available at the trough? Or is due diligence, first, a matter of assessing one's risk?

Yes, it is the latter because RISK IS REAL (as if I needed to shout it in times like these).

Now, about the matter of undue risk having been taken at critically important financial institutions vital to our economy's functioning...

Who FIRST should be responsible for bearing losses? The taxpayer or the shareholder? The struggling slug or the gentleman bondholder? Am I missing something?

So, then, what if the losses are so large, all classes of investors are wiped out? (And the fact of the matter is, they are.) What should be done with such economically vital financial institutions as are facing bankruptcy?

The answer is made plain by a President left no choice but to admonish financiers for their continued reckless behavior.


These institutions will be taken over. Management will be thrown out. Precisely what Bill Seidman spoke about the other day.

Let's get something straight, Cramer. It is a done deal. Now, the big question...

Does a pig's squealing delay its own end?

Absolutely not.

Yet, too, a pig's cry speaks a truth (albeit one involving its own demise). So, then, Cramer's talk about how nationalization threatens the market's fortune should not be thought the ravings of an irrational victim. After all, the name of the game has been (and would continue to be, if only it could) Inflate or Die.

Cramer squeals because were banks nationalized, structured finance might then be given a decent burial ... and the finest inflationary tool ever conceived will officially have life no more, at least not in our lifetimes. Thus, the grease helping turn Cramer's world — as well as that of his pals over at Goldman — will have dried out.

So, he probably is right about Wall Street's fate should banks be nationalized. And like I said, it really looks to be a done deal. It's only a matter of time before the fat lady sings. There simply is no other choice available. This fact, all on its own, speaks of why those who argue against nationalization are rightly called pigs.

And pigs are slaughtered because real people must eat. There is a breakdown in world trade ... caused by a collapse in credit ... and this indeed is threatening the availability of dinner ... for real.

As for this moment, well, there are rickety bridges still standing, affording escape to those aware of the coming slaughter. This is where politics intersects the bounce I have been projecting (and continue to expect) — the market's melt-up — a profit opportunity to those who did not play the fool in 2008 ... a face-saving moment for those investors who wish to play the fool no more. Political support for the Street appears likely to crumble soon. When it does, look out below.


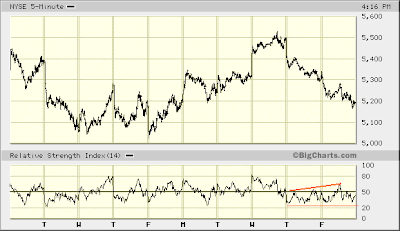
NYSE 5-min

What you see above is exactly what the next-to-last paragraph yesterday was all about. Next up, then, should be the market's strong move higher ... that is at least eventually.


$NYA

There's no reason why the market couldn't trade in the range established this week for several more days to come ... before launching to a new high (post-November bottom) ... then suffer still another pullback ... delaying the market's ultimate melt-up yet again ... all over the weeks ahead, extending into March-April.

Whatever.

One thing is becoming relatively certain. The vast majority of common shares outstanding have already been distributed into weak hands. So, see the rickety bridge ahead and buyer beware.


(FF to 5:00)


Fast Money
* * * * *

© The Risk Averse Alert — Advocating a patient, disciplined approach to stock market investing. Overriding objective is limiting financial risk. Minimizing investment capital loss is a priority.

Analysis centers on the stock market's path of least resistance. Long-term, this drives a simple strategy for safely investing a 401(k) for maximum profit. Intermediate-term, investing with stock index tracking-ETFs (both their long and short varieties) is advanced. Short-term, stock index options occasionally offer extraordinary profit opportunities when the stock market is moving along its projected path.

Nothing is set in stone. Nor is the stock market's path of least resistance always known. More often than not, there are no stock index option positions recommended.


There's an easy way to boost your investment discipline...

Get Real-Time Trade Notification!

Thursday, January 29, 2009

Najarian Agrees Underlying Technical Conditions Are Positive


Today's trade entirely confirmed my concern over Monday's giveback. More subtly, too, every reason to remain positive likewise was confirmed.

The market's underlying technical condition remains decidedly firm. There simply is no sign a sudden bout of severe selling is about to come bearing down. So, the case made on Tuesday remains my preferred view. Weakness Monday and today suggests an extended period of further sideways trading probably is in store.


$NYA

Whether the proposed outlook presented above comes to pass precisely as indicated is entirely speculative. You get the gist of what appears likely and this is all that's ever intended.

Now, the one thing I will be looking for as the market rises to its peak projected above is an imbalanced rush to bullishness.

Going into the early-January '09 peak a number of underlying technical measures strongly charged in the direction positively confirming the market's advance. Technical confirmation, in and of itself, is all well and good, of course. However, we have seen a number of instances where this or that measure (be it RSI, VIX, the McClellan Oscillator, etc.) moved on a fast track simultaneously with a market advance. This apparently has been an indication of buy-side imbalance, and typically has been followed by decided selling.

If we see this sort of thing again upcoming, I won't remain long Ultra ETFs. Instead, I will take profits, and possibly go Ultra Short.


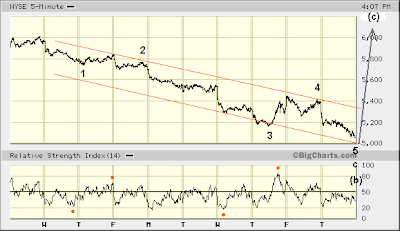
NYSE 5-min

The Elliott Wave perspective you see above essentially details the basis for the outlook shown on the daily chart of the NYSE Composite. This Elliott Wave count puts this week's weakness — particularly Monday's — in fitting perspective conforming to well-defined formulations detailed in the Elliott Wave Principle.

One of the general characteristics of a so-called "b" wave (of an a-b-c corrective wave) is it leads the analyst to think, "Something is not right." This very much describes my attitude toward Monday afternoon's relatively deep, 5-minute RSI dive.

There's probably a little more selling to come before the market moves strongly higher. Look for RSI at yesterday's close to be slightly exceeded (to the top side), then a final decline coinciding with an RSI divergence (relative to today's low reading).

By the way... I've received requests for Trade Notification the past couple days and I have not had time to reply as I typically do. I wanted to pass along the fact I am long DDM, SSO, QLD, UWM, and MVV. As you can see, I think this trade's prospects are promising. So, do with this as you wish as the market prepares to turn higher...


Fast Money
* * * * *

© The Risk Averse Alert — Advocating a patient, disciplined approach to stock market investing. Overriding objective is limiting financial risk. Minimizing investment capital loss is a priority.

Analysis centers on the stock market's path of least resistance. Long-term, this drives a simple strategy for safely investing a 401(k) for maximum profit. Intermediate-term, investing with stock index tracking-ETFs (both their long and short varieties) is advanced. Short-term, stock index options occasionally offer extraordinary profit opportunities when the stock market is moving along its projected path.

Nothing is set in stone. Nor is the stock market's path of least resistance always known. More often than not, there are no stock index option positions recommended.


There's an easy way to boost your investment discipline...

Get Real-Time Trade Notification!

Wednesday, January 28, 2009

Buy the Rumor, Sell the News


Monday's giveback still bugs me. Am I making too much of weakness displayed? Or was it instead fitting in its place on the road to melt-up?

There's something curious about Liesman's scoop last night on the "Bad Bank." Rupert apparently was not in on the story. Hours after the "Dead-Head Economist" broke the story on CNBC, not one word of it appeared in the Journal.

Was Liesman doing the work of a soldier? The boss tells you to push a button, you push a button. Is that what is was?

All I know is A-list politicians do not speak openly about the banking system's insolvency every day of the week.

Melt-up scenarios — thinking strictly in terms of a manufactured affair — run through my head. Buy the rumor, sell the news ... is this possibly one of those moments?


$NYHL

Two things to gain from the differential between new 52-week highs and lows on the NYSE...

First, it offers evidence there are fewer willing sellers to help the short side of the trade. Last week's low in the NYSE Composite reached slightly lower than early December's low. Yet the NYSE High-Low differential diverged. That's a positive.

Furthermore, November's bottom in the NYSE Composite was not much lower than last week's. Yet issues hitting new 52-week lows presently remain relatively few.

Likewise, if something more negative were still forthcoming, then NYSE new highs and lows might have broken down in a fashion similar to early-June '08. Nothing remotely close to this has happened, though.

Still, keep an eye on this. Like I said, Monday's giveback remains troublesome. Although there was much technical good accompanying today's trade, all reason to project continued strength can be challenged by what passes during any given day...


Fast Money
* * * * *

© The Risk Averse Alert — Advocating a patient, disciplined approach to stock market investing. Overriding objective is limiting financial risk. Minimizing investment capital loss is a priority.

Analysis centers on the stock market's path of least resistance. Long-term, this drives a simple strategy for safely investing a 401(k) for maximum profit. Intermediate-term, investing with stock index tracking-ETFs (both their long and short varieties) is advanced. Short-term, stock index options occasionally offer extraordinary profit opportunities when the stock market is moving along its projected path.

Nothing is set in stone. Nor is the stock market's path of least resistance always known. More often than not, there are no stock index option positions recommended.


There's an easy way to boost your investment discipline...

Get Real-Time Trade Notification!

Tuesday, January 27, 2009

Dead-Head Economist Scoops Pending Treasury Bailout


Rumor has it a 'Bad Bank' will be proposed by Treasury early next week as solution to so-called "toxic" (read: worthless) debt dragging down the financial system. After-market futures are reacting quite positively.

So, yesterday's fear might prove unwarranted, then. A final bout of weakness completing this month's decline could be off the table

Yesterday's notable 5-minute RSI dive to unexpected sell-side depths was basis for fearing additional weakness prior to melt-up. Yet should the market immediately shoot higher on the basis of tonight's rumor and effectively kill the possibility of last week's low being imminently retested, the weakness I thought possible might be merely delayed rather than entirely canceled. In other words, the message of yesterday afternoon's weakness following an otherwise promising start to the week's trading might be signaling an alternate way in which the market's pending melt-up might be delayed.


$NYA

As you can see, the markup above proposes the possibility sideways trading of the past few months might extend for some weeks to come. It also suggests the first month of 2009 might finish with a gain. We will know for sure in just three days.

Tonight's rumor — bogus as far as being a "solution" to a bankrupt financial system — could very well provide a spark and light a fire under positively poised technical measures that currently find themselves at critical inflection points.

Should a screaming rally unfold over the next few days, it will be interesting to see the degree to which further, future gains are projected by various technical confimations ... much as was the case as the market peaked early this month. I am rather expecting a repeat performance.

Likewise, should a pronounced buy-side imbalance be displayed, look out for either a rapid return to present levels at the low end of the market's trading range over the past few months ... or a prolonged journey to nowhere possibly lasting several weeks.


Fast Money
* * * * *

© The Risk Averse Alert — Advocating a patient, disciplined approach to stock market investing. Overriding objective is limiting financial risk. Minimizing investment capital loss is a priority.

Analysis centers on the stock market's path of least resistance. Long-term, this drives a simple strategy for safely investing a 401(k) for maximum profit. Intermediate-term, investing with stock index tracking-ETFs (both their long and short varieties) is advanced. Short-term, stock index options occasionally offer extraordinary profit opportunities when the stock market is moving along its projected path.

Nothing is set in stone. Nor is the stock market's path of least resistance always known. More often than not, there are no stock index option positions recommended.


There's an easy way to boost your investment discipline...

Get Real-Time Trade Notification!

Monday, January 26, 2009

Polishing Your Nerves of Steel


If this market must grind nerves a few days more while last week's low is challenged ... well, then let it be. Indeed, today's mid-day fade suggests we might better brace for this possibility. Apparently, this month's bear trap still designs to deceive more victims.


NYSE 5-min

Today's deep RSI thumping (though reaching no sell-side extreme) simply does not fit the character of a market on track to move higher. That's not to say something devastating is contrarily portended. Not in the least.

Rather, for several days now reasonable possibility has projected the sort of grind we have seen. And still, one final move lower — retesting last week's worst level — could unfold. Today's trading simply appears to raise this probability. No big deal...


$NYA

Make no mistake, however. The prospective channel you see containing this month's decline? The NYSE Composite Index could, indeed, fall to the lower end of this. This is entirely possible.

Just as likely, though, is a gentle decline retesting last week's low ... falling well short of the "worst case" possibility defined by the channel drawn above.

Judging by how both the NYSE McClellan Oscillator and Bullish Percent Index are at critical inflection points, a better than "worst case" outcome is reasonably anticipated.

Look for volume accompanying a prospective retest of last week's low to fall short of peak volume so far this month (indicating selling exhaustion). Look also for a price-RSI divergence to form upon bottom being reached (indicating buying strength is building).

Then, it should be Emeril time. Bam! Melt-up...


Check out CNBC's new video player
Fast Money
* * * * *

© The Risk Averse Alert — Advocating a patient, disciplined approach to stock market investing. Overriding objective is limiting financial risk. Minimizing investment capital loss is a priority.

Analysis centers on the stock market's path of least resistance. Long-term, this drives a simple strategy for safely investing a 401(k) for maximum profit. Intermediate-term, investing with stock index tracking-ETFs (both their long and short varieties) is advanced. Short-term, stock index options occasionally offer extraordinary profit opportunities when the stock market is moving along its projected path.

Nothing is set in stone. Nor is the stock market's path of least resistance always known. More often than not, there are no stock index option positions recommended.


There's an easy way to boost your investment discipline...

Get Real-Time Trade Notification!

Saturday, January 24, 2009

What I Like From Like On NASDAQ


Here's a picture worth a thousand words painted on a chart of the NASDAQ Composite extending over the past two years. This view helps make the case for rapid recovery of much of the losses suffered during the latter half of 2008, supporting the possibility of a nearly 60% advance unfolding over approximately the next six months.


$COMPQ

Where do I begin? How about the line of support that, from 2003-2008 put a floor under the NASDAQ Composite. This support resided last year in the vicinity of 2200 and was decisively broken during the September-October '08 collapse. From this point forward, then, this [former] line of support, well-established over 5+ years, now stands as resistance.

Indeed, during those 5+ years we can suppose a series of long positions was established each time this [modestly rising] line of support was tested. And it was tested on many occasions.

These positions are now under water. We can be reasonably confident, then, any recovery to the area where long positions were established will be met by selling from those longs happy for a chance to get out even.

Lo and behold, too, the vicinity of 2200 is where the NASDAQ Composite traded during the week Lehman Brothers went bust. I have for some time been projecting resistance to any future advance once indexes approach levels last seen mid-September '08, when Lehman fell into bankruptcy.

But the thing I really wanted to show you was the behavior of the NASDAQ Composite from its November 2007 top through its secondary tops ... first in May 2008, then in August 2008.

Note how NASDAQ's break in January '08 was similar to its larger break in October '08. The lower end of a declining channel forming since the November '07 top was decisively violated in January '08. Similarly, the lower end of a larger declining channel forming since the same November '07 top was decisively violated in October '08.

Now, observe NASDAQ's behavior following its January '08 bottom. We see similar behavior following its October '08 bottom. Indeed, back in October I was projecting the likelihood of a drawn out bottoming process ... much as has in fact been developing.

Finally, note how in April '08 the NASDAQ Composite jumped back into the narrow declining channel out of which it had fallen in January '08. Not only did NASDAQ return to this channel, but it subsequently rose to the upper end of it by May-June '08.

So, could we be looking at similar behavior going forward? Might the NASDAQ Composite not only return to the larger declining channel out of which it fell in October '08, but subsequently rise to the upper end of this channel?

I submit this is, indeed, a distinct possibility...

* * * * *

© The Risk Averse Alert — Advocating a patient, disciplined approach to stock market investing. Overriding objective is limiting financial risk. Minimizing investment capital loss is a priority.

Analysis centers on the stock market's path of least resistance. Long-term, this drives a simple strategy for safely investing a 401(k) for maximum profit. Intermediate-term, investing with stock index tracking-ETFs (both their long and short varieties) is advanced. Short-term, stock index options occasionally offer extraordinary profit opportunities when the stock market is moving along its projected path.

Nothing is set in stone. Nor is the stock market's path of least resistance always known. More often than not, there are no stock index option positions recommended.


There's an easy way to boost your investment discipline...

Get Real-Time Trade Notification!

Friday, January 23, 2009

Anticipating the Mother of All Short Squeezes


One thing technical analysis affords is capacity to step away from trade-related noise and see things from dollars and cents perspective. Your thinking enters into the big picture where everyone involved is trying to make a buck.

And in the stock market all ambitious soul must do one thing in this attempt...

Trade.

Buy and sell ... in hope and in fear ... with every last share counted and reported in the volume of shares exchanged.


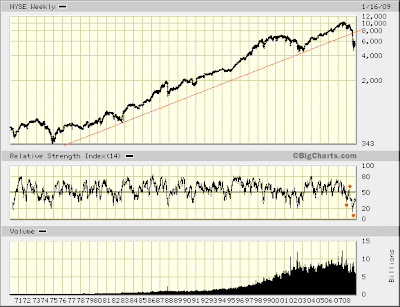
NYSE weekly

Check out volume on the Big Board during last year's October-November gassing. It hardly presents the picture of a market consumed with fear, much as one might otherwise expect given circumstances. In fact, you might conclude what's reflected is a certain measure of complacency.

Probably more to the point, though, is the likelihood that, the majority simply got caught unaware. This does not bode well, longer-term.

Yet despite this reason to be longer-term bearish, prospects for a near-term melt-up remain. Indeed, the message relayed by the volume of shares exchanged over nearly the past 20 months supports this probability.

First, ask yourself this. If last year's disaster could not incite heightened selling interest, then why would those holding shares throughout the bloodbath choose to sell now? Absent any unexpected catastrophe, these folks likely will add little selling pressure straight ahead. They're probably holding on for dear life ... looking for a better price. If not this, then they're likely not worried at all (Warren Buffett comes to mind).

None of this is meant to take away from the fact that, the stock market can fall of its own weight. We see with our own eyes how this was demonstrated last year. So, the question presently is whether this trend could continue. And the answer, of course, is it could.

(Indeed, diminished volume accompanying selling over the past couple weeks has been noted in recent commentaries, and although mentioned as being reflective of selling exhaustion, its occurrence also highlights the point being made here.)

Yet furthering odds the market will move higher, near-term, we find volume over the past 20 months raising sight of an interest apparently very much attune to risk shadowing the stock market. This contingent evidently bailed out in a big way very near the top.

Look back to mid-2007. It was then the beginning of the end of wildcat finance swept over the stock market. Selling hitting the NYSE July-August 2007 was on volume rivaled only by that registered five years earlier, as the NYSE Composite fell into its July 2002 bottom. Apparently some powerful, collective interest foresaw much worse to come, possibly explaining why an increased number of shares was offered up for sale so near the market's top.

And lo and behold, much worse did come. Yet with each successive swing lower peak volume has diminished. So, what gives?

Could the concern of those who near the '07 top saw the urgency of a deteriorating situation in global credit markets be abating? Probably not. Were this so, then volume would give some indication buying interest is increasing. Yet we see nothing of the sort.

So, what perspective might be gained?

Well, it's no secret I think elimination of the uptick rule (July 6, 2007) right at the time the stock market topped was no coincidence in relation to what followed. Indeed, those who bailed out of the market at the top probably are the same players who made a killing all the way down ... likely those whose structured finance money machine was grinding to a halt.

However, what short sellers need most is some way to draw in sellers. And if fewer players are willing to sell (as increasingly appears the case), then the market's short sellers are fixing to be squeezed. Why? Easy money. You see, the shortest distance between two points is not a straight line. Rather, it is the path of least resistance.

This is time when sharks begin eating each other.


NYSE weekly

None of this cancels out the likelihood significant resistance exists overhead. Some (many?) who went long mid-September '08 (Lehman bankruptcy week) ... having held their position all the way down ... probably will welcome any opportunity to get out somewhere near even.

(Recall there was a considerable pickup in volume the week Lehman Brothers failed. So, there likely are plenty of players who went long that week itching to get out.)

This puts resistance in the NYSE Composite somewhere in the vicinity of 8000 ... right about where the lower end of its channel containing five waves from 1974 was violated to the downside last year.

Now, it's quite some way from here up to this area where overhead resistance can be expected. Yet finding reasonable rationale for anticipating subdued selling pressure, probability increases the path of least resistance, near-term, is higher.

Furthermore, this move could manifest by way of the mother of all short squeezes. This view, of course, is driven by Elliott Wave considerations, as well as underlying technical conditions showing strength building. Just how quickly the market rises to its identified resistance is entirely a matter of speculation, though.

Beyond uncertainty projecting the speed at which the market might melt up, it is difficult imagining the market falling apart so soon after last year's performance. Likewise, despite the market having entered a corrective period whose Elliott Wave counterpart is the 1929-1932 collapse, chances are the wave form to unfold in the present instance will be of an entirely different complexity and duration (likely lasting longer).

In fact, one might still anticipate a further fall to the area where indexes last traded in 1994 sometime over the next few years, and yet suppose the market's correction of its gains from 1932-2007 might not be completed. In light of this possibility indexes subsequently could even rise to new, all-time record highs sometime over the next ten years ... and yet only be setting up for still another fall ... one whose impact quite possibly proves most devastating of all.

The point here simply is, despite fundamental vulnerabilities, there are several ways in which the stock market might be impacted over the weeks, months and years ahead. Near-term, the outlook remains positive, so I am remaining long the stock market, enduring sharp breaks for as long as they look to be quickly recovered...


Fast Money
* * * * *

© The Risk Averse Alert — Advocating a patient, disciplined approach to stock market investing. Overriding objective is limiting financial risk. Minimizing investment capital loss is a priority.

Analysis centers on the stock market's path of least resistance. Long-term, this drives a simple strategy for safely investing a 401(k) for maximum profit. Intermediate-term, investing with stock index tracking-ETFs (both their long and short varieties) is advanced. Short-term, stock index options occasionally offer extraordinary profit opportunities when the stock market is moving along its projected path.

Nothing is set in stone. Nor is the stock market's path of least resistance always known. More often than not, there are no stock index option positions recommended.


There's an easy way to boost your investment discipline...

Get Real-Time Trade Notification!

Thursday, January 22, 2009

Bank Nationalization Day Near?


All the chitter chatter on CNBC today about bank nationalization ... where did it come from?

Are you concerned about the financial future? Do you fear the worst?

Then, as soon as you finish reading, write your state's U.S. Senators and relay what Schumer learned from me today:
Dear Senator Schumer:

Why is AIG being allowed to auction off its most profitable businesses?

Why is not the government taking over these units in exchange for backing all the bad CDS AIG wrote?

Seeing AIG's Asian Life Assurance business unit is profitable and seeing how tax liabilities are bound to rise as a consequence of financial bailouts, does it not make sense that our Federal government receive the benefit of revenue streams from businesses whose irresponsible actions have necessitated a capital infusion from the taxpayer? It is bad enough AIG's rescue became necessary. But that we allow legitimate revenue streams go to the highest bidder borders on criminal insanity.

Respectfully,
Tom Chechatka
Rochester, NY


If you're interested I elaborate these thoughts further in, "Nationalization is as American as Apple Pie."

The question is whether bank nationalization is, in fact, a done deal. If so, Hellooo Melt-up!

Here's an oddity for you. With all the financial fear being played up these days ... where's the rush into short-term U.S. Treasuries?


$IRX

Oh, and one more thing. Those who speak of a "bubble" in Treasuries? Not if the banking system is nationalized it would seem. Uncle Sam's AAA rating surely would be more greatly assured with the benefit of nationalized revenue streams.

These are interesting times, indeed.

And I really like what I am seeing under the stock market's covers...


$BPNYA

It's like early-April '08 ... but better. Lots more relative strength upside potential here ... with the NYSE Bullish Percent positively positioned above its 200-day moving average ... and bullishly diverging from the NYSE Composite Index's performance ... much like the NYSE Cumulative Advance-Decline line (presented yesterday).

Better still (relative to last April) the 200-day moving average on the NYSE Bullish Percent Index is, in fact, rising off a bottom.

All things considered here — technically speaking that is — underlying strength, having been building these past couple months, finds this measure (and its derivatives) at a critical inflection point ... precisely as you'd expect just prior to a melt-up.


Fast Money
* * * * *

© The Risk Averse Alert — Advocating a patient, disciplined approach to stock market investing. Overriding objective is limiting financial risk. Minimizing investment capital loss is a priority.

Analysis centers on the stock market's path of least resistance. Long-term, this drives a simple strategy for safely investing a 401(k) for maximum profit. Intermediate-term, investing with stock index tracking-ETFs (both their long and short varieties) is advanced. Short-term, stock index options occasionally offer extraordinary profit opportunities when the stock market is moving along its projected path.

Nothing is set in stone. Nor is the stock market's path of least resistance always known. More often than not, there are no stock index option positions recommended.


There's an easy way to boost your investment discipline...

Get Real-Time Trade Notification!

Wednesday, January 21, 2009

The Legislative Improbability of a Financial Meltdown


I'm not going to micro-analyze the stock market tonight. Truth is yesterday's low could be retested. This is not outside the realm of possibility following today's installment of volatility '09.

Pat on the back time...

Flashback December 31, 2008: Volatility to Usher in the New Year?

BINGO!

Don't confuse this, though, with the freak show that passes for journalism these days. In other words, there is good reason to temper one's sense of urgency hastened by the fact our financial system is bankrupt. Without a single piece of legislation yet passed into law under the new administration, there's little chance imperialist sharks are about to shock Congress to its senses and bring it to immediately declare null and void all manner of debt securities created on Wall Street and the City of London over the past 20+ years.

And toward this necessary task, apparently, only the Congress offers any hope of affecting its accomplishment. Clearly, the Treasury Secretary-designate is a Eunuch. So, until proven otherwise, this makes his boss the same as the old boss ... which to little ol' you and me is about as worthless as could possibly be.

Pity I see many of the same jellyfish in Congress as were swimming there before the election. Surely, last year's Emergency Economic Stabilization Act and its $700 billion TARP demonstrates how easily jellyfish can be moved.

However, the one thing making today different is the simple fact political cover once amply provided by the Executive branch has left the building. The last line of imperialist defense against 100-1 opposition to financial bailout is no longer available.

It's a big deal, especially during this time of transition. The work of thieves is made more difficult.

Now, do you suppose I might have some technical presentation backing my claim that, no unpleasant surprise is about to sweep over the stock market ... the sort of thing that might bring the Congress to move strongly against Wall Street?

As I indicated yesterday, it appears strong hands are sitting back, and allowing selling to play to their advantage. Today, I bring you evidence suggesting shares are, indeed, being accumulated...


$NYA
$NYAD cumulative

This is the Cumulative NYSE Advance-Decline line. As you can see, there has been no wholesale dumping of stocks over the past two weeks. In fact, downside pressure appears to have been rather well contained.

What's most revealing is the divergence between the NYSE Composite and the Cumulative NYSE Advance-Decline line. The latter suggests the majority of stocks have been well-supported since the November 21, 2008 bottom. Contrarily, the former gives the appearance stocks remain under considerable pressure.

This contrast is intuitively harmonious with yesterday's observation regarding diminishing volume of shares exchanged during the present sell-off. It substantiates my claim we are witnessing a bear trap.


$COMPQ
$NAAD cumulative

Interesting. The Cumulative NASDAQ Advance-Decline line is not quite as compelling. Yet we can at least say the stock exchange favored by boiler rooms all across America is showing a pulse ... barely.

Contrasting the NASDAQ Composite's performance to the NYSE ... seeing how on the surface NASDAQ appears to be performing better ... holding up as one would expect in a market assumed poised to move higher ... taking its typical leadership role (which for years it has done in both directions) ... then seeing how under the covers (as reflected by the Cumulative NASDAQ Advance-Decline line) NASDAQ does not at all appear convincingly healthy ... we have something of a [not-so-faint] red flag to check back on, post-melt-up.

I would be glad to see the market hold up now and begin on its course to a new, post-November 21st high. However, if strong hands must put the fear of chaos into the hearts of most casual observers over the next day or three ... well, I will be neither surprised nor disappointed.

Today was a taste of the melt-up to come. Patience...


Fast Money
* * * * *

© The Risk Averse Alert — Advocating a patient, disciplined approach to stock market investing. Overriding objective is limiting financial risk. Minimizing investment capital loss is a priority.

Analysis centers on the stock market's path of least resistance. Long-term, this drives a simple strategy for safely investing a 401(k) for maximum profit. Intermediate-term, investing with stock index tracking-ETFs (both their long and short varieties) is advanced. Short-term, stock index options occasionally offer extraordinary profit opportunities when the stock market is moving along its projected path.

Nothing is set in stone. Nor is the stock market's path of least resistance always known. More often than not, there are no stock index option positions recommended.


There's an easy way to boost your investment discipline...

Get Real-Time Trade Notification!

Tuesday, January 20, 2009

Wall Street Stumbles into British Empire Bankruptcy


Odds today's selling continues over days ahead are about as near zero as you could hope for. Mercifully, all the blather coming from commentators whose world ended last year should go away. (Financials were no less bankrupt two weeks ago than they are today.) In all probability an explosive rally is moments from sweeping over the stock market.

This truly is one of those instances where Patience Pays. That's because a decline entirely in the realm of possibility has proceeded as projected and appears to have completed precisely as one should both expect and demand.

Today's collapse appears only to have further deepened the bear trap characterizing trading over the past two weeks. Sure, it is true stocks can fall of their own weight. Yet considering how plainly ... and how suddenly over the past two weeks .. the sell-side of the trade has come to dominate ... well, you can either take this moment as an opportunity to think like a billionaire ... and let it be ... let it play into your hands ... or sell into a trap. Because that's what billionaires are doing: they're sitting back. That's why volume has dropped off. They're saying, "Come to Papa."

Don't get me wrong. If it appears I go out on a limb speaking with certainty, the evidence backs me up. Likewise, any view toward some future probability can change in a day. Yet today, I am here to report, my view didn't change one bit. The technical case continues supporting the probability of a melt-up.


NYSE 5-min

Here you see typical price-RSI behavior. Last Thursday's RSI spike — bettering the previous Thursday's RSI peak — marks typical fourth wave RSI behavior relative to RSI registered during a second wave.

Being wave c of (b) has been forming these past nine days, RSI coinciding with wave 5 could even fall below the worst RSI reading registered during the formation of wave 3 (last Wednesday ... and Monday before that).Typically, though, RSI registering during a fifth wave will fall short of that registered during a third wave ... much as thus far has been the case in the present instance.

So, today's dud — another "sorry, no buyers" start to the day ... resulting in another steep RSI thud ... another manufactured imbalance — sees RSI behaving typically. Indeed, for the sake of the case calling for a pending melt-up it would be constructive if improving underlying strength persists. Yet being a "c" wave is forming ... and given this wave's character thus far ... there's a chance RSI could collapse to a new, extreme sell-side low. It could happen tomorrow ... at the open seems most likely.


$NYA

Daily RSI's downward acceleration today ... on diminishing volume ... on volume no where near its elevated levels of late November ... the last time RSI was this weak ... has but one impact on my view. It confirms it. The steep dive RSI took today on diminishing volume is a dead giveaway today's decline simply was allowed ... indeed, encouraged.

Those crafty British! Manufacturing a banking crisis at a most curious time in our nation's history ... when the first of a race they first enslaved was to become President. Crafty limey slime buckets handing the stock market its worst Inauguration Day loss in history. I should have seen the filth coming.

Now bring on the uptick rule ... and let discussion of strategic bankruptcy begin.


$COMPQ

Well, lookie there. The more easily moved NASDAQ is holding up relatively better than the Big Board ... just as it should prior to a melt-up. Surely, the businesses trading on NASDAQ need financing, no? So, where's the fear rattling the big name financials? 'Nuff said.


$VIX

Sorry... not buying into September-October volatility repeat thesis. Look at it this way. The financial crisis is closer to being effectively addressed now that its political cover has left on a helicopter and a wheelchair (good one, Darth!).

So, in as much as Friday's VIX collapse was a concern, today's surge contrarily is rather encouraging.

The velocity of RSI's ascent rivals the mid-September period when Lehman Brothers entered into bankruptcy. Yet the worst for the moment in our unraveling financial crisis clearly appears set to be decisively addressed (rather than momentarily papered over with a wall of money and a wink). So, what gives with the "nameless, unreasoning, unjustified terror which paralyzes needed efforts to convert retreat into advance?"

That's all today's selling was (as will be any follow-through tomorrow morning)...


Fast Money
* * * * *

© The Risk Averse Alert — Advocating a patient, disciplined approach to stock market investing. Overriding objective is limiting financial risk. Minimizing investment capital loss is a priority.

Analysis centers on the stock market's path of least resistance. Long-term, this drives a simple strategy for safely investing a 401(k) for maximum profit. Intermediate-term, investing with stock index tracking-ETFs (both their long and short varieties) is advanced. Short-term, stock index options occasionally offer extraordinary profit opportunities when the stock market is moving along its projected path.

Nothing is set in stone. Nor is the stock market's path of least resistance always known. More often than not, there are no stock index option positions recommended.


There's an easy way to boost your investment discipline...

Get Real-Time Trade Notification!

Saturday, January 17, 2009

A Friendly Dr. Melt-Up Supplemental Checkup


Even assuming a 5-wave decline unfolded from May 19, 2008 - November 21, 2008 ... what lies ahead is subject to possibilities I have yet to discuss.

To now I have been assuming the market's decline since October 2007 has taken the form of an (a)-(b)-(c) Elliott Wave "corrective" pattern. Wave (c), it is assumed, was formed by the 5-wave decline from May - November, 2008.

One reason I am assuming this particular Elliott Wave view ... and not one supposing wave (a) [beginning October 2007] might still be in the process of forming ... simply is due to the depth of damage done ... May - November, 2008 ... during the worst period in the stock market since the Great Depression.


NYSE weekly

Now, it is possible that, since October 2007, waves 1, 2 and 3 of wave (a) have formed. In this case waves 4 and 5 should be expected before wave (a) is completed.

You see above my typical markings distinguishing RSI extremes reached during the course of the NYSE Composite's three waves down since October 2007. Indeed, it is the relative depth to which weekly RSI sank in October 2008 bringing me to view the market's decline from May - November, 2008 as more appropriately labeled wave (c) [of an (a)-(b)-(c) decline from October 2007] rather than wave 3 of (a).

Yet, what if I am wrong? What if waves 4 and 5 of (a) are about to form?

Well, consider RSI analysis I detailed yesterday. Do you see how much weekly RSI might be expected to improve during the formation of wave 4 of (a)? It should rise above the level it reached in May 2008.

So, no matter what's to come — whether it's a rally countering the market's (a)-(b)-(c) decline from October 2007 ... or a more or less sideways trade forming wave 4 of (a) — we can expect weekly RSI to improve.

Still, even here, nothing is set in stone...

Assuming an (a)-(b)-(c) Elliott corrective wave [down] unfolded from October 2007 - November 2008, looking forward we can expect a counter-trend rally likewise taking an (a)-(b)-(c) form. Indeed, this is my preferred view right now.

Now, here's the thing. As this expected counter-trend rally unfolds wave (b)'s formation could lead to November's low being taken out. This, indeed, is a distinct possibility. Furthermore, this could even happen well-before weekly RSI recovers to levels last seen in May 2008.

It's something to keep an eye on.

And also something saying you should keep your head should it, in fact, come to pass. Any move below November's low preceding a substantial recovery in weekly RSI — one bringing RSI to levels last seen in May 2008 — likely will be followed by a screaming rally.

The BIG question right now is whether wave (a) of the market's (a)-(b)-(c) counter-trend rally (my preferred view right now) completed at the start of the New Year. I simply do not believe it has. There have been no telltale signs — technical divergences — to suggest there's trouble ahead.

* * * * *

© The Risk Averse Alert — Advocating a patient, disciplined approach to stock market investing. Overriding objective is limiting financial risk. Minimizing investment capital loss is a priority.

Analysis centers on the stock market's path of least resistance. Long-term, this drives a simple strategy for safely investing a 401(k) for maximum profit. Intermediate-term, investing with stock index tracking-ETFs (both their long and short varieties) is advanced. Short-term, stock index options occasionally offer extraordinary profit opportunities when the stock market is moving along its projected path.

Nothing is set in stone. Nor is the stock market's path of least resistance always known. More often than not, there are no stock index option positions recommended.


There's an easy way to boost your investment discipline...

Get Real-Time Trade Notification!

Friday, January 16, 2009

Dr. Melt-Up Checks Market Pulse, Finds Budding Life


Before I speak one more word about melt-up prospects, let me humble this outlook with appropriate due given to other possibilities, because nothing is set in stone.

Nothing is set in stone... This is something I say now and again, and with good reason. Quite simply, new developments, impossible to foresee, incite a need to assess probabilities.

As you know, I use various underlying technical measures to substantiate my Elliott Wave analysis. These help identify Elliott Wave forms. Each Elliott Wave — whether impulse or corrective — has a defined character. Underlying technical measures help isolate one wave from another, and allow one to distinguish each wave by its character in relation to the others. Waves joining to form some larger construct — be it a 5-wave, "impulse wave" or a 3-wave, "corrective wave" — all are subject to this analysis.

My concern today is with the 5-wave decline from the May 19, 2008 peak. These five waves are thought to form wave (c) of an (a)-(b)-(c) corrective wave that began October 2007.


$NYA

Underlying technical measures corresponding with a five-wave decline typically register their worst readings during the formation of respective third waves. That's because third waves generally are the most powerful ... the most dynamic ... of all Elliott waves.

These same technical measures typically begin showing improvement — underlying strength building — upon the formation of respective fourth and fifth waves of a five-wave decline.

One measure demonstrating this phenomena is RSI (the Relative Strength Index).

Now, about my present concern... The red line drawn in the RSI panel begins at the NYSE Composite's RSI peak in late-August. This marks RSI's best reading during the formation of what might be assumed wave 2 of five waves down from May 19, 2008.

This line extends to the present. It intends to show the level beyond which RSI might be expected to rise ... coincident with the formation of wave 4 of five waves down for May 19th. Again, this is assuming five waves down from May 19, 2008 have not completed.

You have seen this before. Over the course of the market's bounce off November bottom I have been anticipating the likelihood NYSE Composite RSI would exceed its late-August peak. Thus, until such time as relative strength improved as anticipated, I assumed the market's rally would continue.

Well, as you can see, the magic moment came during the advance leading into the New Year.

So, the question here is whether the rally off November's bottom merely forms wave 4 of five waves down from May 19, 2008?

This is an important question because if the answer is in the affirmative, all my talk about a pending melt-up will leave me looking like an idiot (proving once again how I am my own worst enemy). Wave 5 [of (c)] down would see to that.

Now, typically, I use red dots to depict price-RSI relationships coincident with a five-wave decline.You see these above, corresponding with [presumably] waves 1-4 since May 19, 2008.

(Bear in mind these red dots mark the most extreme RSI reading registered during the formation of any given wave. Each may or may not mark the actual end of the wave in question.)

So, considering the price-RSI configuration shown above by the red dots (revealing a rather typical relationship among each of the waves), you should gather why I am concerned about possibilities. Although underlying conditions are improving, nothing prevents this improvement from being furthered on a retest of November's low. As such, any near-term outlook calling for a melt-up might be challenged.

Now... what if five waves down from May 19, 2008 are more accurately defined by price-RSI relationships revealed by the blue dots? Thus wave (c), in fact, completed on November 21st.

There's something attractive about this possibility because it draws on Nature's "like from like" principle ... a notion the Elliott Wave Principle and its embrace of the Golden Section has at the core of its being (applying Nature's Law to human psychology in the matter of pursuits involving the making of money).

The first wave down ... from May 19th to September 17th ... itself consists of five waves (which also channeled quite nicely, as you can see above). RSI coinciding with these five waves is shown by the lime green dots I have drawn.

Note how RSI marking the fourth wave of these five waves (late-August '08) just about equals RSI marking the second wave (early-June '08). This is a bit atypical. More often than not RSI will improve during the formation of a fourth wave in relation to the second. In this case it did not. Not a surprise because we are evaluating five waves forming wave (c) ... a third wave ... typically the most dynamic ... where "pull" in the direction of the trend (in this case, down) is generally strongest.

Now, consider RSI coinciding with a larger five wave decline from May 19, 2008 ... marked by the blue dots I have drawn. Note how the fourth wave's best RSI reading (early-November '08) just about matched RSI marking the second wave (September 19, 2008).

RSI coinciding with five waves forming the first wave down from 5.19.08 - 9.17.08 (lime green dots) behaved very much like RSI coinciding with five waves down from 5.19.08 - 11.21.08 (blue dots).

That's the "like from like" principle in action. It's almost as if the RSI configuration during the first wave down (5.19.08 - 9.17.08) provided a "key" to how RSI might behave during the larger five waves down from May 19th through November 21st.

It seems entirely reasonable an Elliott Wave analyst should recognize how this "like from like" principle might take form even in underlying technical measures like RSI. It stands to reason that, whatever psychology defined the market's disposition at the start of the declining period in question, it would persist throughout.

To conclude this lead-off topic, then, you clearly see how RSI shows third waves to be the most dynamic, as well as how fifth waves [of a declining impulse wave] reveal improving underlying strength. Each of the three, 5-wave, Elliott impulse waves you see above — lime green dots: wave 1 of (c) ... white dots: wave 3 of (c) ... and blue dots: wave (c) — demonstrate this.

Now, about whether the market's bounce off November's bottom is but the fourth wave of five waves down since May 19, 2008 (returning to the red dots)... This still is an open possibility. Nothing is set in stone. I wish to acknowledge this in light of the outlook I have expressed lately.

This is particularly critical since trading has proceeded much as was thought possible on January 2nd. A decline is a decline ... and just because I foresaw its possibility does not mean what I thought might follow (i.e. melt-up), indeed, will come to pass. There is in fact a constant need to reassess probabilities given ever-changing conditions.


$VIX

Just yesterday we looked at the VIX. Let's examine this a little closer and consider things that appear to be saying, "Danger Will Robinson!"

First, there's today's sharp pullback in the VIX itself. Without going into detail let's simply note how this might demonstrate [unwarranted?] complacency.

(Then again, the news just might be that good ... at least as this affects the market's near-term prospects. That a new flavor of recent months' financial rescue attempts is being floated at a time when stocks affected by this find themselves at a point where a sharp bounce might reasonably be expected ... with this new development likewise coinciding with the upcoming, portentous change in Washington ... it seems we have circumstance making it worth pondering again How to Think Like a Thief.)

Consider next the sharp upturn of MACD on the VIX index. This, of course, has negative implications. It's a turn in the wrong direction for someone anticipating a market melt-up. However, let's not lose sight MACD remains on the right side of its balance (as this pertains to VIX, negative MACD implies a market whose underlying strength is improving).

Next in the parade of worries the VIX presents is the current RSI similarity to two periods last year — late-February and late-May. In both instances the market succumbed to additional selling pressure.

Yet consider VIX RSI at the present moment in relation to early-November. Much like then, VIX RSI stands at an inflection point located in the middle of its range. This is where the market's so-called "buy-side" and "sell-side" interests are balanced.

Back in early-November the sell-side won the day after VIX RSI fell to this point of balance among interests. So, what might be next ... now that VIX RSI has risen to this same point of balance? Might the market's buy-side prevail? Time will tell.

And what do we make of VIX RSI extremes (marked by red dots) since the market's May 19, 2008 peak? Do you see how even this derivative technical measure of the market's underlying condition is coinciding with five waves down in quite typical fashion, much as was discussed above? This view of VIX RSI seems to highlight earlier NYSE Composite RSI analysis, suggesting the fifth wave of five waves down since May 19, 2008 might yet unfold.

All told, though, I wouldn't make too much of this. Rather, by noting what appear to be red flags we are being risk averse.

Truth is there's plenty of reason to be optimistic about melt-up prospects. Indeed, you might duly note these "red flags" by and large are countered by other reasonable observations. Reasonable, that is, at least for the moment. Still, these serve to neutralize whatever warnings the VIX might be flashing.

Of course, here is a good deal more evidence supporting the case for a pending market melt-up...


$COMPQ

If we are to assume renewed selling might imminently sweep over the market, then you would think the Pump and Dump, too, would be signaling trouble. However, this plainly is not the case.

The NASDAQ Composite's RSI and MACD configuration differs from that seen earlier in the NYSE Composite. If November's low marked the end of a third wave (of five waves down from early-June), then NASDAQ's present bounce (presumably forming wave 4) has a good bit further to go before the Composite once again turns lower.

Indeed, inasmuch as evidence over recent weeks — presented through the lens of NYSE Composite RSI and MACD — was suggesting the market's bounce off November's low had further to go, the NASDAQ Composite's underlying technical condition likewise is indicating the same.

Again, there is nothing set in stone about this. However, typical RSI and MACD behavior during the formation of a 5-wave, Elliott impulse wave down presently advises one to expect further improvement in both these measures before any sustained decline might roil NASDAQ.

Given this, there's an additional development worth noting here... You see it in the declining line cutting through NASDAQ's gap lower in early-October '08. This line was acting as resistance all the way down to November's bottom, but now it appears to be providing support. Arbitrary as this might seem, there it is, offering graphic evidence underlying conditions are shifting into the positive.

Thus, considering the case suggesting an imminent retest of November's low might be in order here (practically speaking this is, indeed, possible), the likelihood seems slim at best. Instead, the market's next leg higher appears more likely in store.


NASDAQ McClellan

Here you see the manner in which underlying conditions on NASDAQ appear similar to the early-April '08 period. NASDAQ's McClellan Oscillator appears positively poised to sustain a trade looking something like the market's April - May '08 advance.

This, of course, is not the only possibility NASDAQ's McClellan Oscillator supports. Looking at the Summation Index, you begin to suspect constructive, underlying buying interest might be about to hit the brick wall.

So, who knows? Maybe rather than melt-up NASDAQ might drag its way higher. Either way ... all things considered ... it does not appear the Composite is the least bit threatened here.

The fact both the Oscillator and the Summation Index both diverged at their respective November '08 bottoms (relative to October) remains significant. Likewise, the Summation Index has made an impressive comeback — demonstrating genuine underlying buying interest apparently intending to stick around (rather than trade in and out). This suggests strong hands are sinking capital into the market. Time will tell how long they stay.


NASDAQ 5-min

You gotta like how things are shaping up here. Today's comeback finishing near the day's high ... taming RSI ... bringing the buy- and sell-side into balance ... was about as nice a performance as you could ask for ... given the past couple days' RSI whipsaw.


NYSE 5-min

Enee, meenee, mynee, mo ... which way does RSI suggest we'll go?


NYSE McClellan

And here? (Consider this question from the perspective of support and resistance each of the NYSE McClellan indicators faces.)
Bottom line: Any Eunuch who reads this post slowly and carefully (what else does one have to do?) should realize why now probably is not the most fortuitous time, financially speaking, to be nutless...


Fast Money
* * * * *

© The Risk Averse Alert — Advocating a patient, disciplined approach to stock market investing. Overriding objective is limiting financial risk. Minimizing investment capital loss is a priority.

Analysis centers on the stock market's path of least resistance. Long-term, this drives a simple strategy for safely investing a 401(k) for maximum profit. Intermediate-term, investing with stock index tracking-ETFs (both their long and short varieties) is advanced. Short-term, stock index options occasionally offer extraordinary profit opportunities when the stock market is moving along its projected path.

Nothing is set in stone. Nor is the stock market's path of least resistance always known. More often than not, there are no stock index option positions recommended.


There's an easy way to boost your investment discipline...

Get Real-Time Trade Notification!