Monday, March 31, 2008

Henry Potter Paulson Launches "Project Trojan Horse"


Treasury Secretary "Henry Potter" Paulson, doing his best Nero impersonation, whipped up allies on Weimar Street with a rousing speech whose most notable accomplishment was to take video media full circle. What began with motion pictures, absent sound, yet full of meaning, having long been enhanced with audio, is now completely losing all mass appeal with voices seemingly incongruent. This, however, simply reflects the utter dullness of a wide audience unskilled in reading between the lines.

The star of "It's a Wonderful Knife" should get an Oscar Nomination. The brutality of Potter's dialog scripted as a thinly veiled genuflection to the Gods of the black magic of the marketplace (a.k.a. the City of London) might have been lost on all who mistakenly believe the holders of such high offices as U.S. Treasury Secretary serve the People in the interest of Posterity, but all with ears that hear understood the sound of financial terror soon to make Bear Stearns look like a Sunday stroll through Central Park on a sunny, summer day.

The speech that seemed to say nothing of significance was, instead, given by a modern-day Odysseus leading troops concealed in the belly of a magnificent horse. Surely, the intent is no different than what ancient warriors had slated Troy to suffer. Chaos and destruction are to reign. Trusting souls alone, oblivious of grave danger within, would accept the monstrosity of a magnificent deception without even so much as question the dream-like scene before their very eyes. Project Trojan Horse is a go, and Secretary Paulson simply has done his part to incite his Wall Street allies to battle.

Look kids, money men like Potter lead busy lives. They certainly do not waste their time saying nothing. Despite such ridiculous financial reform as Wall Street's Odysseus' having as much hope, today, as a snowball in Hades, the "nonsense" of Paulson's message might best be seen as a bellows cleverly concealed to fan the flames. Yes, voices in the mainstream smell smoke. Yet, apparently the fog is too thick to see how complete is the imagery of Nero fiddling while Rome burns. Chaos and destruction are the aim of Project Trojan Horse.

OEX 5-min
My thanks to Tony Nelson for seeing it in his heart over the weekend to allow Jeannie to blink me tomorrow's Wall Street Journal. You can read Friday's Risk Averse Alert commentary if you haven't already. As per what to expect Tuesday, it might be as dull as the minds who simply do not fathom the utter brutality of the Washington - Wall Street axis.

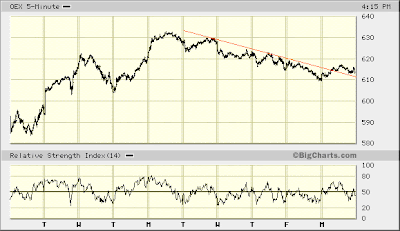
Right now, I should only add to Friday's remarks my diminished willingness to suppose the S&P 100 rising toward the 630 area might present an opportunity to take on a quick OEX "short" position. It seems quite possible the S&P 100 could fluctuate in a fairly narrow range for the duration of this week. Thus we might not likely see the kind of volatility in one direction or the other critical for profitable options play.


* * * * *

© The Risk Averse Alert — Advocating a patient, disciplined approach to stock market investing. Overriding objective is limiting financial risk. Minimizing investment capital loss is a priority.

Analysis centers on the stock market's path of least resistance. Long-term, this drives a simple strategy for safely investing a 401(k) for maximum profit. Intermediate-term, investing with stock index tracking-ETFs (both their long and short varieties) is advanced. Short-term, stock index options occasionally offer extraordinary profit opportunities when the stock market is moving along its projected path.

Nothing is set in stone. Nor is the stock market's path of least resistance always known. More often than not, there are no stock index option positions recommended.


There's an easy way to boost your investment discipline...

Get Real-Time Trade Notification!

Friday, March 28, 2008

Financial Titanic UBS Scuttles Lifeboats to Buy Minutes


Monday, the S&P 100 could start with a bounce for the very same reason this was correctly forecast to occur today. Quite simply, with RSI diverging as the S&P 100 has fallen lower over the last few days, one can reasonably expect a rally. Today's trading only extended yesterday's RSI divergence. Thus, again, we might expect the stock market to bounce on Monday. If not at the open, then sometime soon after.

Monday's rally might also be a bit more dynamic than was the case at today's open. Indeed, next week could see the S&P 100 rise at least to the vicinity of 620 +/- and possibly even approach 630. However, unlike my uncertainty yesterday about what would follow today's bounce, next week's probably will be followed by selling taking the S&P 100 down to the 590-600 range. The manner in which this week's trade has progressed seems to assure this.


OEX 5-min
I continue to expect the intra-day low on Monday, 3/17 to hold up. Rather than speculate about how "strong hands might wish to create conditions that rattle weaker hands to give up more of their shares," as was suggested yesterday, let's first see how things play out early next week. I'd really like to see the S&P 100 drop to the 590-600 range before pondering any further about how things might play out over the next several weeks.

One thing I am fairly confident about is the stock market probably will not trade outside the range it has been stuck in for the past two and a half months over much of the month of April.


$OEX
Should the S&P 100 move toward either end of the channel drawn in the chart above, there might be a good, short-term play (i.e. 1-2 days) worth recommending. What we are really looking for, though, are opportunities to score huge gains in the coming stock market melt-up. It should be a dandy. As long as the ongoing destruction of the financial system continues to be contained with copious loads of liquidity and federal guarantees, stocks should rise spectacularly despite the real, physical economy increasingly showing signs of collapsing...


News To Abuse

So, what do we make of a huge financial institution that abruptly cuts by upwards of 20+% the value of securities marketed as a "cash alternative" (i.e. presumably safe)? Union Bank of Switzerland (UBS) just did this with its clients' holdings of auction-rate securities. See this Wall Street Journal article.

At a time when central bankers can't flood the global financial system with liquidity fast enough, couldn't UBS have waited until Bazooka Joe cartoons soon were deemed "valuable" collateral accepted at a Weimar Bank near you? The stench of Bear Stearns grows thicker. The question is which cesspools of filthy scum masquerading as respectable financiers and politicians about to move in for the kill on UBS first demanded this pound of flesh from trusting clients of the bank? Chances are we will know soon enough...


company chart (UBS)

* * * * *

© The Risk Averse Alert — Advocating a patient, disciplined approach to stock market investing. Overriding objective is limiting financial risk. Minimizing investment capital loss is a priority.

Analysis centers on the stock market's path of least resistance. Long-term, this drives a simple strategy for safely investing a 401(k) for maximum profit. Intermediate-term, investing with stock index tracking-ETFs (both their long and short varieties) is advanced. Short-term, stock index options occasionally offer extraordinary profit opportunities when the stock market is moving along its projected path.

Nothing is set in stone. Nor is the stock market's path of least resistance always known. More often than not, there are no stock index option positions recommended.


There's an easy way to boost your investment discipline...

Get Real-Time Trade Notification!
Thursday, March 27, 2008

Relative Strength Divergence Signals a Stock Market Bottom


Having mentioned in yesterday's commentary "the stock market's multi-month decline since last October ... has been but part of a larger corrective pattern that began last June" I wanted to present you this view. I am not about to explain the details about this "larger corrective pattern." Not that it isn't important. But for the task at hand — identifying low-risk OEX options plays — there really are better things to elaborate (if only for the sake of brevity).

I will say this, though, and again, this is for the record. Yesterday, I mentioned that, "following any significant advance over the weeks ahead there could be another steep decline taking major stock indexes (the S&P 100 included) right back down to present levels, or even a bit lower." Well, I believe this possibility has only a 20-30% probability of occurring. Again, I am not going to delve into the reasons why I believe this. It simply does not serve the task at hand. Someday, though, it will.


$OEX
Yesterday, too, I shifted gears in my analysis of where the S&P 100 might likely go from here. Previously I had been anticipating a return to the area of recent lows set on Monday, 3/17. However, I no longer suppose this is the likely path of least resistance. I should mention the McClellan Oscillator for both the NYSE and NASDAQ support this alternate view that the stock market has, indeed, bottomed.

Furthermore, the volume of shares traded on both stock exchanges over the past three days also supports this view. Volume has noticeably declined. This, while indexes have more or less marked time, modestly declining. I view this as indicative of accumulation, particularly given the moment. Consider all the pressure the stock market has been under so far this year. Were there an overwhelming conviction the stock market had further to fall, the volume of shares traded this week would have come in somewhere much nearer its recent average. Quite the contrary has happened instead. So, the money that drove the stock market higher last week belongs to strong hands. They're holding on, and not selling, despite this week's lack of follow-through to last week's rally.

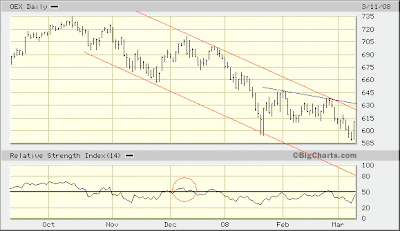
Further evidence can be seen in the above chart. Take a look at the mark-up I have drawn.

The red line under RSI is meant to provide a like comparison of the July - September '07 period to the January '08 - present period. The black ticks mark RSI lows. The second tick in each period points out RSI divergence (this was ever so slight in '07). The picture, I think, speaks for itself. The S&P 100's path of least resistance over the weeks ahead appears to be up.

The blue line you see drawn above RSI's high last October is a benchmark. The coming stock market advance should carry the S&P 100's RSI above this level.

Now, the important question is when will this rally happen? Is it imminent, or has this week's trading set an indecisive tone for some days to come? It seems to me strong hands might wish to create conditions that rattle weaker hands to give up more of their shares.


OEX 5-min
It looks like the stock market probably will bounce at Friday's open, but then what? Well, we will just wait and see. It probably is not yet time to consider taking a position.


* * * * *

© The Risk Averse Alert — Advocating a patient, disciplined approach to stock market investing. Overriding objective is limiting financial risk. Minimizing investment capital loss is a priority.

Analysis centers on the stock market's path of least resistance. Long-term, this drives a simple strategy for safely investing a 401(k) for maximum profit. Intermediate-term, investing with stock index tracking-ETFs (both their long and short varieties) is advanced. Short-term, stock index options occasionally offer extraordinary profit opportunities when the stock market is moving along its projected path.

Nothing is set in stone. Nor is the stock market's path of least resistance always known. More often than not, there are no stock index option positions recommended.


There's an easy way to boost your investment discipline...

Get Real-Time Trade Notification!

Wednesday, March 26, 2008

Fed Feeding the Wrong Kind of Animal Spirits on Wall Street


OEX 5-min
I am not so sure the S&P 100 "needs" to retest its Monday, 3/17 intra-day low. This is contrary to what I thus far have been suggesting with reference to intermediate-term RSI (more on this below).

The "form" the S&P 100 has taken since last Wednesday's (3/19) high suggests the stock market may be about to explode higher. Other stock indexes support this view as well.


$OEX
Although I have been suggesting intermediate-term RSI would rise above its December high before the S&P 100 turned lower and challenged last week's low (set on Monday, 3/17), there is no denying the kind of RSI divergence one might expect at a bottom has already formed.

Now, the possibility I mentioned above, suggesting the stock market might explode higher (say, tomorrow and Friday), could turn out to be something like a "false positive" medical test. We'll probably know for sure sometime tomorrow. If the S&P 100 does not launch higher, then it probably will break down to the 590-600 range. Yet, even were this to happen I suspect the stock market might sooner rocket higher than I have been suggesting prior to today.

The more I look at the big picture — the nearness to which all major indexes are to points at which, were they to fall below, the stock market might likely thereafter collapse spectacularly — the more I am persuaded last week's low represents something of a strong floor.

Bottom line, the stock market's multi-month decline since last October might have ended with the Bear Stearns take-down. However, this decline has been but part of a larger corrective pattern that began last June. So, even if the stock market rises over the weeks ahead — to the point of challenging last October's high or possibly even exceeding it — the anticipated stock market melt-up part and parcel with the Risk Averse Alert's "long-term" forecast might still face a late spring or early summer speed bump. In fact, following any significant advance over the weeks ahead there could be another steep decline taking major stock indexes (the S&P 100 included) right back down to present levels, or even a bit lower.

That's a bit of forward thinking stated for the record.


* * * * *

© The Risk Averse Alert — Advocating a patient, disciplined approach to stock market investing. Overriding objective is limiting financial risk. Minimizing investment capital loss is a priority.

Analysis centers on the stock market's path of least resistance. Long-term, this drives a simple strategy for safely investing a 401(k) for maximum profit. Intermediate-term, investing with stock index tracking-ETFs (both their long and short varieties) is advanced. Short-term, stock index options occasionally offer extraordinary profit opportunities when the stock market is moving along its projected path.

Nothing is set in stone. Nor is the stock market's path of least resistance always known. More often than not, there are no stock index option positions recommended.


There's an easy way to boost your investment discipline...

Get Real-Time Trade Notification!

Tuesday, March 25, 2008

Financial Rocket Scientist Predicts Explosive Stock Market Launch


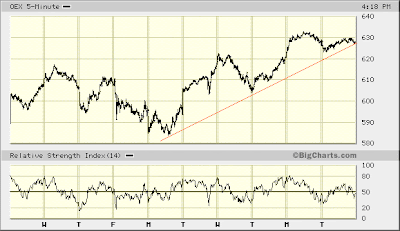
Not sure the line of support drawn below will amount to anything tomorrow...


OEX 5-min
Intermediate-term RSI (seen below) is improving as expected. I would only add its ultimate divergence from its December high might have still further to go...


$OEX
Once the S&P 100 turns lower again, as expected, might it fail to fall below last Monday's (3/17) intra-day low before exploding higher? The longer-term view of the S&P 100 suggests this is possible...


$OEX

That's all for now.


* * * * *

© The Risk Averse Alert — Advocating a patient, disciplined approach to stock market investing. Overriding objective is limiting financial risk. Minimizing investment capital loss is a priority.

Analysis centers on the stock market's path of least resistance. Long-term, this drives a simple strategy for safely investing a 401(k) for maximum profit. Intermediate-term, investing with stock index tracking-ETFs (both their long and short varieties) is advanced. Short-term, stock index options occasionally offer extraordinary profit opportunities when the stock market is moving along its projected path.

Nothing is set in stone. Nor is the stock market's path of least resistance always known. More often than not, there are no stock index option positions recommended.


There's an easy way to boost your investment discipline...

Get Real-Time Trade Notification!

Monday, March 24, 2008

Tony Nelson Takes Back Wall Street Journal Jeannie


Last week I referenced the I Dream of Jeannie episode in which Jeannie blinks in the next day's newspaper, and I claimed the Risk Averse Alert was just like receiving the Wall Street Journal a day early. Two straight weeks calling just about every twist and turn ... had gone quite well.

I indicated this is not necessarily what I intended here. However, sometimes the need to forecast something specific is just too great. Trouble is this kind of thing can be easily misconstrued as an attempt to present actionable advice meant to facilitate profitable day trading. This is not at all what I am striving for!

Truth is it probably is better sometimes to just let the minutia work itself out, and keep an eye on generalities whose passing solidifies an anticipated view toward the stock market and confirms approaching prospects for profiting with an S&P 100 stock index options position. This is how, today, I judge with hindsight last Thursday's commentary.


$OEX
What really needs stressing simply is the expected effect the S&P 100 tracing out its much anticipated counter-trend rally will have on intermediate-term RSI. We are (as we have been) specifically looking for RSI to rise above its high last December, while the S&P 100 remains stuck within the range it has traded over the past two months. Just how this specifically develops is not a big concern.

This pending RSI divergence is prerequisite to the stock market embarking on the final leg of its multi-month decline and registering a bottom from which it might begin its anticipated melt-up.

(Whether, in fact, the stock market will immediately launch into melt-up mode, or will continue trading sideways ... bounded by the range between the pending bottom and last October's highs ... remains to be seen. Either way, sometime during the months ahead the stock market is expected to spectacularly melt up.)

Today's trading confirms the 630-645 range is where the S&P 100's current counter-trend rally likely will peak. At this point there is no reason to lower this objective as was suggested last Thursday.


OEX 5-min
Now, the S&P 100 might likely rise further and extend today's advance, so then what (assuming the intermediate-term RSI divergence we are looking for is in place ... which, right now, is not yet the case)?

Will the final leg of the stock market's multi-month decline commence immediately or will something else develop whose net result furthers the divergence of the S&P 100's intermediate-term RSI relative to last December?

We will just have to wait and see...


* * * * *

© The Risk Averse Alert — Advocating a patient, disciplined approach to stock market investing. Overriding objective is limiting financial risk. Minimizing investment capital loss is a priority.

Analysis centers on the stock market's path of least resistance. Long-term, this drives a simple strategy for safely investing a 401(k) for maximum profit. Intermediate-term, investing with stock index tracking-ETFs (both their long and short varieties) is advanced. Short-term, stock index options occasionally offer extraordinary profit opportunities when the stock market is moving along its projected path.

Nothing is set in stone. Nor is the stock market's path of least resistance always known. More often than not, there are no stock index option positions recommended.


There's an easy way to boost your investment discipline...

Get Real-Time Trade Notification!

Thursday, March 20, 2008

Hyper-Inflationary Alchemists Turn BSC Collapse Into Melt-Up Fuel


Quite an impressive rally this afternoon ... call it an "all's clear" mini melt-up ... as this seems what many wish to think. Oddly enough, though, today's view would lower the ultimate near-term objective we have been projecting here (targeting the 630-645 area).


OEX 5-min
Today's advance appears to leave the S&P 100 in a situation similar to late last Thursday (3/13). Coincidentally, last Friday (3/14) opened with the thud of the Bear Stearns take down. We go into a long weekend with no shortage of financial institutions reported at risk of collapsing.

Remarks in yesterday's Risk Averse Alert detailing RSI disparities could be further elaborated following today's reversal of Wednesday's stock market sell-off. Although the S&P 100's recovery fell just shy of yesterday's high, RSI extended higher than any time this week. This stands in contrast with what occurred last Thursday (3/13).

Does this demonstrate an added measure of underlying strength? If so, any pending sell-off early next week might not be as severe, or as steep, as last Friday (3/14).

Then again, who knows? Anticipated selling early next week could be more severe than presently is expected.

One thing striking about RSI reaching a new high for the week today is how the S&P 100 was not rising nearly as sharply as it had on Monday and Tuesday. So, "fear and doubt about the staying power of this week's advance" positively noted yesterday might have evaporated today.

Thus, if present RSI disparity ... relative to last Thursday (3/13) ... is indicative of complacency, look out. This possibility is worth considering particularly since the Risk Averse Alert is projecting the stock market's multi-month decline is not yet over. A "surprise" decline early next week might be a taste of things still to come.

There's little doubt the S&P 100 is basing / correcting / consolidating — whatever you wish to call it. This is as much the case over the past several weeks as it has been over the past ten months. Recent range-bound trading likely will continue for some time to come. Just how so is discussed below...


$OEX
One outcome the Risk Averse Alert has been anticipating is RSI rising above its high in December. This is a first prerequisite to any bottom forming in the stock market's multi-month decline.

Let's look at how this might form...

Observe the period from the S&P 100's January low to its late February's peak around 640. Do you see how RSI trended higher while peaks in the S&P 100 were trending lower? We might be looking forward to much the same result from here.

This is why today's remarks began by suggesting the Risk Averse Alert's outlook to date might need refining. The oft cited objective of the S&P 100's counter-trend rally might need to be lowered.

Thus, it is possible the S&P 100 might be lucky to rise above 630 — the low end of this previously stated objective — before the stock market embarks on the last leg of its multi-month decline and finally bottoms.


This Is Not Your Father's Banking System
Charlie Rose Interview With Paul Volker (3/19/08)


* * * * *

© The Risk Averse Alert — Advocating a patient, disciplined approach to stock market investing. Overriding objective is limiting financial risk. Minimizing investment capital loss is a priority.

Analysis centers on the stock market's path of least resistance. Long-term, this drives a simple strategy for safely investing a 401(k) for maximum profit. Intermediate-term, investing with stock index tracking-ETFs (both their long and short varieties) is advanced. Short-term, stock index options occasionally offer extraordinary profit opportunities when the stock market is moving along its projected path.

Nothing is set in stone. Nor is the stock market's path of least resistance always known. More often than not, there are no stock index option positions recommended.


There's an easy way to boost your investment discipline...

Get Real-Time Trade Notification!
Wednesday, March 19, 2008

Fat Albert Gore Dreams of Gaia, But I Dream of Jeannie


Have you, too, been skeptical about global warming being a man-made danger? Shall we let Al Gore in on our little secret? Because, it is beginning to appear neither the automobile nor coal-fired power plants have a thing on the Risk Averse Alert! This baby has been red hot.

Do you remember that episode of I Dream of Jeannie where Jeannie was upset because no newspaper had arrived at the Nelson home, so Roger, seeing an opportunity, suggested she simply blink in a newspaper? Of course, Roger gives her the next day's date. Armed with the day's horse racing results, he proceeds to the track expecting to clean up.

This is a bit like what has been happening here. You practically have been receiving the next day's Wall Street Journal a day early. This is not necessarily what is intended. The purpose here is not to facilitate successful day trading. Rather, it is to identify low-risk stock index option position entry points principally when the stock market is projected to immediately confirm a recommended position's validity. The foremost objective (and this might seem counter-intuitive) is preserving risk capital. This is why positions not immediately validated by the stock market's movement are closed with haste.

Obviously, striving for some reasonable semblance of forecasting accuracy, even over ridiculously short durations, is unavoidable in the options game. Part and parcel with having a relatively refined long-term view of the stock market (and this goes beyond comments you read in the left column), short-term gyrations generally should fit the big picture. So, attribute clarity about what's likely to occur over the weeks and months ahead for The Risk Averse Alert's recent analytical successes.

End of self-congratulatory comments...


OEX 5-min
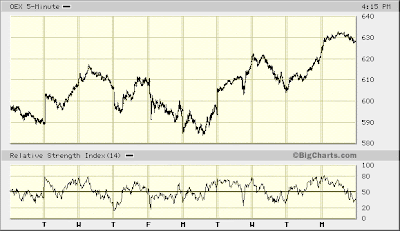
Something happened today potentially altering near-term probabilities. You will notice on yesterday's 10-day chart a horizontal line drawn across the top of the day's RSI. This was done with the intention of showing that yesterday's strong, late day advance resulted in RSI falling [slightly] short of its reading at the start of trading when S&P 100 shot higher. With this RSI divergence, the expectation was the S&P 100 would be all the more ripe to reverse course.

However, look what happened at the start of trading today. RSI actually lifted slightly above its high set yesterday (Tuesday). Interesting. Here's why...

Yesterday's Risk Averse Alert suggested "the S&P 100 might sooner return to the vicinity of [Monday's] lows, than bolt still higher from here." But you know what? Today's positive start, following through yesterday's monster advance and resulting in RSI unexpectedly lifting above its high yesterday, sheds a different light on things.

Commentary yesterday also noted that, "at no time did RSI, [Monday] and [Tuesday], extend as high as last Tuesday-Wednesday [3/11-3/12]." Further, it pointed out Tuesday's (3/18) "mid-afternoon RSI breakdown," and then went on to say, "[n]othing so severe occurred last Tuesday [3/11]."

These observations led to the conclusion that, "[b]oth these notable RSI disparities suggest underlying weakness, and lend added weight to the S&P 100's proven resistance here in the 620 area."

Well, the S&P 100's proven resistance did materialize in the 620 area today. However, there is reason to view Monday's and Tuesday's notable RSI disparities differently. Yesterday's assumption that, "the S&P 100 might sooner return to the vicinity of [Monday's] lows, than bolt still higher from here" should be challenged.

Consider how last week's stock market advance was accompanied by stronger RSI readings than accompanied this week's advance. You might say there was more conviction to last week's rally. There was firmer conviction a bottom was in place, and greater urgency to buy into a market "sure" to advance. This rather proved a demonstration of misplaced complacency, as the S&P 100 subsequently declined to set a new low.

Now, contrast last week's RSI performance with this week's. You might say RSI revealed a good deal more fear and doubt about the staying power of this week's advance. Precisely the kind of thing "smart money" wants prior to pushing stock prices higher. Today's doubters will become tomorrow's buyers who take shares off smart money's hands.

The S&P 100 settled today right in the range where the Risk Averse Alert projected it would likely finish when the March OEX contract expires tomorrow. Therefore, expect a relatively flat day on Thursday.

Should the stock market generally hold up and not continue Wednesday's slide, we can look forward to the S&P 100 advancing to its objective in the 630-645 range, sooner rather than later.


* * * * *

© The Risk Averse Alert — Advocating a patient, disciplined approach to stock market investing. Overriding objective is limiting financial risk. Minimizing investment capital loss is a priority.

Analysis centers on the stock market's path of least resistance. Long-term, this drives a simple strategy for safely investing a 401(k) for maximum profit. Intermediate-term, investing with stock index tracking-ETFs (both their long and short varieties) is advanced. Short-term, stock index options occasionally offer extraordinary profit opportunities when the stock market is moving along its projected path.

Nothing is set in stone. Nor is the stock market's path of least resistance always known. More often than not, there are no stock index option positions recommended.


There's an easy way to boost your investment discipline...

Get Real-Time Trade Notification!

Tuesday, March 18, 2008

Truth in Advertising: When Risk Averse Passes on Profit Opportunity


Today's follow-up to yesterday's turn-around had all the hallmarks typical of a counter-trend rally in a declining market. Marked strength of this sort ... so soon following a new low being set (though nominally so) in the S&P 100's multi-month decline ... is suspect. That's because it is occurring absent the right Relative Strength condition typically preceding a major, trend reversing advance. More on this at the conclusion of today's comments.


OEX 5-min
Unfortunately, the short-term RSI divergence registered last Friday and continuing yesterday (Monday), did not result in the Risk Averse Alert recommending a Call option position. So, we missed a quick profit opportunity despite seeing it coming. Given how rapidly the anticipated counter-trend burst unfolded, a "long" position would have been profitable irregardless of our concern about pricey risk premiums.

We might look at last Tuesday's (3/11/08) monster move up in the S&P 100 and get some better sense of how things might proceed from here. Just like yesterday's turn-around, last Tuesday's advance developed subsequent to typical RSI divergence one should look for prior to a playable move higher.

We see how, shortly after 11:00 a.m. last Wednesday (3/12), the S&P 100 proceeded to sell off, declining to a nominal multi-month low (registered yesterday). So, is the same thing about to happen?

Well, as indicated above, today's no-holds-barred, screaming rally appears to be but the first clue suggesting "this, too, shall pass." Furthermore, two additional clues suggest the S&P 100 might sooner return to the vicinity of yesterday's lows, than bolt still higher from here.

First, is the fact that, at no time did RSI, yesterday and today, extend as high as last Tuesday-Wednesday. Second is today's mid-afternoon RSI breakdown. Nothing so severe occurred last Tuesday.

Both these notable RSI disparities suggest underlying weakness, and lend added weight to the S&P 100's proven resistance here in the 620 area. But wait, there's more...


$OEX
As you can see, the S&P 100 rose today to meet its declining trend line. Although this line of resistance would not persist were the S&P 100 to reach its anticipated objective in the 630-645 range sometime over the next few weeks, right now it might present something of a barrier with only two days remaining in the March OEX contract.

As was noted in yesterday's Trade Commentary: "Odds favor the S&P 100 going out in the 600-605 range when the March OEX contract expires on Thursday. It could go higher." This outlook still stands.

The real import of today's advance is largely how it supports the Risk Averse Alert's near-term outlook. The strong rise off the lower end of the S&P 100's trading range since mid-January now raises the probability the 630-645 area eventually will be met.

Odds are the stock market is not about to embark on any melt-up yet. However, should the S&P 100 rise to the upper end of its trading range of the past couple months (i.e. 630-645), RSI would likely rise above its December high. This RSI improvement is a prerequisite to ending the stock market's multi-month slide. Following this, the S&P 100 should then set new lows while, at the same time, RSI diverges from its January low (much as happened over the past seven days as the S&P 100 set new lows). Should things unfold like this, then the stock market's melt-up might likely commence.


* * * * *

© The Risk Averse Alert — Advocating a patient, disciplined approach to stock market investing. Overriding objective is limiting financial risk. Minimizing investment capital loss is a priority.

Analysis centers on the stock market's path of least resistance. Long-term, this drives a simple strategy for safely investing a 401(k) for maximum profit. Intermediate-term, investing with stock index tracking-ETFs (both their long and short varieties) is advanced. Short-term, stock index options occasionally offer extraordinary profit opportunities when the stock market is moving along its projected path.

Nothing is set in stone. Nor is the stock market's path of least resistance always known. More often than not, there are no stock index option positions recommended.


There's an easy way to boost your investment discipline...

Get Real-Time Trade Notification!

Monday, March 17, 2008

Henry Potter Paulson Stars in "Its a Wonderful Knife"


Are we witness to a ruthless power grab? Obviously, something very nasty has been set into motion with the take-down of Bear Stearns. Although BSC is not in the S&P 100, fully 20% of all stocks in the S&P 100 are financial institutions. Just how many are overweight fictional assets, like subprime mortgages and CDOs, (or soon-to-be fictional assets, like auction-rate securities) is unknown. A few biggies (C, LEH, MER) appear to be under some considerable measure of stress not dissimilar from what BSC fell under prior to its spectacular collapse.

Jim Cramer has given the CEO of J.P. Morgan/Chase, Jamie Dimon, the name "Potter" (from "It's a Wonderful Life" fame). But is Dimon really cut out for the part? Truth is he is not a skillful liar. Word has it Treasury was advising JPM on how it should go after BSC. Like Cramer, Treasury Secretary Paulson is a Goldman man. Something smells fishy here.

Trouble now is we might first learn who was on the grassy knoll on November 22, 1963 before the names of the real shooters of BSC are disclosed. It's no strange coincidence the present challenge to the solvency of our modern day, anything goes, rock-n-roll financial system is occurring during an election year. The "Pigs on the Wing" wouldn't know a Fascist from Alexander Hamilton ... Senators, Governors and Mayors alike ... and now that the cake has been baked, it is only natural the candles be lit. This just in from the grave... Ken Lay howls a warning to Jimmy Cayne not to vacation in Vail.

Enough pontificating...

Nothing about today's hot news changes the big picture in which a spectacular melt up preceding a colossal melt down is expected to unfold in the stock market over the months ahead. That is "for the record." Although such "long-term" perspective may not seem a critical component to executing risk averse stock index options trades, it is very useful for isolating short-term possibilities and identifying immediate opportunities.


OEX 5-min
This stock market might seem a thing of ugly, but there have been no surprises here. You can go back these past several days and read for yourself.

So, about today's further continuation of RSI divergence, why was no trade recommendation made as was suggested on Friday "might be in order?"

Well, because RSI did not rise above last Thursday's high until late in the day. Now we need to see the S&P 100 fall back to the area of today's low, while RSI continues to diverge. If this happens, we might be in for a lightening quick "long" play. But then again, maybe not.

Given all the turmoil we're seeing, it might be wise to stay on the sidelines for a bit. Higher risk premiums are making a quick-hit Call position more pricey than desirable.

It might also be wise to lower the ultimate objective of the counter-trend rally we've been anticipating. Previously, we were looking for the S&P 100 to advance to the 645-650 area before the stock market embarked on the final leg of its multi-month decline. 630-645 might be a better objective. Those who have been spooked by BSC (also fearing prospects for other financials in the "hit" parade) might be quicker to sell now.

Odds favor the S&P 100 going out in the 600-605 range when the March OEX contract expires on Thursday. It could go higher.

Looking at the four nearest March OEX Put strikes below today's S&P 100 close (593.48), there are 24,492 [out of the money] contracts open. Contrarily, on the Call side there are 2,150 [in the money] contracts open. That's an 11-1 ratio. So, odds of the stock market falling into Thursday's expiration seem small.

Overhead, the disparity between [in the money] Put open interest and [out of the money] Call open interest for the next two strikes (namely, 595 and 600) is 3.78-1. Open interest at the 605 and 610 strikes is more or less balanced.


* * * * *

© The Risk Averse Alert — Advocating a patient, disciplined approach to stock market investing. Overriding objective is limiting financial risk. Minimizing investment capital loss is a priority.

Analysis centers on the stock market's path of least resistance. Long-term, this drives a simple strategy for safely investing a 401(k) for maximum profit. Intermediate-term, investing with stock index tracking-ETFs (both their long and short varieties) is advanced. Short-term, stock index options occasionally offer extraordinary profit opportunities when the stock market is moving along its projected path.

Nothing is set in stone. Nor is the stock market's path of least resistance always known. More often than not, there are no stock index option positions recommended.


There's an easy way to boost your investment discipline...

Get Real-Time Trade Notification!

Friday, March 14, 2008

A Bernard Baruch, Blood in the Streets Moment


OEX 5-min
Another day's demonstration of both weakness and strength in the battle for a short-term bottom from which a counter-trend rally to as high as the 645-650 area in the S&P 100 might ensue sometime over the next few weeks...

There's really not much to add to yesterday's comments as far as the Risk Averse Alert's outlook going into next Thursday's March options contract expiration. So, let's take a closer look at today's performance, then consider Monday's prospects and show how March OEX open interest supports a sanguine view in the midst of an expanding shark feeding frenzy occurring on Wall Street.

First, this morning's sharp collapse... Despite it being twice as severe as yesterday's market open sell-off, RSI was slightly less affected. The assumption the S&P 100 is finding buying support in the vicinity of Monday's closing low is supported by this RSI divergence (today versus yesterday). This divergence was further displayed at today's intra-day low coming at about 2:30 p.m.

The rally off today's intra-day S&P 100 low lifted RSI to a point where we can anticipate a final move lower in the S&P 100 on Monday, testing lows registered in the 590 area over the past five days, and quite possibly carrying the index still lower. Of course, expectations are that RSI will further diverge from its lows set yesterday and today. Should this occur an OEX "long" play might be in order.

The March OEX contract, with just four days until expiration, provides an interesting study in open interest supporting the case the S&P 100 is likely to rise above 600, no matter where it might fall to on Monday. Presently, the March OEX 600 Put has 10,415 contracts open, whereas the March OEX 600 Call has only 2,475 contracts open. The disparity between Put and Call open interest at strike prices below 600 is even more stark. (The S&P 100 closed today at 595.50)

This, of course, does not guarantee a thing. However, in the realm of probability, one must assume those who wrote open contracts have a vested interest in minimizing their cost of making whole those holders of contracts with intrinsic value at expiration. That's one reason why it is reasonable to expect the S&P 100 will settle somewhere between 600 and 620.

* * * * *

© The Risk Averse Alert — Advocating a patient, disciplined approach to stock market investing. Overriding objective is limiting financial risk. Minimizing investment capital loss is a priority.

Analysis centers on the stock market's path of least resistance. Long-term, this drives a simple strategy for safely investing a 401(k) for maximum profit. Intermediate-term, investing with stock index tracking-ETFs (both their long and short varieties) is advanced. Short-term, stock index options occasionally offer extraordinary profit opportunities when the stock market is moving along its projected path.

Nothing is set in stone. Nor is the stock market's path of least resistance always known. More often than not, there are no stock index option positions recommended.


There's an easy way to boost your investment discipline...

Get Real-Time Trade Notification!

Thursday, March 13, 2008

V For Vini Vidi Vici Volatility


OEX 5-min
Yesterday's Risk Averse Alert reported, "it looks like [Tuesday's] advance might be largely retraced over the next few days." Obviously, this expectation should have been stated a bit more broadly. It should have read, "... sometime over the next few minutes to the next few days." All things considered, the stock market could continue experiencing similar volatility as today, leading into next Thursday's expiration of the March OEX contract.

We have seen evidence of both weakness and strength reflected throughout this week's trading. Both were most notably demonstrated today.

Today's opening swoon quickly took the S&P 100 to the very spot yesterday's comments set as the probable objective of any "short" position we suggested might be initiated today. (If we had opened a Put position, we were "[looking] for a bottom in the 595 area.") Considerable underlying weakness was demonstrated as a result of today's start, with RSI challenging its Friday, 2/29 low (a day whose sell-off during the opening minutes of trading was quite similar to today's).

Not surprisingly, buying came in to save the day, ending any similarity to trading on 2/29. Thus, the present expectation that Monday's low is a point from which a counter-trend rally will develop, possibly lifting the S&P 100 to 645-650 range over the next few weeks, was verified (as much as this is possible). As such, the stock market's underlying strength likewise was demonstrated today.

Now, is today's strength suggesting Monday's low could not possibly be taken out sometime before next Thursday's expiration? No. But if this should happen, we would expect a reversal soon after.

In fact, this past Monday's low could be taken out tomorrow (or Monday next). If so, a quick "long" trade might be in order.

And to reiterate comments made over the past couple days, resistance in the 620 area should continue to materialize until the March OEX contract goes off the board next Thursday.

Broadly and generally speaking, we continue to look for the S&P 100 to rally as high as the 645-650 area before dishing out a final dose of pain. (You can read more about this here.) Although the stock market's path of least resistance, near-term, is up, its multi-month decline likely is not yet over.

* * * * *

© The Risk Averse Alert — Advocating a patient, disciplined approach to stock market investing. Overriding objective is limiting financial risk. Minimizing investment capital loss is a priority.

Analysis centers on the stock market's path of least resistance. Long-term, this drives a simple strategy for safely investing a 401(k) for maximum profit. Intermediate-term, investing with stock index tracking-ETFs (both their long and short varieties) is advanced. Short-term, stock index options occasionally offer extraordinary profit opportunities when the stock market is moving along its projected path.

Nothing is set in stone. Nor is the stock market's path of least resistance always known. More often than not, there are no stock index option positions recommended.


There's an easy way to boost your investment discipline...

Get Real-Time Trade Notification!

Tuesday, March 11, 2008

March 2008 OEX Open Interest Analysis


OEX 5-min
Approximately 22,000 March OEX Put option contracts were taken out of the money today. Less than 9,500 Call option contracts joined the intrinsic value ranks.

The situation at higher strikes, however, is markedly different.

On the OEX Call side the 615-630 strike prices have just over 16,000 contracts open. On the Put side only 8651 contract are open.

Thus, don't look for the March contract to go out much higher than the S&P 100 reached today.


$OEX
Follow-through on Wednesday is expected. Overhead resistance, though, might be anticipated in the 625-630 area. Should the S&P 100's advance appear to be stalling at this level on Wednesday, the Risk Averse Alert will be selling its open March 610 Call (OEYCB) position.

Our OEYCB went out today at a 10.60 bid. So, the position has more than doubled in a day. Anticipated follow-through on Wednesday simply will add icing to the cake.

Upon hitting nearby overhead resistance the S&P 100 might just trade sideways going into next Friday's expiration, and then, once the March contract goes off the board, proceed to its ultimate objective.

There is, however, an alternative scenario...

Last Friday's Commentary suggested "RSI [should] rise above high-end readings registered last December," coincident with the S&P 100 rising to the "645-650 range." This remains the ultimate objective of the advance begun today.

Who knows, though? This objective might be reached over the next few days, following which a resumption of the stock market's decline would be expected. More will be known tomorrow.

Truth is follow-through to today's strong advance might, indeed, be rather impressive. The 10-day chart above suggests this possibility is, in fact, quite good.

Irregardless, do not expect the S&P 100 to expire next Friday too far from where it closed today. If we see a strong follow-through to today's advance, we might keep our eyes open for a reversal of fortunes, wherein we could expect a day or two of downside volatility making an OEX Put option play a possibility sometime late this week or early next.

* * * * *

© The Risk Averse Alert — Advocating a patient, disciplined approach to stock market investing. Overriding objective is limiting financial risk. Minimizing investment capital loss is a priority.

Analysis centers on the stock market's path of least resistance. Long-term, this drives a simple strategy for safely investing a 401(k) for maximum profit. Intermediate-term, investing with stock index tracking-ETFs (both their long and short varieties) is advanced. Short-term, stock index options occasionally offer extraordinary profit opportunities when the stock market is moving along its projected path.

Nothing is set in stone. Nor is the stock market's path of least resistance always known. More often than not, there are no stock index option positions recommended.


There's an easy way to boost your investment discipline...

Get Real-Time Trade Notification!

Monday, March 10, 2008

The Stock Market is Anything BUT Problematic


The NYSE Composite Index

$NYA
Although the PPO (a price oscillator) might be viewed as something of a concern, indicating a strengthening of selling pressure over time in the NYSE index, one cannot ignore the fact this indicator has reached a negative extreme. This suggests the NYSE probably is near bottom.

Looking at the index's performance relative to the S&P 500 (lower panel) one has to conclude the broad stock market (as represented by the NYSE index) continues to behave quite well in comparison to the industry's benchmark index (the S&P 500).


Cumulative NYSE Advances - Declines

$NYAD cumulative
The chart of cumulative NYSE advances minus declines is included here to demonstrate how the thousands of stocks (and ETFs) underlying the NYSE are performing. This presents a look "under the hood" of the index itself.

As you can see, there is no wholesale abandonment of stocks being indicated by recent negative action. What is most evidently not happening is a handful of advancing stocks are holding up a large swath of declining stocks (much as was the case in the 1999-2000 period). This is a positive development indicating continued [professional] interest in owning and holding stocks and suggesting the NYSE will advance to further new-high ground.


CBOE Put/Call Ratio

$CPC
The CBOE Put/Call ratio is included here only to provide further evidence the stock market probably is near a turning point.

* * * * *

© The Risk Averse Alert — Advocating a patient, disciplined approach to stock market investing. Overriding objective is limiting financial risk. Minimizing investment capital loss is a priority.

Analysis centers on the stock market's path of least resistance. Long-term, this drives a simple strategy for safely investing a 401(k) for maximum profit. Intermediate-term, investing with stock index tracking-ETFs (both their long and short varieties) is advanced. Short-term, stock index options occasionally offer extraordinary profit opportunities when the stock market is moving along its projected path.

Nothing is set in stone. Nor is the stock market's path of least resistance always known. More often than not, there are no stock index option positions recommended.


There's an easy way to boost your investment discipline...

Get Real-Time Trade Notification!

Sunday, March 09, 2008

Is the Stock Market Falling Apart?


NYSE Composite Index

$NYA

NASDAQ Composite Index

$COMPQ

The relationship between performance in the NASDAQ Composite and the NYSE Composite over the past five years is eerily similar to the relationship existing between these two indexes from the 1998 LTCM bottom through the first three quarters of 1999 (not shown here).

Is the NASDAQ Composite about to markedly outperform the NYSE, much as it did from the 3rd quarter of 1999 through the 1st quarter of 2000?

* * * * *

© The Risk Averse Alert — Advocating a patient, disciplined approach to stock market investing. Overriding objective is limiting financial risk. Minimizing investment capital loss is a priority.

Analysis centers on the stock market's path of least resistance. Long-term, this drives a simple strategy for safely investing a 401(k) for maximum profit. Intermediate-term, investing with stock index tracking-ETFs (both their long and short varieties) is advanced. Short-term, stock index options occasionally offer extraordinary profit opportunities when the stock market is moving along its projected path.

Nothing is set in stone. Nor is the stock market's path of least resistance always known. More often than not, there are no stock index option positions recommended.


There's an easy way to boost your investment discipline...

Get Real-Time Trade Notification!