Friday, July 30, 2010

D-Day: Distribution Done


Continuing similarity to technical conditions leading into April 2010 top are further substantiating my current Elliott Wave view, raising odds a steep market decline is just around the corner...

$OEX

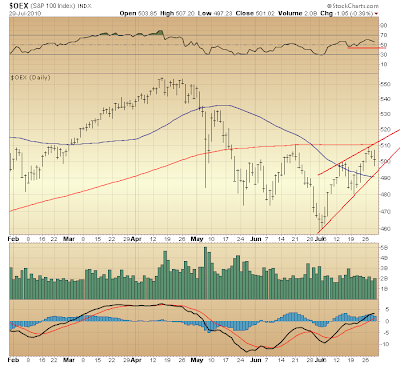
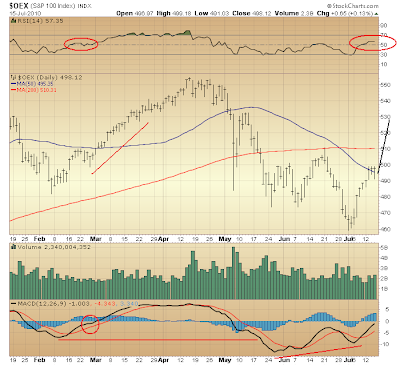
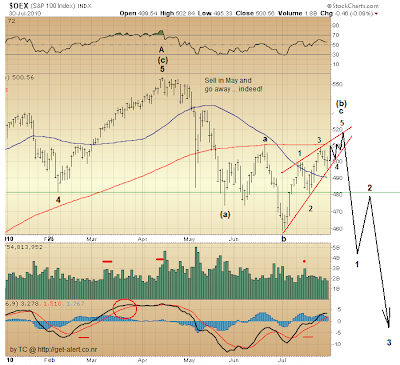
Noted a couple weeks ago were similarities to technical conditions at the time with the late-February period. Presently, taking a dynamic perspective of momentum (MACD) we see that, further similarity to that earlier period is being evidenced.

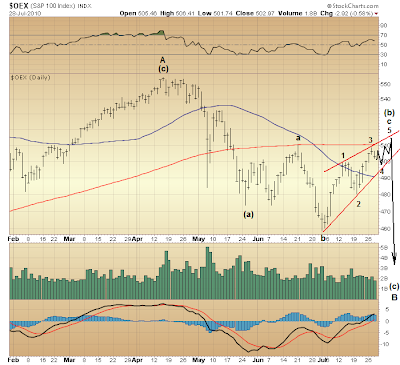
To wit MACD is coming into its 9-day moving average, much as occurred mid-March during formation of wave iv of 5 of (c) of A. Oddly enough, another forth wave — wave 4 of c of (b) — presently is thought forming.

Technical strength coincident with the rise of wave 3 of c of (b) (see Tuesday's "Setting Up for a Giant Letdown") now is being followed by several first-signs of technical weakness (with MACD being but one instance). This substantiates the possibility that, a rising wedge could be forming off June 29th bottom. There's more...

Remember how over the course of the market's counter-trend rally off March '09 bottom, every third wave's completion coincided with a pickup — a spike — in volume? We saw this last as wave iii of 5 of (c) of A completed in March 2010. This was a very notable pattern throughout the formation of wave (c) of A from March '09.

Well, given good technical reason to suppose the above wave count off June 29th bottom is valid, where's the volume spike at the conclusion of wave 3 of c of (b) (from Tuesday, July 27th, on)? Volume this week, relatively speaking, has been muted.

But wait... What's that at the peak of wave 1 a couple weeks ago? A spike in volume.

Wave 1, of course, is a first wave, not a third wave. Ah, but this wave 1 is thought to be forming the initial move up in a rising wedge — a "special" Elliott wave form whose impulse waves (i.e. waves 1, 3, and 5) subdivide in three waves (i.e. a-b-c) rather than five. So, the volume spike came at the conclusion of wave c of 1a third wave.

So, then, that volume did not spike at the conclusion of wave 3 (Tuesday, July 27th) ... following an advance whose relative technical strength substantiates this very wave count ... what is this suggesting?

Well, let's see...

At the conclusion of successive third waves throughout the formation of wave (c) of A from March '09 - April '10 volume diminished ... suggesting that, every step of the way higher shares strong hands needed distributing were becoming fewer in number ... and now we see no volume spike at the conclusion of a technically strong (relatively speaking) wave 3 of c of (b).

Do my eyes deceive? It appears strong hands may have completed their distribution!

All this, of course, "fits" the near-term view forward, too. If strong hands are fairly done distributing their shares ... and they are not, contrarily, accumulating shares ... then a momentary, Wile E. Coyote levitation over cliff's edge would be in keeping with what remains to be seen of the rising wedge thought forming off June 29th bottom ... with gravity's invariable effect taking hold thereafter.

Distribution done, eh? What might this mean when wave (c) of B of (B) completes its upcoming, hard move down (quite possibly putting March '09 lows in the crosshairs before election day)?

On Monday I wondered whether wave C of (B) [up] (following the upcoming wave (c) of B of (B) down) will be "a screamer with a short life, or a slow, tired grind higher possibly lasting well into next year?"

Well, if distribution more or less is in fact done, then chances are good, it seems, a slow grind higher it will be. However, understanding the magnitude of systemic risk at present and believing even white shoe firms are among weak hands (yet possessing considerable power nevertheless), a screamer with a short life rather seems more likely.

Indeed, this probability might better be thought baked in the cake, so long as those champion empiricist Monetarist Monkeys of ours remain at the top of their game.


Fast Money
* * * * *

© The Risk Averse Alert — Advocating a patient, disciplined approach to stock market investing. Overriding objective is limiting financial risk. Minimizing investment capital loss is a priority.

Analysis centers on the stock market's path of least resistance. Long-term, this drives a simple strategy for safely investing a 401(k) for maximum profit. Intermediate-term, investing with stock index tracking-ETFs (both their long and short varieties) is advanced. Short-term, stock index options occasionally offer extraordinary profit opportunities when the stock market is moving along its projected path.

Nothing is set in stone. Nor is the stock market's path of least resistance always known. More often than not, there are no stock index option positions recommended.


There's an easy way to boost your investment discipline...

Get Real-Time Trade Notification!
Thursday, July 29, 2010

A Dysfunctional Credit System Worthy of Fed Panic


Would there be any debate surrounding increasing federal government indebtedness — whether the problem be thought a spending problem or a revenue dilemma — were not the credit system in fact dysfunctional?

Indeed, this is where the discussion ought begin and end. Those in positions of power and/or influence who otherwise sidestep this issue present themselves as either incompetent or coward directing attention to anywhere but a credit system incapable of distinguishing sound investment opportunities from criminal scams.

There simply is no depth to which spending can be cut or the tax system altered whose effect will mitigate reality that, the economic foundation upon which the current credit system flounders is in a state of accelerating collapse, incapable of generating cash flows necessary for keeping all claims solvent and all interests afloat. Obviously, too, the credit system in its present state is in no position to reverse this condition. Were truth otherwise, then the debate over the federal debt's parabolic increase simply would be nonexistent.

Thus, the current discussion — whose intensity only is likely to grow, yet more wisely should be regarded a purposeful misdirection — plainly demonstrates that, anyone considering stocks viable long-term investments — indeed, calling them "cheap" — simply lacks sound skills of fundamental analysis.

Chaos of increasing orders of magnitude rightly is seen being baked into a cake whose maggot infested flour is blithely ignored while "fixes" that at best might mask this awful reality for some short time are elevated to matters of critical importance among incompetents and cowards.

This is our world. And until such time as our hopelessly insolvent credit system is put back on sound financial footing enhancing mankind's productive powers, chaos will rule.

Now that the lender of last resort finds itself under attack from the very maggots who have brought it to the brink of ruin a frightful alarm should be heard sounding (this as St. Louis Fed president Bullard's panic makes the noise all the more shrill): chaos looms.


$OEX

There appears plenty of room within what today still appears a rising wedge forming off June 29th bottom for such further sideways-to-down action as causes relative strength (RSI) to deteriorate in a manner typical of five wave advances (and in so doing indicate the advance off June 29th bottom is nearing its end).

Thus, we probably are looking at another week or more before we are hit by the leading edge of the storm everyone and your momma in some way or another rather pointedly is revealing to exist on the horizon (irrelevant is whether the likes are intelligent enough to understand the meaning of their manner of seeing).

Looking ahead, the market's initial move lower should rapidly take out June 29th's low, as this is typical behavior following formation of a rising wedge.

Again, whether this "special" Elliott wave indeed is forming remains to be seen. Today's trading, however, certainly furthered the possibility.


Fast Money
* * * * *

© The Risk Averse Alert — Advocating a patient, disciplined approach to stock market investing. Overriding objective is limiting financial risk. Minimizing investment capital loss is a priority.

Analysis centers on the stock market's path of least resistance. Long-term, this drives a simple strategy for safely investing a 401(k) for maximum profit. Intermediate-term, investing with stock index tracking-ETFs (both their long and short varieties) is advanced. Short-term, stock index options occasionally offer extraordinary profit opportunities when the stock market is moving along its projected path.

Nothing is set in stone. Nor is the stock market's path of least resistance always known. More often than not, there are no stock index option positions recommended.


There's an easy way to boost your investment discipline...

Get Real-Time Trade Notification!
Wednesday, July 28, 2010

Counting the Days to the Next Swindle Disguised as a Crisis


Right on cue, the incompetent Austrian running the state of California into the ground apparently has decided there is no time like the present to yet again show his true colors (having been raised by a devout member of the Nazi party) and test the will of what must be a growing number of Americans coming to a clearer sense of their constitutional power to command their financial destiny with help of bankruptcy laws if need be.

We are talking a state with an already weak credit rating, now hovering just a few notches above "junk" status. Restructuring clearly is just around the corner ... and someone gonna lose. My suspicion is this will include most everyone, making one place where losses have been broadening for over ten years — the stock market — most vulnerable, indeed, to yet another run ... on the bank that is.


$OEX

So, yesterday was the flip over to an a-b-c-x-a-b-c view of the corrective wave forming since late-May. Today is the flop right back to a simple a-b-c wave count.

Could a rising wedge be forming wave c of (b) ... whose each sub-wave (i.e. waves 1-5) divides into three waves (a-b-c)?

This sure does explain the past week's improved technical strength(!), as was the focus of yesterday's comments. Noted strength, indeed, is rightly associated with Elliott third waves (the current instance being wave 3 of c), as these typically are the most "dynamic" Elliott waves.

Now, let's see if this view holds ... or whether it will need altering. Refinements have been many of late, eh? Still, the big picture remains more or less unchanged ... and not pretty.


Fast Money
* * * * *

© The Risk Averse Alert — Advocating a patient, disciplined approach to stock market investing. Overriding objective is limiting financial risk. Minimizing investment capital loss is a priority.

Analysis centers on the stock market's path of least resistance. Long-term, this drives a simple strategy for safely investing a 401(k) for maximum profit. Intermediate-term, investing with stock index tracking-ETFs (both their long and short varieties) is advanced. Short-term, stock index options occasionally offer extraordinary profit opportunities when the stock market is moving along its projected path.

Nothing is set in stone. Nor is the stock market's path of least resistance always known. More often than not, there are no stock index option positions recommended.


There's an easy way to boost your investment discipline...

Get Real-Time Trade Notification!
Tuesday, July 27, 2010

Setting Up for a Giant Letdown


The prospective a-b-c-x-a-b-c complex corrective wave from late-May is back on the table. This corrective wave until yesterday was thought forming wave (2) of (C), but now is seen more likely tracing wave (b) of B of (B).

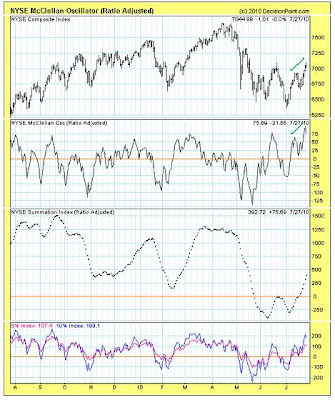
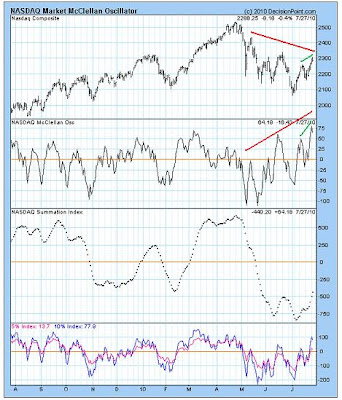
A healthy mix of improved technical measures (some with further room for improvement) suggest something other than five waves up from June 29th bottom are unfolding. For example, both the NYSE and NASDAQ McClellan Oscillators are confirming the past week's further move higher off June 29th bottom. Were a fifth wave unfolding and finishing wave c (of an a-b-c corrective wave since late-May), then both Oscillators should be well along in fading. Quite the contrary is the case, however...


NYSE McClellan
NASDAQ McClellan

Of course, it's possible something along lines occurring last month at the peak of the first a-b-c corrective wave from late-May bottom (forming an "irregular flat") is developing and the market soon will turn lower on a dime once again. Yet conditions are, in fact, relatively more improved here (with positive divergences registered at June 29th bottom adding weight to this), so further gains in the market appear likely over days ahead.

Sometime over the past couple weeks I put forward a view showing that, current conditions resemble those during late-February, and so a more prolonged move higher might develop. Given this apparently increasing probability, then, how much higher might major indexes rise? The answer now is the same as then: respective reaction highs, post-flash crash, mark the vicinity of the upper end to which the present advance might extend.

So, an a-b-c "zig-zag" is seen unfolding off June 29th bottom (with wave c presently forming). This follows an a-b-c "irregular flat" forming from late-May to mid-June. Thus, an a-b-c-x-a-b-c complex corrective wave is seen forming what now is thought wave (b) of B of (B).

Per wave (c) of B of (B) upcoming, we see how the various McClellan measures are raising the probability something nasty could develop. Summation indexes, as well as 5% and 10% indexes, have been decidedly trending lower over the past year as the market has begun turning over. Yet despite this both NYSE and NASDAQ McClellan Oscillators presently reveal a measure of fearlessness, as though underlying technical strength were believed building, rather than deteriorating as clearly has been the case.

Such is the face of a fine technical setup for a giant letdown...


Fast Money
* * * * *

© The Risk Averse Alert — Advocating a patient, disciplined approach to stock market investing. Overriding objective is limiting financial risk. Minimizing investment capital loss is a priority.

Analysis centers on the stock market's path of least resistance. Long-term, this drives a simple strategy for safely investing a 401(k) for maximum profit. Intermediate-term, investing with stock index tracking-ETFs (both their long and short varieties) is advanced. Short-term, stock index options occasionally offer extraordinary profit opportunities when the stock market is moving along its projected path.

Nothing is set in stone. Nor is the stock market's path of least resistance always known. More often than not, there are no stock index option positions recommended.


There's an easy way to boost your investment discipline...

Get Real-Time Trade Notification!
Monday, July 26, 2010

C Waves for As Far As the Eye Can See


The same bearish Fast Money traders who had me expecting the unexpected at the start of the month are baffled by the market's resiliency. Their outlook is challenged because, "Price action rules," they say.

No! Animal spirits rule. And guess what? The vanquishing of these over the past decade is the result of distribution from strong hands to weak (such action as continues to this very day).

Yes! Even many big players — white shoe firms — are among weak hands.

And how did these get so big ... and weak? Using leverage, of course ... like never before.

Oh, but they claim to have "de-leveraged!" Well, maybe so. Yet in all probability not nearly enough. Not in the midst of a collapsed physical economy that hasn't produced a surplus in decades, and a debt pyramid whose restructuring (write-downs) have barely begun.

Sorry, de-leveraging likely will continue ... and for longer than most imagine ... as reality in the "inflate or die" equation becomes all the more clearer with each passing month the securitization market remains as dead as Elvis.

Now, not necessarily wishing to be married to any Elliott Wave view looking forward, following is a third alternative in keeping with growing probability the near-term path of least resistance points decidedly lower...


$OEX

This possibility was discussed some months ago. Same a-b-c, "irregular flat" from November 2008 - April 2010. However, rather than these entirely forming wave (B), it's possible but wave A of (B) is formed.

Wave B of (B) — a 5-3-5 zig-zag down — presently could be unfolding ... and might even bring challenge to March '09 lows.

In light of yesterday's mid-term election year cyclical revelation, this alternate Elliott wave count suddenly seems rather attractive.

Surely, what stands to be accomplished prolongs distribution at what will prove lofty levels ... as well as keeps the March '09 "generational low" suckers in the game some months longer. Indeed, given this prospect only the time dimension of bumps in a dying distribution stands to be extended.

Just how much more what will prove weak hands step up as wave B of (B) completes over coming months largely will determine the dimensions of wave C of (B). Will its advance be a screamer with a short life, or a slow, tired grind higher possibly lasting well into next year?

Considering that, during a mid-term election year a bottom from which proceeded a decent launch higher has developed without fail over the past quarter century, the above, alternate Elliott Wave count appears all the more compelling.

Then, too, having highlighted Friday present similarities (in reverse) to price action last July seen in relation to the 200-day moving average ... then seeing how an Elliott third wave subsequently unfolded last year (i.e. wave 3 of (c) of A) ... duly note that, wave (c) of B upcoming would be much the same an Elliott third wave, too.

As for vulnerabilities precipitating an imminent swoon ... please. (The threat of some municipal bond default ... or a wave of defaults ... has good probability, because the counter-party risk apparently is so encompassing — AIG-like — as to virtually assure extraordinary bailout measures strangling Treasury further.)


Fast Money
* * * * *

© The Risk Averse Alert — Advocating a patient, disciplined approach to stock market investing. Overriding objective is limiting financial risk. Minimizing investment capital loss is a priority.

Analysis centers on the stock market's path of least resistance. Long-term, this drives a simple strategy for safely investing a 401(k) for maximum profit. Intermediate-term, investing with stock index tracking-ETFs (both their long and short varieties) is advanced. Short-term, stock index options occasionally offer extraordinary profit opportunities when the stock market is moving along its projected path.

Nothing is set in stone. Nor is the stock market's path of least resistance always known. More often than not, there are no stock index option positions recommended.


There's an easy way to boost your investment discipline...

Get Real-Time Trade Notification!
Sunday, July 25, 2010

The Vote on Imminent Collapse


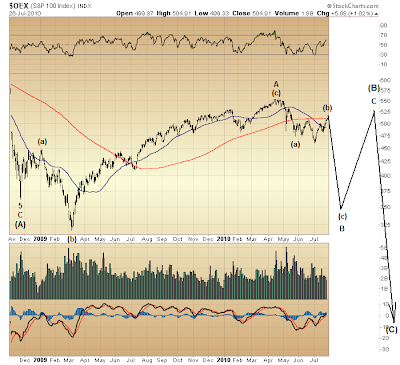
Consider cyclical evidence suggesting either wave (b) of (2) or wave (3) of (C) is likely to unfold before election day...


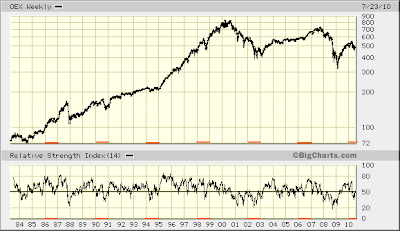
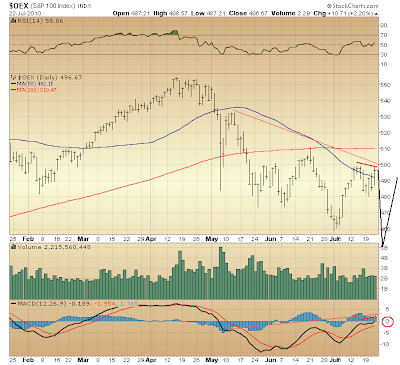
OEX weekly

In every single mid-term election year over the past quarter century the market is seen putting in a bottom of some sort, and then lifting higher without fail.

So, in light of this the question is, can wave (3) of (C) — an historic collapse — be delayed any longer?

Certainly it could be. Nevertheless, delayed collapse or not, over the next 12-18 months an OEX objective in the vicinity of 100 lies squarely within the realm of credible possibility. Since this is my long-held, well-substantiated view ... and given cyclical evidence reflecting on the present mid-term election year, as well as the fact May 6th's flash crash still vividly reveals the market trades on the thinnest ice ... the possibility of imminent collapse well below March '09 lows should not be thought unlikely. Something finding the OEX approaching 200 prior to election day seems reasonable.

Bear in mind (no pun intended) that, unfolding since October 2007 is thought an Elliott corrective wave on the same level as that from 1929 - 1932.

(Here's where I part company from Prechter. He is of the mind believing the corrective wave begun in 2007 is one higher level in magnitude, and so likely to bring major indexes back to ranges in which these in the 1970s respectively traded. I on the other hand am more "optimistic." Levels last seen in the 1987-1994 period are thought the likely area where long-term support will be met.)

Likewise, although the currently unfolding corrective wave (since 2007) might reach its lowest over the next 12-18 months, there could be several more years following wherein the past decade's downward sloping tops might represent such resistance as extends this corrective wave for some more months and years thereafter. (Refer to Friday's 5-minute chart detailing [complex] wave 4 of (c) of (2) of (C) for a sense of this possibility.)

* * * * *

© The Risk Averse Alert — Advocating a patient, disciplined approach to stock market investing. Overriding objective is limiting financial risk. Minimizing investment capital loss is a priority.

Analysis centers on the stock market's path of least resistance. Long-term, this drives a simple strategy for safely investing a 401(k) for maximum profit. Intermediate-term, investing with stock index tracking-ETFs (both their long and short varieties) is advanced. Short-term, stock index options occasionally offer extraordinary profit opportunities when the stock market is moving along its projected path.

Nothing is set in stone. Nor is the stock market's path of least resistance always known. More often than not, there are no stock index option positions recommended.


There's an easy way to boost your investment discipline...

Get Real-Time Trade Notification!
Saturday, July 24, 2010

Bumps in a Dying Distribution


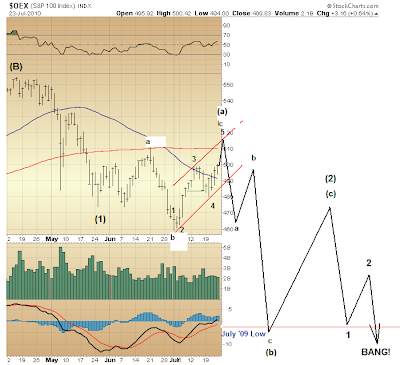
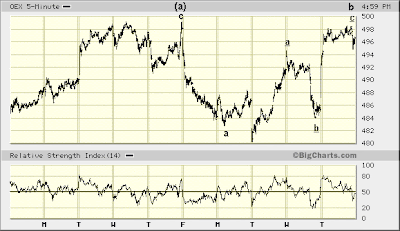
Classic "picture is worth a thousand words" demonstration...


$OEX

That's a rough sketch showing how time might be made for furthering at what will prove lofty levels (i.e. pre-BANG!) a decade-and-running distribution. This credible prospect was mentioned yesterday.

Or so my many words hoped to convey...

* * * * *

© The Risk Averse Alert — Advocating a patient, disciplined approach to stock market investing. Overriding objective is limiting financial risk. Minimizing investment capital loss is a priority.

Analysis centers on the stock market's path of least resistance. Long-term, this drives a simple strategy for safely investing a 401(k) for maximum profit. Intermediate-term, investing with stock index tracking-ETFs (both their long and short varieties) is advanced. Short-term, stock index options occasionally offer extraordinary profit opportunities when the stock market is moving along its projected path.

Nothing is set in stone. Nor is the stock market's path of least resistance always known. More often than not, there are no stock index option positions recommended.


There's an easy way to boost your investment discipline...

Get Real-Time Trade Notification!
Friday, July 23, 2010

The More Things Change, the More They Stay the Same


Today changes things ... a little bit: it's right back to where we started.

First a look on the micro scale because yesterday's lift out of the gate certainly is holding up well. Likewise, this afternoon's advance to a new high, post-June 29th bottom only further suggests that something other than a hard move down to and through June 29th lows lies imminently ahead.


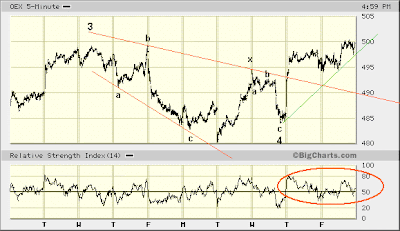
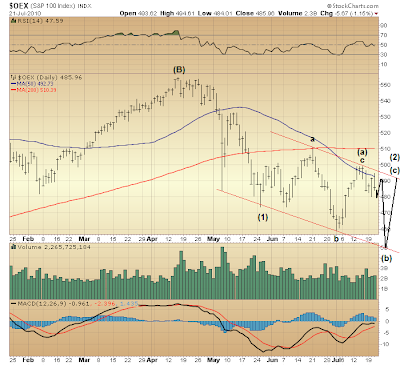
OEX 5-min

A complex fourth wave of five waves up from June 29th bottom is labeled above. This wave's form alternates with the second wave's simple, a-b-c structure. Textbook Elliott Wave Principle.

You have to like the relative strength resilience circled above following yesterday's lift. This gives RSI the look of an Elliott five-wave impulse wave early in its formation. Thus, waves i and ii of 5 might be in, with waves iii, iv and v of 5 still to come.

Wave 5 will end a "c" wave [up] of an a-b-c correction that, itself, has been unfolding since wave (1) of (C) [down] ended in late-May...


$OEX

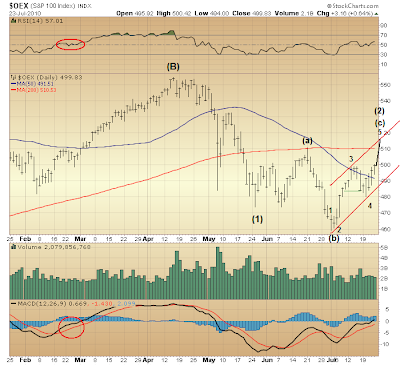
Five waves up from June 29th bottom forming wave (c) of (2) was the preferred view up until last Friday, July 16th — options expiration day. Largely because a relatively straight-line advance off June 29th bottom had been anticipated, last Friday's drubbing was thought to have opened other Elliott Wave possibilities.

Yet the fact of the matter is wave 4 of (c) bottomed right where it should, and absolutely no Elliott Wave Principle rules are violated by the above labeled five waves applied to the advance off June 29th bottom. So, that being the case we should be good with this wave count.

(Not to say this is the "correct" view ... rather only that, it could be ... much as generally is the case here. Still, considering resiliency following yesterday's rocket higher right out of the gate, this view gains greater probability.)

Now, enter "channeling" guidelines laid out in the Elliott Wave Principle and you get an upside objective for wave 5 of (c) right in the vicinity of the 200-day moving average. Since there are a couple good reasons to suspect the 200-day moving average might prove a formidable barrier, still greater probability the above Elliott wave count might be thought to gain.

Why the 200-day moving average appears an area of considerable resistance is explained below...


$OEX

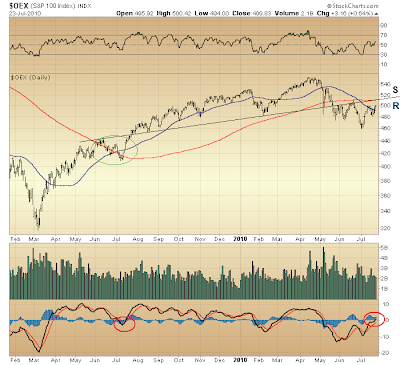
Consider price action around the 200-day moving average, now versus one year ago (i.e. June-July '09). Last year, following upside penetration of the 200-day moving average, both price and technical action developed quite similarly — in reverse — to what we have seen since the 200-day moving average was penetrated to the downside in May.

These similarities — in reverse — simply are uncanny. You see this in the behavior of both the 200-day and the 50-day moving averages. You see this as well via RSI and MACD.

Presently, everything technically is poised negatively. Thus, the 200-day moving average looks to be an area where resistance is likely to be met — quite the reverse of last year when everything technically was positively poised, thus strengthening the probability the 200-day moving average would mark the area where support likely would develop.

The other reason why the 200-day moving average might offer considerable upside resistance is seen via a long-term line of support/resistance drawn above. Consider the dynamic this line represents — the life and death of the latest phase of a decade-and-running distribution whose increasing urgency is recent history (2008) now set for the next, even more chaotic phase. Having acted for nine months as a line of support — during which time distribution was prolonged — suckers now are vanquished and too weak to bring recovery. These last two months expose this. The final test lies ahead.

Or does it?

What I wonder is whether five waves up from June 29th bottom form wave (c) of (2) ... or whether they are but wave c of (a) of (2) ... leaving wave (b) of (2) — a 5-3-5 zig-zag down — to follow? Likewise, might a prospective wave (b) of (2) [down] easily take out June 29th's low and be followed by wave (c) of (2) back up, taking major averages, say, only to late-May levels?

In other words, picture wave (2) forming a "running correction." Consider what further distribution might be accomplished at levels that, in the end will prove relatively lofty compared to where wave (3) — a dizzying collapse — is slated to travel.

Given continuing attempts at maintaining the illusion of the global financial system's solvency, there is every reason to expect further support efforts in keeping with desperation made policy in the attempt to "save the system" late-2008, early-2009. Upcoming lurches toward March '09 bottom seem likely to precipitate concerted actions bringing temporary support and allowing still more time to distribute shares at what will prove relatively lofty levels when all is said and done.

I am raising this possibility because it portends something quite contrary to what happened last July following the second retest of the 200-day moving average support area. Then, wave (3) of C of (B) subsequently developed.

Now, however, with the 200-day moving average presenting upside resistance (and with everything to lose, as well, should March '09 lows be threatened) we might get different Elliott wave developments following the upcoming, second retest of 200-day moving average resistance. Instead of wave (3) of (C) down subsequently developing, wave (2) of (C) might further form with an even more pronounced downward bias than recently has been depicted here.

Looking past the anticipated completion of five waves up from June 29th, what the above discussion implies simply is this: upcoming weakness in the stock market could be considerable, and yet develop without any systemically threatening financial developments to speak of. This occurring during a prospective wave (b) of (2) down would set up wave (c) of (2) up, along with lord knows what crazy talk of a bull market's resumption. This could mark the final phase of distribution at levels not likely to be seen again for some years to come. Wave (3) of (C) down would be due next and ruin many millions of investors in its wake.

Of course, should wave (2) end some days from now, then the hour of ruin will be upon us and further distribution at present, lofty levels simply will prove impossible.


Fast Money
* * * * *

© The Risk Averse Alert — Advocating a patient, disciplined approach to stock market investing. Overriding objective is limiting financial risk. Minimizing investment capital loss is a priority.

Analysis centers on the stock market's path of least resistance. Long-term, this drives a simple strategy for safely investing a 401(k) for maximum profit. Intermediate-term, investing with stock index tracking-ETFs (both their long and short varieties) is advanced. Short-term, stock index options occasionally offer extraordinary profit opportunities when the stock market is moving along its projected path.

Nothing is set in stone. Nor is the stock market's path of least resistance always known. More often than not, there are no stock index option positions recommended.


There's an easy way to boost your investment discipline...

Get Real-Time Trade Notification!
Thursday, July 22, 2010

Toxic Trillions Lifted by Lowly GM


Now if only the rest of corporate America were in a taxpayer-assisted position to re-lever its balance sheet like GM ... then, maybe days like today might actually stick!


$OEX

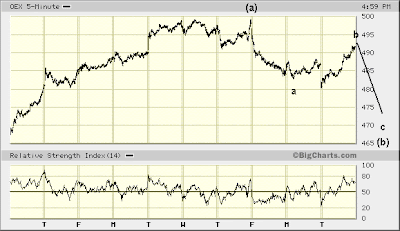
Continuing is the trend since May, wherein increasing (yet still negative) momentum (MACD) coincidentally registers at lower index highs. Thus, another turn lower can be expected here, and this in keeping with further sideways trading thought likely to develop leading up to the market's projected collapse sometime over the next couple months.


OEX 5-min

There's a reasonable chance the market's turn lower was made late in the day today. Give it another week or so, and we should be setting new lows, post-April peak.


Fast Money
* * * * *

© The Risk Averse Alert — Advocating a patient, disciplined approach to stock market investing. Overriding objective is limiting financial risk. Minimizing investment capital loss is a priority.

Analysis centers on the stock market's path of least resistance. Long-term, this drives a simple strategy for safely investing a 401(k) for maximum profit. Intermediate-term, investing with stock index tracking-ETFs (both their long and short varieties) is advanced. Short-term, stock index options occasionally offer extraordinary profit opportunities when the stock market is moving along its projected path.

Nothing is set in stone. Nor is the stock market's path of least resistance always known. More often than not, there are no stock index option positions recommended.


There's an easy way to boost your investment discipline...

Get Real-Time Trade Notification!
Wednesday, July 21, 2010

Extending a Downwardly Biased Trading Range


If five waves up from June 29th bottom completed last week (July 15th), then another, alternate Elliott wave count might return the preferred view of developments since late-May in the formation of wave (2) (of five waves down from late-April peak) to more familiar lines not long ago thought likely...


$OEX

A simple (a)-(b)-(c) corrective wave forming wave (2) of (C), indeed, still might be forming. The complex (a)-(b)-(c)-(x)-(a)-(b)-(c) corrective wave discussed the past couple days remains possible, too, but the present technical state of things suggests a fairly steep turn lower might be in order here. This could even result in June 29th's low being taken out. Were this to occur, the simple wave count presented above certainly would become the correct view.

So, with this being the case, then, could even what's labeled wave (a) of (2) above instead end wave (2)? Yes, this is possible.

No doubt, the evolution of the sideways trade since mid-June more or less is in keeping with what were my expectations. Yet improving relative strength and momentum over the duration — both measures nevertheless still precariously positioned — suggest a further sideways trade (albeit with a downward bias) still might be in order before wave (3) of (C) down develops.

Consider this in the framework of expectations set forth over the past week via the CBOE Put/Call ratio. A further sideways trade as indicated above might pass before a notable increase in call option activity develops as anticipated.

Again, as long as any number of profoundly threatening vulnerabilities to the global financial system remain subdued, then the door remains open for further distribution of shares at present, relatively lofty levels. Thus, the Elliott wave count indicated above possesses both solid technical substantiation, as well as [quiet] fundamental circumstances allowing for continued development of a sideways trading market — buying time — leading ever closer to the moment of collapse.


Fast Money
* * * * *

© The Risk Averse Alert — Advocating a patient, disciplined approach to stock market investing. Overriding objective is limiting financial risk. Minimizing investment capital loss is a priority.

Analysis centers on the stock market's path of least resistance. Long-term, this drives a simple strategy for safely investing a 401(k) for maximum profit. Intermediate-term, investing with stock index tracking-ETFs (both their long and short varieties) is advanced. Short-term, stock index options occasionally offer extraordinary profit opportunities when the stock market is moving along its projected path.

Nothing is set in stone. Nor is the stock market's path of least resistance always known. More often than not, there are no stock index option positions recommended.


There's an easy way to boost your investment discipline...

Get Real-Time Trade Notification!
Tuesday, July 20, 2010

A Banner Day Baiting Suckers


In case you missed it, Steve Jobs during tonight's Apple conference call failed committing the firm's excess cash as seed capital for a new global banking system to replace the presently insolvent one. So, any thought supposing Apple IS the U.S. economy be gone. Absent power to revitalize commercial lending, Apple is as much at risk as the rest.


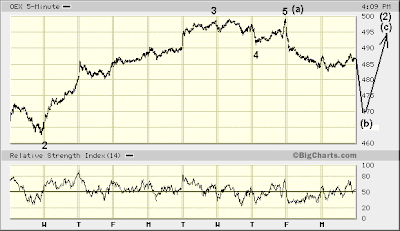
OEX 5-min

Consider today (like so many days since March '09) but another finding strong hands extending their further distribution of dead equity. After all, these too are at terrible risk of being badly crushed soon, no matter how enduring their sucker feed proves.

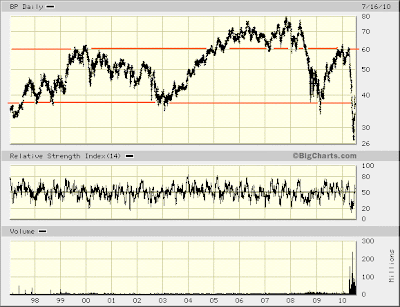
That is why the BP template deserves attention. Vividly demonstrated is the evolution of [failing] efforts at maintaining buoyancy being made by not insignificant players on the global financial stage whose positions are at grave risk. BP's price action since April top presents the manner in which we can expect the sucker feed to persist across the broad market over upcoming months as conditions persistently become more perilous.


$VIX

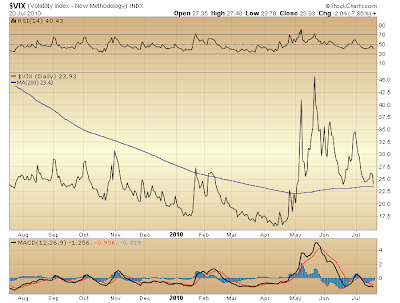
The fear factor having subsided a bit more today than conditions might warrant suggests wave c of (b) down (indicated above) appears well in order.


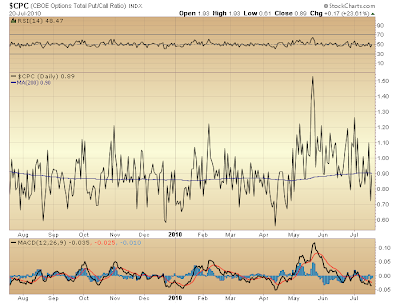
$CPC

And substantiating the view suckers, indeed, are being fed we see elevated call option buying following last week's expiration of the July front month (as expected).

This setup coincides with both yesterday's and today's intra-day bid stabilizing the market ... and suggests that, once wave (b) down completes, wave (c) up (completing? wave (2) of (C)) likely will facilitate a further attempted sucker feed such as elevates call option buying to a degree challenging best levels seen during the market's final advance into late-April top.

These purchased rights might never possess intrinsic value encouraging their exercise, though, and so no further distribution of long equity positions likely will be facilitated. Just how vexing a problem this proves should be revealed immediately thereafter.

One possibility we should remain open to is wave (2) evolving from its present "double three" (i.e. a-b-c-x-a-b-c) to a "triple three" (i.e. a-b-c-x-a-b-c-x-a-b-c) complex form. Unlike BP's second wave which recovered much of its first wave down following its April peak, the broad market's second wave from late-April peak might extend in a sideways levitation, compensating for the fact there simply is not a bid strong enough to lift major indexes in similar fashion as BP prior to its collapse.

Finally (and still), absent a sudden resurgence of systemically-threatening stress somewhere on the globe, an extended levitation — buying time and furthering distribution — ought not be thought out of the question. Indeed, this thinking remains as valid over the next several weeks as was the case early-July when a sizable bounce extending wave (2) was thought likely.


Fast Money
* * * * *

© The Risk Averse Alert — Advocating a patient, disciplined approach to stock market investing. Overriding objective is limiting financial risk. Minimizing investment capital loss is a priority.

Analysis centers on the stock market's path of least resistance. Long-term, this drives a simple strategy for safely investing a 401(k) for maximum profit. Intermediate-term, investing with stock index tracking-ETFs (both their long and short varieties) is advanced. Short-term, stock index options occasionally offer extraordinary profit opportunities when the stock market is moving along its projected path.

Nothing is set in stone. Nor is the stock market's path of least resistance always known. More often than not, there are no stock index option positions recommended.


There's an easy way to boost your investment discipline...

Get Real-Time Trade Notification!
Monday, July 19, 2010

Who Else Sees a Dazed and Confused Long Interest?


Here is my best random video impression of tonight's Fast Money Word on the Street...


That's what I heard anyway. (Hat tip Nova Mirabel for her fine, fine Karen Finerman impression!)

Given sobering news after the bell it's hard to imagine tomorrow beginning anyway but soft...


OEX 5-min

Again, this seems a reasonable flavor of things to come. Wave (b) labeled above is the second in an (a)-(b)-(c)-(x)-(a)-(b)-(c) complex corrective wave forming wave (2).

Formation of this second wave (b) (beyond that shown above) might involve further sideways trading before wave (c) higher proceeds to end wave (2) ... which then could usher in a period of panic and a long interest at grave risk of early dementia: wave (3) of (C) d-o-w-n hard.

An Elliott "third wave of a third wave" (i.e. wave (3) of (C)) offers a spectacular show to those in the know.

And that you are.

(p.s. It stands to reason a complex corrective wave, such as wave (2) appears now to be, should precede panic. Such reveals strong hands maintaining capacity to continue their distribution as best they can.)


Fast Money
* * * * *

© The Risk Averse Alert — Advocating a patient, disciplined approach to stock market investing. Overriding objective is limiting financial risk. Minimizing investment capital loss is a priority.

Analysis centers on the stock market's path of least resistance. Long-term, this drives a simple strategy for safely investing a 401(k) for maximum profit. Intermediate-term, investing with stock index tracking-ETFs (both their long and short varieties) is advanced. Short-term, stock index options occasionally offer extraordinary profit opportunities when the stock market is moving along its projected path.

Nothing is set in stone. Nor is the stock market's path of least resistance always known. More often than not, there are no stock index option positions recommended.


There's an easy way to boost your investment discipline...

Get Real-Time Trade Notification!
Sunday, July 18, 2010

Alan Schwartz Goes to Washington


An LPAC article published yesterday, titled, "Frank-Dudd Bill Will Increase the Derivatives Cancer—As Intended" offers insight into why FinReg is better thought an "Alan Schwartz Goes to Washington" affair — an exercise in denying reality of pending financial doom, just like the former CEO of Bear Stearns performed on CNBC two days before his firm was taken down.

Most stunning is just how blind everyone is to this reality!

"The real-world result of the Frank-Dudd bill passed by the Senate Thursday will be to open the floodgates for the bankrupt banks to further increase their cancerous derivatives bubble."

Or so it might appear! That's what the bill allows, but what will be securitized and leveraged? We're plumb out of tulips, babe!

So, written into FinReg is power to leverage empty space in a vacuum. But, hey, we can do that, so therefore we're not bankrupt! Right, Mr. Schwartz?

The psychology agreeable to participating in new securities schemes has been destroyed.

Still, the busy beavers don't get it...

"Major banks such as JP Morgan and Goldman Sachs have been preparing for the new bill and retooling for months. JP Morgan has 90 project teams that meet daily to review the rules, the New York Times reported July 15, and they and others are 'building up their derivatives brokerage operations.'"

Dream until your dreams come true! Again, what revenue streams can be leveraged? Fee-based infrastructure developed via public-private partnerships may be in the cross hairs, but enough to sustain (let alone grow) the current mountain of existing liabilities? Not very likely.

Besides, there's too much power to be grabbed and consolidated amidst coming chaos.

"Brokers cheered the bill in the financial district pubs," Germany's Handelsblatt reported, while the Financial Times smugly noted that the "financial services sector...should now feel mightily relieved."

That's thick marmalade right there! We're good now, says Mr. Schwartz! Well, as you know, I don't buy it. Likewise, I am not alone in reaching this conclusion, as there is overwhelming technical evidence revealing strong hands in truth don't buy it either. Shares continue being distributed for good reason.

* * * * *

© The Risk Averse Alert — Advocating a patient, disciplined approach to stock market investing. Overriding objective is limiting financial risk. Minimizing investment capital loss is a priority.

Analysis centers on the stock market's path of least resistance. Long-term, this drives a simple strategy for safely investing a 401(k) for maximum profit. Intermediate-term, investing with stock index tracking-ETFs (both their long and short varieties) is advanced. Short-term, stock index options occasionally offer extraordinary profit opportunities when the stock market is moving along its projected path.

Nothing is set in stone. Nor is the stock market's path of least resistance always known. More often than not, there are no stock index option positions recommended.


There's an easy way to boost your investment discipline...

Get Real-Time Trade Notification!
Saturday, July 17, 2010

Whitney Tilson: a Sucker for BP


We are chalk full of blind guides. On any given trading day one easily could identify a "sucker of the hour" (courteous of that reliable feed, CNBC) ... there are so many. Laid bare are their every bullish argument ridiculously cited as though the global financial system were not vulnerable to collapsing overnight, literally.

Today's worst sucker, though, really is a special breed: the falling knife catcher. These carry forward in the spirit of the defunct Peloton Partners, failing to fathom the fallout from the seizure of the shadow banking system: that leverage it created can no longer be furthered, leaving the physical economy woefully exposed — incapable of sustaining the mountain of securities hanging in the balance.

Enter Whitney Tilson...

During Friday's Fast Money, "Word on the Street" Mr. Tilson claimed that, despite a fast and furious run-up from its recent bottom BP shares remain attractive. Thus, he is holding his position rather than selling into strength.

BIG MISTAKE!


company chart (BP)

The ups and downs of BP's share price over the past fourteen years offer a vivid demonstration of how "support" and "resistance" act to alert investors of possible inflection points.

Consider the fact a long-term line of support just below $40 fell with Deepwater Horizon. This was a feat accomplished on historic volume no less. So, yesterday's support all the more is likely become formidable resistance, then.

Think how widely held is BP's stock. Now be sure its majority shareholders were by no means the fuller part of historic volume accompanying the stock's recent collapse. Rather majority interests added shares above support that, for a decade or so developed just south of $40 — support that, just recently gave out. Strong hands bailed. If no long position plans are being made by these hands presently, then guess what happens to share prices? That's right! They fall of their own weight.

Odds Whitney Tilson will prove prudent holding his BP position in anticipation of further gains are about as near zero as one needs to objectively call him a sucker. Pure and simple.

The matter of BP's collapse below March '09 support and now the present prospect of prices falling of their own weight, easily taking out recent lows in the $20s, further lends insight — a template — summarizing the outlook I have toward the broad market.

So, the natural question here, then, is what Deepwater Horizon calamity awaits? Surely, we are primed for it! There are more vulnerabilities than you can shake a stick at. What will it be?

* * * * *

© The Risk Averse Alert — Advocating a patient, disciplined approach to stock market investing. Overriding objective is limiting financial risk. Minimizing investment capital loss is a priority.

Analysis centers on the stock market's path of least resistance. Long-term, this drives a simple strategy for safely investing a 401(k) for maximum profit. Intermediate-term, investing with stock index tracking-ETFs (both their long and short varieties) is advanced. Short-term, stock index options occasionally offer extraordinary profit opportunities when the stock market is moving along its projected path.

Nothing is set in stone. Nor is the stock market's path of least resistance always known. More often than not, there are no stock index option positions recommended.


There's an easy way to boost your investment discipline...

Get Real-Time Trade Notification!
Friday, July 16, 2010

Trampled by a Correlated Trade


You see, this is what happens when some majority of suckers take the same bait. You get a "correlated trade." One easily imagines a portfolio manager or three tonight feeling a little less prudent exercising call options, then attempting to take some profits. In so doing they joined a crowded trade whose same action all day drove prices persistently lower.

Hey, it's a jungle out there. Yet not so thick as to disguise distribution.


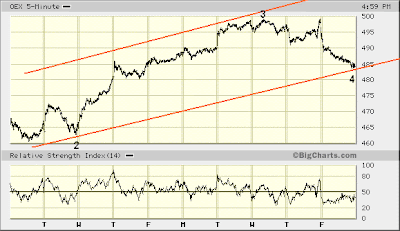
OEX 5-min

Well, probably gone is any prospect for an upwardly biased fourth wave of five waves slated to form wave (c) of (2). This was thought likely a couple days ago. Yesterday's giddy close commemorating an Alan Schwartz sighting in Washington DC seemed to substantiate the possibility. This was not to be, however.

So, less likely for the moment appears a super-charged rocket higher rapidly completing wave 5 of (c). Likewise, wave 4 of (c), although probably near its lowest, might produce further sideways trading before wave 5 of (c) commences.

Indeed, given the fact today's technical damage was considerable, an alternate wave count for wave (2) might be in order here. The "complex-to-simple" dynamic previously cited might better be revised slightly, seeing that five waves up from June 29th bottom formerly were thought likely to unfold without scarcely missing a beat, but today endured a heart attack...


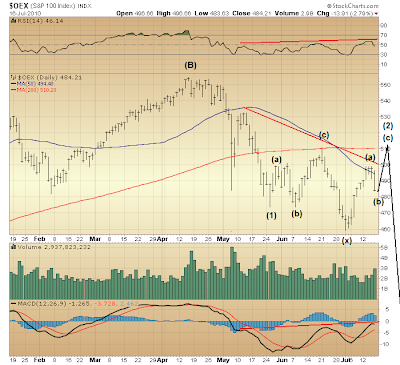
$OEX

Here's the deal... Divergences registered by both RSI and MACD at consecutive, lower OEX highs reached in the aftermath of May 6th's flash crash, wherein both measures set higher highs, once again may be coinciding with yet another downside reversal occurring in the formation of wave (2).

Indeed, should this negative technical circumstance in fact be persisting here, then today's decline is unlikely marking the end of the second wave (b) of (2) as is indicated above.

(Again, my drawn projections typically are meant to suggest a prospective flavor of things to come — the gist of the market's direction — rather than imply timing to any prospective move.)

So, a second wave (b) unfolding in formation of a complex corrective wave (2) (still seen developing in complex-to-simple fashion) probably will soon end present similarities to the late-February period noted yesterday. With technical weakness strongly reasserted today, it's possible formation of this second wave (b) of (2) could consume much (if not all) of next week's trading.

Now, you might be wondering why I am discounting possibility that, big, bad wave (3) of (C) down could have begun. The simple fact of the matter is there are too many suckers just hankering to be fleeced who have yet to take the bait, hook, line, and sinker.

Go back to yesterday's discussion highlighting the CBOE Put/Call ratio. As long as nothing profoundly disturbs the illusion of the global financial system's solvency, there is a good chance we will see the CBOE Put/Call ratio rival its lows set at market peaks over the past year before wave (2) of (C) completes.

The fact of the matter is we should expect a measure of confidence greater than that registered during the market's advance into late-April top before the lug nuts are seen prime for falling off. Such is the typical order things. Elevated call option buying revealing confidence in a contrived rally (facilitating distribution) would sound a red alert indicating imminent trouble looming (namely, wave (3) of (C)).


Fast Money
* * * * *

© The Risk Averse Alert — Advocating a patient, disciplined approach to stock market investing. Overriding objective is limiting financial risk. Minimizing investment capital loss is a priority.

Analysis centers on the stock market's path of least resistance. Long-term, this drives a simple strategy for safely investing a 401(k) for maximum profit. Intermediate-term, investing with stock index tracking-ETFs (both their long and short varieties) is advanced. Short-term, stock index options occasionally offer extraordinary profit opportunities when the stock market is moving along its projected path.

Nothing is set in stone. Nor is the stock market's path of least resistance always known. More often than not, there are no stock index option positions recommended.


There's an easy way to boost your investment discipline...

Get Real-Time Trade Notification!
Thursday, July 15, 2010

Fantasy Dies Hard


First impression of all things financial, politically connected... Alan Schwartz goes to Washington. That's it. The message from our nation's capital is everything's fine here in fantasy land where wet noodles have no choice but jump back in bed with a monster created by their own hands.

History suggests an oppressive force accommodated will be back again with hand out sooner than most imagine. I would expect the same this time. Indeed, accommodating a field of hapless giants amidst a hopelessly bankrupt system must sanction chaos. The trend is your friend. Ask Barclays.

So, to the ages old question, then, asking, "Which came first? The chicken or the egg?," answer Uncle Sam clearly has given. It is the chicken.

But enough about fantasy land, where representatives in Congress masquerade as well-connected European parliamentarians! Back to reality of pending financial collapse, wherein the healthy now are legislatively sanctioned — set up — for sacrifice to the diseased...


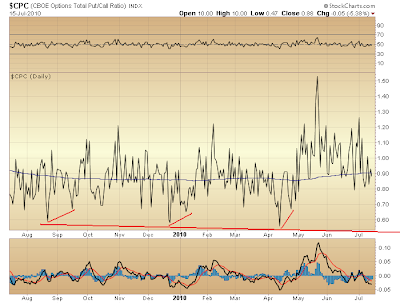
$CPC

It seems the contrived game drawing in long interest to whom shares can be distributed possesses room for expansion. In other words, we could see a good bit more call option writing with all due CME juice to follow, extending the market's advance.

The extent to which this operation increasingly succeeded over the past year and satisfied the intentions of strong hands distributing shares is revealed by the line drawn below the CBOE Put/Call Ratio.

Duly note, too, divergence typically registering when the market tops. Look for this when wave (c) of (2) is nearing its completion.


$OEX

Present technical circumstance bears similarity to late-February. RSI has taken to the buy-side of its range and held its position in strength, while MACD simultaneously has made a strong turn higher (although remaining on the sell-side of its range, much like late-February).

Yet it also appears momentum's strong upside reversal might be imminently due for a cooling period, though — something bringing more sustainable balance. So, over the next several days we more likely might be treated to a wash — sideways trading.

A couple differences, now versus late-February, deserve notice. One is that MACD registered a positive divergence prior to the market's rally off July 2nd bottom. Most immediately, this might be seen exciting the early bid and even precipitating the second notable difference, now versus late-February: such relative strength imbalance as one might better associate with a fleeting advance, rather than a sustained charge higher, such as occurred off late-February bottom.

This latter consideration ought be contemplated in the context of a far larger number within the financial and political arenas who persist in their witless worship of the dead. These might be hyper-charged now to jump in. Thus, present technical imbalances might widen further. Wave (c) of (2) might rapidly rush to its end, rather than slowly step higher, as occurred throughout March.

Imagine increased excitement precipitated by a strong move higher from here. Think of the suckers whose number might swell more greatly upon any pullback following rapid completion of wave (c) of (2). These likely will be playing what is believed a correction in a larger move higher. Their reward soon following still looks to be slaughter...


Fast Money
* * * * *

© The Risk Averse Alert — Advocating a patient, disciplined approach to stock market investing. Overriding objective is limiting financial risk. Minimizing investment capital loss is a priority.

Analysis centers on the stock market's path of least resistance. Long-term, this drives a simple strategy for safely investing a 401(k) for maximum profit. Intermediate-term, investing with stock index tracking-ETFs (both their long and short varieties) is advanced. Short-term, stock index options occasionally offer extraordinary profit opportunities when the stock market is moving along its projected path.

Nothing is set in stone. Nor is the stock market's path of least resistance always known. More often than not, there are no stock index option positions recommended.


There's an easy way to boost your investment discipline...

Get Real-Time Trade Notification!