Friday, November 28, 2008

Welcome to the Nervous Nelly Shakedown Trade


Believe it or not, the stock market appears poised for an explosion higher. Despite this week being the best since 1974 ... and the past five days being the best since 1933 ... I am wont to ask: could the most positive week ever be up next?

The negative, fear-filled sentiment prevailing in the retail community seems quite fitting, because it is, indeed, the stuff powerful advances are made of.

Likewise, this distrustful attitude presently pervasive apparently found technical manifestation...


$VIX

Strange... Didn't the stock market advance today? Why, then, did volatility increase? Could it be there's a prevailing belief the best five days since 1933 must be followed by selling? Apparently, options writers seem to think so. I, on the other hand, am not so sure.


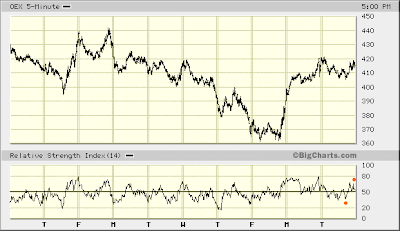
OEX 5-min

Weren't pre-market futures pointing down this morning? Why, yes, they were. However, judging by how RSI held to the buy-side today (i.e. above 50), this probably was meant to provoke the Nervous Nelly crowd to give up their shares. I would not be surprised to see the same thing on Monday.

Now, you might wonder why there's no price-RSI divergence worth noting, Monday (11.24.08) versus today. Quite simply, it's an Elliott Wave thing. There has been no complete wave form — impulse or corrective — against which to meaningfully apply this seeming price-RSI divergence and thereby conclude the market is slated to decisively turn lower. Rather, RSI suggests the best of the market's advance since last Friday probably is yet to come.

Both the NYSE and NASDAQ McClellan Oscillators suggest the same. You really have to like the fact both Oscillators diverged at last week's bottom, as did both Summation Indexes. (This latter point represents a new development. Just look back over the past year at every instance when the McClellan Oscillator shot higher into the positive. Not once were both respective Summation Indexes simultaneously diverging. This lends considerable weight to the likelihood a rock-solid bottom is forming, if it is not already in place.)

Relatively speaking, I suspect we might see the market more or less trade straight up over the course of the coming week, come what may starting the week off. Today appears to have marked the start of a new phase I am calling "the Nervous Nelly shakedown."

Once this initial launch off last week's bottom completes, look for many a Nervous Nelly to enjoy one last gasp squawking about this and that having more to do with the economy than with prospects in the stock market. I expect they might get a few additional weeks subsequently to say, "I told you so." In the end, however, chances are these people will be abused, much like the long side has been throughout much of '08...


Fast Money
* * * * *

© The Risk Averse Alert — Advocating a patient, disciplined approach to stock market investing. Overriding objective is limiting financial risk. Minimizing investment capital loss is a priority.

Analysis centers on the stock market's path of least resistance. Long-term, this drives a simple strategy for safely investing a 401(k) for maximum profit. Intermediate-term, investing with stock index tracking-ETFs (both their long and short varieties) is advanced. Short-term, stock index options occasionally offer extraordinary profit opportunities when the stock market is moving along its projected path.

Nothing is set in stone. Nor is the stock market's path of least resistance always known. More often than not, there are no stock index option positions recommended.


There's an easy way to boost your investment discipline...

Get Real-Time Trade Notification!

Thursday, November 27, 2008

Emergency Retirement Recovery: The Battle for Investment Survival


Let's talk high-stakes turkey...

Why are those who get hysterical about the growing array of government bailouts — the list of petitioners with cup in hand lengthens with each passing day — failing to ask the most fundamental question of all:

Are we bankrupt?

This really is the crux of the matter. We simply do not generate enough economic wealth to honor all financial claims. At the root of the problem is not a long line of money grubbers who want something for nothing. This is rather a symptom than a cause.

Instead, the problem lies in belief finance reigns supreme. Yet in truth finance should rightly be only a means to an end. It should be servant, not master.

Indeed, is this not why we invest? And when adequate returns fail to materialize what are we left to conclude? The endeavor is vanquished! The idea proved bankrupt. So, we deal with it and move on.

This applies as much on a social level as it does in one's own individual experience...

So, let's consider the case of the "balanced and diversified" retirement portfolio preached by many a glorified salesperson pretending to be financial advisors...

Does anyone stop to ask who benefits with a strategy forcing you to save much more for retirement than you really need? If only this were the worst of it! What is the lame rejoinder to this hallowed retirement investment approach after it has proven you vulnerable to swallowing huge losses? It's "no one can predict what the market will do."

Puhlease! You know as well as I do this simply is not true.

Which fact should lead the reader whose "balanced and diversified" retirement portfolio just took a giant hit to conclude the reality of our present state of bankruptcy quite evidently leaves little place to hide, beyond the safety of short-term debt securities (even here, though, potential problems have necessitated government guarantees on money market funds ... which, itself, demonstrates the depth of systemic insolvency).

The "balanced and diversified" investment strategy has been vanquished. So, heed Ben Franklin's wisdom, then, because the definition of insanity is doing the same wrong thing over again and expecting different results.

Now, about the so-called "Retirement Emergency" some are claiming. You want to make its impact insignificant? You want to recover 401(k) losses quickly?

Close your eyes. Imagine it's 1932. Great fortunes in the stock market have been lost. Yet those wise enough to see the writing on the wall are now in great position to make some serious bank ... and with little risk at all.

Truth is the real Retirement Emergency lies in waiting. Chances are a hyper-inflationary blowout is being hastened with each new trillion being added in a vain attempt to sustain a completely unsustainable financial arrangement.

So, how might you best protect the purchasing power of your retirement savings?

My advice is become an expert investor in just one blessed thing. Take it from the author of "The Battle for Investment Survival," Gerald Loeb, who in 1935 had a thing or two to say about the fallacy of diversification.

Because difficult times ahead stand to prove this lesson again...

* * * * *

© The Risk Averse Alert — Advocating a patient, disciplined approach to stock market investing. Overriding objective is limiting financial risk. Minimizing investment capital loss is a priority.

Analysis centers on the stock market's path of least resistance. Long-term, this drives a simple strategy for safely investing a 401(k) for maximum profit. Intermediate-term, investing with stock index tracking-ETFs (both their long and short varieties) is advanced. Short-term, stock index options occasionally offer extraordinary profit opportunities when the stock market is moving along its projected path.

Nothing is set in stone. Nor is the stock market's path of least resistance always known. More often than not, there are no stock index option positions recommended.


There's an easy way to boost your investment discipline...

Get Real-Time Trade Notification!

Wednesday, November 26, 2008

All Praises to "Team Hyper-Inflation"


Is a taste of things to come about to unfold?

In A 401(k) Investor's Guide to the Year 1932 I spoke of the stock market's pending bottom, indicating, "once bottom is in an explosive rally could ensue, and carry indexes strongly higher with scarcely a pause." It's the "scarcely a pause" part I am curious about tonight...

As you know, I suspect the market is continuing to correct its September-October collapse. In other words, I still am assuming indexes have not bottomed yet.

Nevertheless, the market's ongoing consolidation of earlier crushing losses might make this moment one where a taste of things to come produces conclusive evidence the worst of selling is over ... despite the probability more selling — a retest of last week's bottom — remains on the radar.

What I am attempting to get at is this... Wouldn't it make perfect sense that, if the market is just one more decline away from bottoming, a strong, persistent rally might immediately precede this final move lower? This could serve to bring various technical measures to their most positive readings in months.

Indeed, you saw this yesterday in the chart of the CBOE Put/Call Ratio. My goodness, the most positive reading all year has just been registered! That's a good sign. It suggests the market's bottom is near. Confidence apparently is building.

This also is how one might read OEX Put-Call Open Interest. Right now, OEX open interest is notably slanted to the Call side ... which, given the extent of this (40,000+ more Call contracts open, versus Put contracts), is all the more peculiar at this [early] moment in the December contract's life in the "front month."

Now, given the market's performance over recent months, it really is little surprise the December OEX contract is revealing a preponderance of positions short-the-market being hedged by Call options. Yet the notable extent of this hedging suggests there's less conviction toward the likelihood the market's decline, indeed, will continue (which stands to reason given how far the thing has fallen already).

As such, then, it's possible some significant portion of open OEX Calls also are outright speculations initiated by strong hands possessing power to make the market move both in favor of these Call positions (i.e. up) ... as well as in favor of short positions being hedged.

Of course, the reason I suspect these things has everything to do with Elliott Wave-related considerations. A powerful advance ... with scarcely a pause ... "fits" right here ... as does a subsequent retest of last week's lows.

Adding weight to the possibility the market's present rally will continue with vigor are various technical measures which, like the CBOE Put/Call Ratio yesterday, might be poised to register their most positive readings in some months... like, for example, the Bullish Percent Index ...


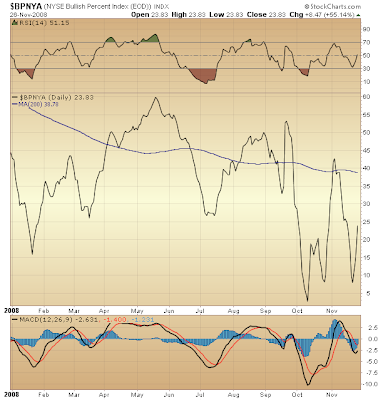
$BPNYA

As you can see, this bad boy has some way to go before it exceeds its election day peak. It has even further to rise if it is to best its September peak. What's clear here is the fact there's a lot of room for improvement in this measure were the market to continue its rise off last week's bottom.

This might be easier to visualize looking at the NYSE Composite Index...


$NYA

I like how MACD has strongly reversed higher, halting this month's perilous turn lower. This, itself, suggests a good deal of pent-up, underlying buying strength has awakened. You should duly note, too, this measure has a good deal further to rise before it exceeds its mid-September peak ... which result I fully expect, as this would be further indication underpinnings forming bottom are building.

Of course, volume coming in once again today, as the market extended its advance to four days straight (woo hoo!), is a red flag. However, there's absolutely no reason to get excited about this just yet, though.

Remember, those who are short-the-market are well-hedged with Call options. They can afford to step aside and allow the market to rise further. Indeed, they might even profit.

Furthermore, prospects for their short positions will be all the better if volume continues to come in as the present advance continues. Their work driving the market lower (at the appointed time) will be made all the easier. Being well-hedged here, they can afford to sit back and assess the market's underlying condition, waiting to begin their move to drive prices lower once buying interest thoroughly weakens.

So, how likely does it appear the market will continue its advance, then? Well, let's have a closer look...


NYSE 5-min

We saw weakness early in the day, much as I had anticipated ... but rather than proceeding to be a dull trade subsequently, the market demonstrated a good deal of strength. RSI's performance today — start to finish — reads positive, positive, positive ... not too hot ... not too cold ... but just right.

The market truly appears to be in a great position to continue its advance ... and stat.

All praises to "Team Hyper-Inflation" (and while we're at it, let's bankrupt the Treasury) ... for a job well done.

(Be sure to sing these praises every chance you get ... and let everyone know you heard it here first ... the home of Tomstradomus ... and his mine field of slippery banana peels ... which is no place for any self-respecting Monetarist Monkey ... so hit the road Volcker.)


Fast Money
* * * * *

© The Risk Averse Alert — Advocating a patient, disciplined approach to stock market investing. Overriding objective is limiting financial risk. Minimizing investment capital loss is a priority.

Analysis centers on the stock market's path of least resistance. Long-term, this drives a simple strategy for safely investing a 401(k) for maximum profit. Intermediate-term, investing with stock index tracking-ETFs (both their long and short varieties) is advanced. Short-term, stock index options occasionally offer extraordinary profit opportunities when the stock market is moving along its projected path.

Nothing is set in stone. Nor is the stock market's path of least resistance always known. More often than not, there are no stock index option positions recommended.


There's an easy way to boost your investment discipline...

Get Real-Time Trade Notification!

Tuesday, November 25, 2008

The Pause That Refreshes


Despite going nowhere today, you really have to like how the market held up...


OEX 5-min

You see a price-RSI divergence at today's low, leading to a turn higher ... then another during the last hour of trading, probably meaning the market will start the day Wednesday under some pressure.

The 400 area should be the vicinity where support builds. Other than the possibility of selling leading the market lower tomorrow ... serving to consolidate Friday's and Monday's gains ... trading might otherwise be rather dull.


$CPC

The relative collapse of the CBOE Put/Call Ratio should be seen as a double edge sword. On one hand, there appears to be belief in the market's charge higher from lows late last week. On the other hand, though, it appears something of a test of that belief might be in order. This could take several days...

If you're interested, check out my 401(k) Investor's Guide to the Year 1932.


Fast Money
* * * * *

© The Risk Averse Alert — Advocating a patient, disciplined approach to stock market investing. Overriding objective is limiting financial risk. Minimizing investment capital loss is a priority.

Analysis centers on the stock market's path of least resistance. Long-term, this drives a simple strategy for safely investing a 401(k) for maximum profit. Intermediate-term, investing with stock index tracking-ETFs (both their long and short varieties) is advanced. Short-term, stock index options occasionally offer extraordinary profit opportunities when the stock market is moving along its projected path.

Nothing is set in stone. Nor is the stock market's path of least resistance always known. More often than not, there are no stock index option positions recommended.


There's an easy way to boost your investment discipline...

Get Real-Time Trade Notification!

Monday, November 24, 2008

Bigger Bounce Coming in the Market's Bottoming Process


So, do you suppose the financial press will be picking up on my weekend piece detailing How Bankrupting the U.S. Treasury Makes for a New Bull Run? OK, so I lack Ben Franklin's diffidence...

Per the market's first two-day rally of the month, I have my doubts bottom is in. Indeed, the market's bottoming process seems likely to continue. Yet, still, over days ahead we might see a good deal of bullish excitement. The rally beginning on Friday appears slated to carry the market considerably higher...


$OEX

The line I have drawn above simply is a point of reference. Whether it might stand as resistance is suspect. In fact, there's growing reason to believe the S&P 100 could rise above its election day peak ... hit the brick wall somewhere slightly higher ... then subsequently grind lower into bottom.

If you look at the RSI panel, you see colored dots in the January - March '08 period corresponding with various turning points in the market's bottoming process at that time. I also similarly marked the present period, basing my points of reference solely on RSI behavior.

Obviously the current period is extending over a longer time frame. This probably stands to reason, given the market's relatively steeper fall September - October versus December '07 - January '08. Thus, selling excesses can be expected to take more time to wash out.

What's really interesting, though, is considering the Elliott Wave Principle's "Rule of Alternation" in relation to price-RSI performance now versus earlier this year.

So far, you can see the S&P 100 in the current period behaving precisely in opposition to the prior period. For example, at the white dot the S&P 100 failed to rise to a new, post-collapse, reaction high in the current instance, whereas back in early-February it did just the opposite. Similarly, at the red dot the S&P 100 sank to a new low in the current instance, whereas previously it did just the opposite.

If this alternating pattern continues, then at the blue dot we should see the S&P 100 rising above its election day peak. Similarly, in the final fall to bottom yet to come the S&P 100 might fail to reach a new low.

Obviously, there's really nothing terribly compelling about this analysis. It simply stands as a curiosity worth keeping an eye on...


OEX 5-min

Seems to me the 5-minute price-RSI relationship is pointing higher. The S&P 100's rush to a new high during the last hour was, indeed, confirmed by RSI.

Likewise, at no time today did RSI register an extreme buy-side reading (i.e. markedly above 80), which would suggest a crazed surge of bullishness was sweeping over the market (something not typically rewarded by buying taking prices still higher, at least not immediately).

Finally, today's late-day action resulting in RSI falling back to a position reflecting a relatively healthy balance between buyers and sellers suggests the market's rally since Friday is not overdone.

And the Fast Money gang is not exactly ecstatic about the gains we've seen over the past two days. I consider this another positive...


Fast Money

* * * * *

© The Risk Averse Alert — Advocating a patient, disciplined approach to stock market investing. Overriding objective is limiting financial risk. Minimizing investment capital loss is a priority.

Analysis centers on the stock market's path of least resistance. Long-term, this drives a simple strategy for safely investing a 401(k) for maximum profit. Intermediate-term, investing with stock index tracking-ETFs (both their long and short varieties) is advanced. Short-term, stock index options occasionally offer extraordinary profit opportunities when the stock market is moving along its projected path.

Nothing is set in stone. Nor is the stock market's path of least resistance always known. More often than not, there are no stock index option positions recommended.


There's an easy way to boost your investment discipline...

Get Real-Time Trade Notification!

Sunday, November 23, 2008

How Bankrupting the U.S. Treasury Makes for a New Bull Market


How best might the purpose for which the United States was formed effectively be destroyed?

This radical question defines a useful analytical framework for assessing prospects in the stock market over months ahead. Consequences it implies probably are quite the opposite of what you might initially think.

Truth is the effort to render impotent the principles for which this nation was founded is the trend that is your friend ... and this trend, indeed, has long coincided with the ascent of financial markets.

You do not need me to list the many ways government oversight of economy and finance have been purposely diminished over the last several decades. The leading role this has played in fostering excessive speculation is beyond dispute. Likewise irrefutable is the widening divide between haves and have nots effected by this policy, as well as material vulnerabilities that consequently proliferated as a result.

All effects proceed from an American government whose intended, constitutional power has been purposely usurped.

Herein lies the key to understanding the mindset of institutional elements responsible for bringing the nation (and the world) to this extraordinarily vulnerable point and why well-connected, private persons now in positions of authority are so brazenly working to further perpetuate a status quo which, clearly, has rendered government powerless and created dangerous instability both in finance and in the physical economy at large.

What today is being "saved" is only tomorrow's assurance the governing principles for which the United States was formed are essentially destroyed. This should be obvious simply by the fact a bankruptcy reorganization of the entire financial system is nowhere to be found in public policy discussion.

Therefore, our government's ballooning stake in a losing financial proposition — entangling taxpayers already burdened with untenable obligations — is but tacit surrender to an ideology whose well-demonstrated character reveals the face of tyranny that, in truth, cages liberty inside a mountain of unpayable debt.

These same elements use their diverse media holdings to lobby for the dismantling of domestic auto manufacturers. You do realize what role these industries played in building up a prosperous middle class, don't you? Do you understand how vital these industries proved in the fight against fascism some decades ago? Why, then, do you think the very same institutional opponents FDR subdued in his time, who dragged the nation into a Great Depression and who financed fascist movements throughout Europe, are on a drive to shut down domestic auto manufacturers? And if not this, then submitting these industries to a downsizing, attacking their "bloated costs" without so much as speaking a single word about the unlevel playing field American auto manufacturers have been condemned to compete upon by the very elements who, right now, seek their demise.

This, my friend, is how your power to live as you have been led to believe is your American birthright is being further attacked.

So, what has this got to do with investing, you ask?

Quite simply, I am convinced that, as long as the means for usurping the intended purpose of the American Republic can be furthered, the market will find legs. Contrarily, any truly American imperative — or even the threat of such directive coming into the public discourse — bolstering the effectiveness of representative government in its power to uplift the lives of all citizens, likely will result in steep declines.

You simply must recognize our present vulnerability as being something of a double-edge sword...

On one hand historic selling we have just witnessed is legitimately fear-based, because power concentrated in the hands of financiers who are unaccountable to principles involving "the general Welfare" stands at risk of being wrestled away by a government constitutionally charged to promote a profound modicum of stability and equity.

On the other hand such a desirable change in the state of affairs certainly would not have a deleterious effect on the capacity of the nation to generate wealth. Indeed, the effect all too likely would be quite the opposite! This, then, suggests chaos presently in our midst simply serves as a means of extortion. Practically speaking, the threat of calamitous collapse is principally intended to further consolidate financial and economic power in the same private hands who are responsible for having brought us to this extraordinarily vulnerable point in the first place.

Clearly, a sense of panic has been perpetrated upon Congress. Thus, the end desired by well-healed financiers who number among a contemporary contingent of what were in times past called "Loyalists" — an end that has been relentlessly pursued for decades through all manner of extortion and slander — is being rapidly achieved. The aim obviously is to bankrupt the Treasury and discredit American institutions of government. That a pathetically weak legislative body has succumbed to such blackmail is, indeed, repulsive to a patriot ... yet, too, should be rightly recognized as bullish for stocks, because the trend is your friend.

Same crap, different decade...

Yet now the desired end is hastened. The American Republic — long held hostage — stands at grave risk of being slain.

Moving on...

It appears most observers are claiming Timmy Geithner's selection as Treasury Secretary by President-elect Obama had nothing to do with the market's screaming, late-day rally on Friday. O contraire! I am willing to bet this news had everything to do with it. Could there be a better man to further the consolidation of financial power in private hands, while the power of the U.S. government is diminished?

Find me one mainstream media outlet who hasn't been falling all over themselves dishing out a heaping helping of Tory love. Are any questioning how fast Barclays moved into the Lehman building? Of course not! They're all in bed with those institutional elements whose actions have compromised the political, economic and financial integrity of the United States of America, period.

As long as this process is furthered, as presently has been accomplished, then I think you can bet financial markets will find their legs.

Appreciating the degree to which the United States' founding principals are being subverted via a swindle of epic proportions, one might then fathom how the latest chapter in this decades-old conspiracy probably has, for the most part, already played out. So, with this in mind, you might take stock in those strictly technical formulations I typically present here as, indeed, suggesting a significant bottom in the stock market is at hand.

Finally, in times like these one might reasonably anticipate political assassinations rearing an ugly head. Here, too, the intention likely would be to destabilize and weaken the U.S. government at a time when something valuable — something whose identity I could not even guess at the moment — is ripe for the grabbing. Again, given contemporary circumstances, I would be willing to bet such an event, were it to happen, would likely result in positive developments in financial markets.

Sick, I know. But this is the world we live in, pal...

* * * * *

© The Risk Averse Alert — Advocating a patient, disciplined approach to stock market investing. Overriding objective is limiting financial risk. Minimizing investment capital loss is a priority.

Analysis centers on the stock market's path of least resistance. Long-term, this drives a simple strategy for safely investing a 401(k) for maximum profit. Intermediate-term, investing with stock index tracking-ETFs (both their long and short varieties) is advanced. Short-term, stock index options occasionally offer extraordinary profit opportunities when the stock market is moving along its projected path.

Nothing is set in stone. Nor is the stock market's path of least resistance always known. More often than not, there are no stock index option positions recommended.


There's an easy way to boost your investment discipline...

Get Real-Time Trade Notification!

Saturday, November 22, 2008

401(k) Investor Guide to the Year 1932


A bullish outlook toward the stock market by no means requires one believe all is well. Indeed, I may be "the Chip Diller of Stock Market Analysts," but I also am a realist. I appreciate the many reasons for hysteria common among bears. Truly, I do.

Nevertheless, successful investing sometimes requires one be an opportunist even when the fundamental background appears dire.

Take, for example, the fact the Great Depression extended throughout the entire decade of the 1930s. Economic and financial circumstances were extraordinarily strained, and by no means resembled conditions prevailing during the Roaring '20s. Difficulties persisted ... unemployment remained high ... life was no bowl of cherries for most Americans ... the prospect hard times might never end dominated public opinion.

Yet despite all this, the stock market, after having bottomed in 1932, more than doubled by 1940.


DJIA monthly

So, starting with this background let's consider the possibility the present moment bears some compelling similarity to the stock market's bottom in 1932...

Let me be clear. I certainly am not suggesting there is a high probability the stock market will rise for decades to come, much as occurred post-1932. Nor do I suppose the market's pending bottom will even hold up. Indeed, today's lows could be exceeded sometime over the next few years. I continue to believe the Dow Jones Industrials Average could fall to the vicinity of 3600, as the market "corrects" its advance from 1974-2007.

With this in mind, then, let's consider why the market bottomed in 1932, and do so by making just one reference to factual reality at that time in history. Truth is the banking system did not go into a death spiral until after the stock market bottomed. So, what made the market rise?

Well, I couldn't tell you. All I can see is it clearly did.

One thing is certain, too. Sellers no longer overwhelmed buyers. Likewise, buying interest came from players whose pockets were deep enough to create an environment conducive to a rising bid.

So, deciphering various technical formulations I have found useful for nearly 25 years I can develop an objective basis for strongly suspecting similar circumstances leading to the 1932 bottom and subsequent advance likewise might be present here.

Bottom line... the current environment probably represents a low-risk opportunity to get long the stock market in your 401(k).

Even if your 401(k) has been safely sheltered in a money-market fund (per my May 10, 2008 alert), you might want to consider wading back into stocks. This alters my October 18, 2008 view, when I was relatively more ambivalent toward the stock market's intermediate-term prospects. I simply thought any pending rally — likely to be the strongest advance in five years — might be too fleeting to think about risking your 401(k) capital. That's why I said, "[If] your 401(k) presently is safely sheltered in a money-market fund, you really don't need to change a thing."

However, truth is I simply cannot ignore the likelihood a low-risk opportunity exists here. A sustained rally lasting some months, indeed, appears rather probable.

Right now it appears you have some time to position your 401(k) in the stock market. The ongoing bottoming process seems likely to continue over coming weeks. Yet once bottom is in an explosive rally could ensue, and carry indexes strongly higher with scarcely a pause. So, just be aware of that, too.

If you are unsure about what to do, then get my recommended strategy for smartly positioning your 401(k) in select stock market investment alternatives your plan offers.

Send an e-mail to:

Subject: 401(k) STRATEGY

When it comes to your retirement ... time truly is of the essence. That's why low-risk opportunities to score fat, double-digit percentage gains investing in the stock market simply should not be passed up. This is particularly true when a projected advance is slated to last many months, and possibly some years. Such an occasion, indeed, appears at hand...


NYSE weekly

This is the arithmetically-scaled chart of the NYSE Composite I presented in 20/20 Hindsight Meets $20 Million Foresight. I wanted to magnify the area of price support this Elliott Wave Guy finds in "the fourth wave of one lesser degree" (which in this case is wave (4) of from 1987-1994).

I see strength here. Weekly RSI is diverging (from its October '08 reading) as the Composite has fallen to a new low for the year ... which, coincidentally, is at the bottom of its [ascending] range (extending the 1987-1994 period forward) ... and which intersects the area where the market found legs back in '02 - '03 ... having declined on relatively tame volume (not at all revealing any sort of panic-stricken, dumping of shares onto the market) ... which, itself, means the "vested interest" has not thrown in the towel and given up hope. All these substantiate my view that, a technically positive condition exists here.

So, if you ever were looking for a low-risk entry point into the stock market, this is it.

The reason why is because you have strong basis for cutting your losses if these presumably positive technical indications fail. Are you following? Going long the stock market here is low-risk because you have an opportunity to objectively set tight stop-losses.


NYSE weekly

As you can see, another line of support — the NYSE Composite's rising trend line since 1974 (the blue line) — has been reached. So, that's another positive.

What I wanted to show here, though, is upside potential. Do you see the [gray] rising channel from 1982-2000? This channel contains wave of V.

(Wave V began in 1974, and is the fifth wave of five waves from 1932.)

When the bottom end of this channel gave way in 2002, the support it once provided subsequently became resistance. You see how the NYSE Composite bumped up against this resistance 2004-2007. Although the index persistently rose once it bottomed in '02 - '03, it never really decisively penetrated this [rising] line of resistance.

Fast forward to the present...

The [red] rising channel from 1974-2007 contains all five waves of wave V. As you can see, support at the lower end of this channel gave way during the market's September - October collapse.

So, could we see this former line of support act as resistance over months and years ahead?

Seems reasonable. Now, look at the percentage gain an advance back up to this area of resistance represents. Nice. Your 401(k) would stand to be rather positively affected...


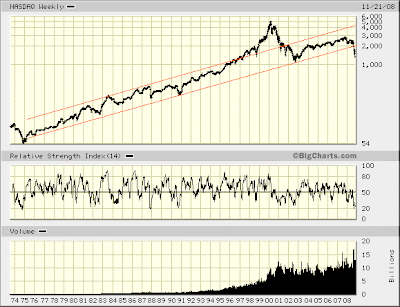
NASDAQ weekly

I wanted to give you a picture of how things are shaping up on NASDAQ. The lines drawn above are entirely arbitrary compared to those defining NYSE Composite Elliott wave channels I just presented. Still, you see how areas of "support" and "resistance" appear to have developed...

NASDAQ weekly

The NASDAQ Composite's five-wave channel from 1974, I believe, ended in 1997. Since then (believe it or not) the NASDAQ Composite has been in "corrective" mode. Part I unfolded from 1997-2002. Part II presently is forming.

Elliott Wave-related considerations have me supposing the NASDAQ Composite could rise above its peak in 2007. Here, I suspect the lower end of NASDAQ's channel — formerly a line of support — may not act as resistance.

Or ... maybe it will ... thus, giving rise to the possibility the market might remain rather buoyant for at least the next couple years.

Get my recommended strategy for smartly positioning your 401(k) in select stock market investment alternatives your 401(k) plan offers.

Send an e-mail to:

Subject: 401(k) STRATEGY

* * * * *

© The Risk Averse Alert — Advocating a patient, disciplined approach to stock market investing. Overriding objective is limiting financial risk. Minimizing investment capital loss is a priority.

Analysis centers on the stock market's path of least resistance. Long-term, this drives a simple strategy for safely investing a 401(k) for maximum profit. Intermediate-term, investing with stock index tracking-ETFs (both their long and short varieties) is advanced. Short-term, stock index options occasionally offer extraordinary profit opportunities when the stock market is moving along its projected path.

Nothing is set in stone. Nor is the stock market's path of least resistance always known. More often than not, there are no stock index option positions recommended.


There's an easy way to boost your investment discipline...

Get Real-Time Trade Notification!

Friday, November 21, 2008

Would Uptick Rule Exacerbate Short Selling During a Melt-Up?


Cramer's show opener tonight was a first-rate, top notch summary statement of the way I see things in the stock market...

Stocks are just one among many asset classes ... and a most liquid one at that. Sometimes, too, practical matters affecting their trading are independent of reasonable business prospects surrounding the issuing companies. That's just the way it is in the money management game.

In other words, there are many factors influencing the stock market. These go well beyond micro company analysis that's the typical fare of the financial industry and the media who report on business. Cramer's insights, indeed, belong under "Things I Believe," over to the left.

And since I brought it up, I wanted to briefly mention something about my belief that, "Sometime over the next 3-5 years the Dow Jones Industrials will fall to the vicinity of 3600."

Before the end of this weekend I am going to change "will" to "could." That's how strongly I feel about the probability a major bottom is at hand.

So, on this count I part company with Mr. Cramer, who is maintaining a defensive stance.

(You might duly note, though, his remarks about there being scores of cheap companies wishing to go private ... if only financing were available ... likely is a better informed view on potential sectors poised to outperform, should the market return to its winning ways ... as I strongly suspect is about to happen. Contrarily, I have been looking at the TARP as a means for financing an avalanche of shotgun M&A ... which appears the course Citigroup is being set up to take.)


$OEX

The market's correction since October 2007 is textbook Elliott Wave. What of the wave count I have indicated above certainly is by no means set in stone. Plainly, however, three component waves — wave (a) down, wave (b) up, and wave (c) down — of a larger "corrective" wave have unfolded since last October's top. The five [unlabeled] waves forming wave (c) are just about completed.

Now, as you know, I use a handful of technical measures to help confirm the Elliott Wave structure I believe unfolding. This takes on several dimensions. Those of you who have been reading me for a time, I gather, see the light. Although I try to keep things simple, surely you recognize the dynamic nature of the analytical twists my methodology adds.

So, here ... being very near what I believe will prove a significant bottom ... with the fifth (and final) sub-wave of wave (c) forming ... we should expect technical conditions typical at turning points. And man are we ever flush with these!

From deeply oversold ... to divergences galore ... Don Luskin, perma-bull, in hiding (as would be Kudlow, too, if he didn't have a show to do) ... sentiment in the crapper ... fear about as high as I've ever seen it ... VIX at a record ... and no one — no one but me — thinking a spectacular melt-up is even possible.

First, though, we need a bottom...

So, take a look at RSI and MACD at the March 17, 2008 bottom. Their divergence from respective readings at a higher S&P 100 low in January '08 are plain to see. We see the same thing now relative to October. This is a good indication bottom is forming.

Looking more closely, you also see both measures diverge relative to their respective readings at a higher S&P 100 earlier in the month of March. This, I think, is what we should be looking for here, too.

One word of caution... The day we hit bottom could be a wild one. It's possible the market could be down big, intra-day, then finish with a roar higher.

If you're wary of my positive outlook, just be aware of this, because it might be a great time to close your eyes, hold you nose and establish a ProShares Ultra Long position. I took my first stab on Monday. Despite being down for the moment, I'm not one bit worried.

I will detail my position over the weekend with an overview of the big picture. For now, let me just say nothing changes my view about the market's advance from 1974 through October 2007. I believe for some years to come that advance likely will be corrected. The past year was but Part I.

What's still to come in the grand scheme of things may or may not lead to Dow 3600.

What's straight ahead, indeed, could be straight up...

Picture this. A legislative move to repeal "mark to market" accounting and/or reinstate the uptick rule. Imagine the reaction! You think the British Empire's boy, Timmy Geithner, made for a good close...


Fast Money
* * * * *

© The Risk Averse Alert — Advocating a patient, disciplined approach to stock market investing. Overriding objective is limiting financial risk. Minimizing investment capital loss is a priority.

Analysis centers on the stock market's path of least resistance. Long-term, this drives a simple strategy for safely investing a 401(k) for maximum profit. Intermediate-term, investing with stock index tracking-ETFs (both their long and short varieties) is advanced. Short-term, stock index options occasionally offer extraordinary profit opportunities when the stock market is moving along its projected path.

Nothing is set in stone. Nor is the stock market's path of least resistance always known. More often than not, there are no stock index option positions recommended.


There's an easy way to boost your investment discipline...

Get Real-Time Trade Notification!

Thursday, November 20, 2008

The Politics of Financial Chicken


Just so you know ... this is where the rubber meets the road, because bottom appears at hand.

Does your 401(k) have a fund tracking the S&P 500? Then, get ready to close your eyes and allocate 25-50% of your investment capital to it. You'll thank me later, I think. I'll write more this weekend. There's no hurry to do this, really. But if we're days away from a stock market melt-up, you'll not want to wait long either.

You have heard what you should do when there's blood in the streets, haven't you? Because it is times like these the faint of heart run to Treasuries...


$IRX

A 3-month Treasury Bill yielding 0.06% ... on a gap lower no less. Yeah, yeah, yeah, credit spreads are blowing out. But might "shoot first, ask questions later" be the order of the day driving trading into safety? How much of this run into Treasuries, itself, is causing credit spreads to widen?

More to the point...

Are you watching the theater playing out in the Congress?


C'mon. Do you really think these people are going to let the U.S. auto industry fall into bankruptcy? So, what is the so-called leadership of the Democratic Party doing? Could it ... could it ... could it possibly be holding a Damocles Sword above the free market?

Chairman Bernanke! Start your helicopters...

Surely, the threat of an uncooperative Congress in the face of pending bankruptcy of the single largest industry in the United States makes for a very convincing reason to seek shelter in the safety of Treasury securities. Yet there should be no doubt: if the auto industry goes, the world as we know it is over.

NEWSFLASH!

It ain't gonna happen.

The game of financial chicken just gets seriouser and seriouser with each passing day...

Did you hear the date Senator Reid gave the auto industry to come up with a plan demonstrating "accountability?" Call it a ringing bell. The stock market's bottom should be in by then.

Let me tell you something else, too. Keith Boykin of "The Daily Voice" — an Obama spokesperson — spilled the beans tonight, telling the financial world the same thing I have been telling you...
"Obama will have more authority if things fall apart prior to his inauguration."

Duh! This is the same reason FDR didn't lift a finger to help Hoover as the banking system unraveled during the post-election (November 1932), pre-inauguration (March 1933) period.

Am I to believe a financial community whose best friend just so happens to be Treasury Secretary is about to let this happen? I think not.

Now, maybe I am wrong. Maybe there's nothing that can be done to stop the bleeding. Maybe the auto industry will be thrown into bankruptcy before the end of the year. If that's the case, then look out below. I do not think this will happen, but then again, what do I know?

On a related note... What if the SEC brings back the uptick rule? (Check out my comment. Right or wrong, I cannot say. However, I'm willing to bet you might soon hear other voices raising the same suspicion.) More than a symbolic gesture, I suspect a return of the uptick rule could turn off the "easy money" machine a number of short-traders are reporting.

Onward...


$NYA

RSI and MACD are diverging ... much as should be expected at bottom ... and much as I have been anticipating.

Volume's pickup deserves watching (much as I should have been watching this in September, at the time of the Lehman Brothers' bankruptcy). Still, though elevated, volume today is in fact diverging from October 10th. So, the situation now, with today's decline to new lows, is a little different than September. Of course, tomorrow is a new day.


$NYHL

A positive divergence registered today as the NYSE Composite sunk to a new low while the differential between NYSE-listed issues hitting new 52-week highs and lows was not nearly as bad as registered in October.


$BPNYA

Another positive divergence registered here, too.

Ditto the NYSE McClellan Oscillator.

All the same positive technical divergences are present for measures tied to NASDAQ trading.

As difficult to believe as it might be during a week as bad as this one has been ... all indications suggest bottom is at hand. Within a matter of days the market's strongest rally in over five years should be getting under way...


Fast Money
* * * * *

© The Risk Averse Alert — Advocating a patient, disciplined approach to stock market investing. Overriding objective is limiting financial risk. Minimizing investment capital loss is a priority.

Analysis centers on the stock market's path of least resistance. Long-term, this drives a simple strategy for safely investing a 401(k) for maximum profit. Intermediate-term, investing with stock index tracking-ETFs (both their long and short varieties) is advanced. Short-term, stock index options occasionally offer extraordinary profit opportunities when the stock market is moving along its projected path.

Nothing is set in stone. Nor is the stock market's path of least resistance always known. More often than not, there are no stock index option positions recommended.


There's an easy way to boost your investment discipline...

Get Real-Time Trade Notification!

Wednesday, November 19, 2008

Get Ready to Kick Some Serious Financial Assets


Today's unexpected decline below last Thursday's low raises the probability the market's decline since May 19, 2008 is days away from ending. You heard it here first (at least that's what I'd like to believe anyway)...

Forgive me for appearing sanguine. Yet another huge day down — let's call it 6% ... wow — is seen as "standard fare" only in the context of what has come to pass, and what is quite likely still to come.

The reversal of fortunes I wrote about yesterday — a melt-up leaving most in the dust ... quickly turning today's worry into anguish over missing the boat — is squarely in my cross hairs. No kidding. This is not fanciful thinking. The evidence is all there...


$NYA

Not a thing has changed my Elliott Wave outlook published on October 26th. So, you might take a look at the chart of the NYSE Composite I presented there and fathom what I am about to say...

The fifth and final wave down (of five waves down since May 19, 2008) appears to have begun on the day following elections (11.5.08). Today saw the third wave of this fifth wave unfold, and it appears likely to complete tomorrow. Following this comes wave four of five, then wave five and five ... and then ... liftoff.

Last Thursday and Friday I wrote about my concern over 5-minute RSI ... noting it likely indicated the market's losing ways ... leading to yet more gnashing of teeth ... probably remained in store. This outcome simply came sooner than I anticipated.

A reader commenting on Thursday's post suggested the market's turnaround that day bore similarity to the sharp reversal we saw on September 18th - 19th. I duly noted the differences and stand by my conclusion, even today. Yet, now, I will elect to find such commonality as supports an Elliott Wave view wherein a "like from like" structure is being revealed in the market's 5-wave decline from May 19, 2008.

I'll not go into details. Rather, I'll let you connect the dots...


$NYAD

The red dots mark the worst (bottom) and best (top) A/D readings during the formation of first and second waves, respectively. The baby blue dots mark the worst (bottom) and best (top) A/D readings during the formation of third and fourth waves.

As I have said before, third waves typically are the most "dynamic." Therefore, in a third wave down, you would expect the worst A/D reading being registered (baby blue dots at bottom). The first you see (9.29.08) marks the worst A/D reading registered during wave 3 of c. The second (registered today) marks the third wave of wave 5 of c.

You might also note the baby blue dot at top (marking the best A/D reading during the formation of wave 4 of c) in relation to the red dot to the left of it (marking the best A/D reading during the formation of wave 2 of c). The technical improvement of this measure during the formation of the fourth wave versus the second wave is quite typical.

So, look for a repeat of this pattern as wave 5 of c completes.

(The green dots are meant to show price-A/D divergences during the formation of wave 4 of c ... for your geeky, technical edification.)

Just how things proceed from here remains to be seen. I suspect a so-called [declining] "diagonal triangle" might be forming in wave 5 of c. Likewise, for reasons I presented in 20/20 Hindsight Meets $20 Million Foresight I also suspect bottom is not much lower from here.

So, get ready to make some serious bank as a rocket higher appears days from getting under way...


Fast Money
* * * * *

© The Risk Averse Alert — Advocating a patient, disciplined approach to stock market investing. Overriding objective is limiting financial risk. Minimizing investment capital loss is a priority.

Analysis centers on the stock market's path of least resistance. Long-term, this drives a simple strategy for safely investing a 401(k) for maximum profit. Intermediate-term, investing with stock index tracking-ETFs (both their long and short varieties) is advanced. Short-term, stock index options occasionally offer extraordinary profit opportunities when the stock market is moving along its projected path.

Nothing is set in stone. Nor is the stock market's path of least resistance always known. More often than not, there are no stock index option positions recommended.


There's an easy way to boost your investment discipline...

Get Real-Time Trade Notification!

Tuesday, November 18, 2008

Left Fielder, Tomstradomus


Did I mention yesterday Cramer claims no one is calling for a big sell-off to follow on the disaster we've already seen in the stock market?

Well, you probably know as well as I do this simply is not true. Rather, it only is more generally the case those dream weavers on team Tory — both its left side (Happy Green Week!) and its right (just say no to protectionism threatening to ruin the free [falling] market) — abhor serious, principled dialog engaging voices that appeal to reason.

We saw this in the spring when the NY Times' Floyd Norris proclaimed, "It's a Crisis and Ideas are Scarce." (That's Tory code for stop worrying and bend over.)

Now, what's really missing from the analytical community who make the rounds in Tory Town is neither doom sayers nor cautiously optimistic book talkers. Rather, it's the gutsy forecaster who comes out of left field and says, "The thing I fear the most is a melt-up leaving most investors in the dust."

Enter Tomstradomus...


NYSE weekly

I recently suggested the market's bottoming process might be "similar to the July - October 2002 period." My thinking was that, "although October '02 marked bottom of a three-year bear market, a positive reversal of fortunes did not develop until March '03."

But what if the market's decline since October '07 is more like what unfolded from May - September 2001? Could a massive melt-up follow in this instance, too ... leaving little opportunity for the shell shocked to get on board and ride the bulk of the move?

Here's how I see it. If a melt-up could follow 9/11, it certainly could follow a most terrifying train wreck. I think Secretary Paulson would agree...
"As policymakers face the difficult challenges ahead, they will begin with two considerable advantages: a significantly more stable banking system, one where the failure of a major bank is no longer a pressing concern; and the resources, authority and potential programs available to deal with the future capital and liquidity needs of credit providers."

Let the government subsidized consolidation of financial power ... er, uh, I mean free market M&A ... begin!


$NYA

The Elliott Wave's channeling guideline has me wondering whether five waves down from May 19, 2008 might manifest in a manner similar to what I have drawn above. In this case bottom still might be several weeks away.

Or will bottom, instead, be reached in only a matter of days ... if not hours? Take a look at this...


$IRX

What trend might be noted over the past year or so whenever an unusual rush to the safety of T-Bills took hold? Has not each and every instance coincided with a significant turn in the stock market? Indeed it has...


Fast Money
* * * * *

© The Risk Averse Alert — Advocating a patient, disciplined approach to stock market investing. Overriding objective is limiting financial risk. Minimizing investment capital loss is a priority.

Analysis centers on the stock market's path of least resistance. Long-term, this drives a simple strategy for safely investing a 401(k) for maximum profit. Intermediate-term, investing with stock index tracking-ETFs (both their long and short varieties) is advanced. Short-term, stock index options occasionally offer extraordinary profit opportunities when the stock market is moving along its projected path.

Nothing is set in stone. Nor is the stock market's path of least resistance always known. More often than not, there are no stock index option positions recommended.


There's an easy way to boost your investment discipline...
Get Real-Time Trade Notification!