Monday, April 30, 2012

Collapse Detonator and Years Later


Let's say the market's rally since early October still has legs enough to maintain levitation a few weeks more. Here's how this might look...


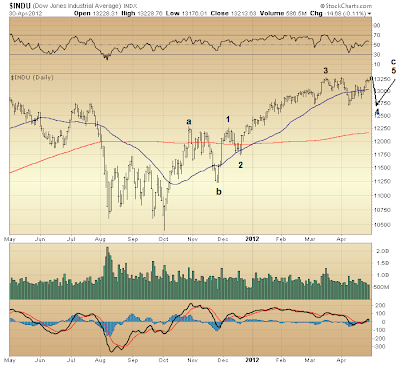
$INDU

It's not the first time this possibility has been considered. The Dow Industrials most nearly raises the prospect, as it came a shade on Friday from reaching its April 1st intra-day peak. Maybe it will get there tomorrow? If so, then a few weeks more prolonging levitation probably are in store.

Momentum (bottom panel) is an interesting study in relation to this possibility's development. Its three month fade, were it to continue, could see the next few weeks unfolding pretty much as drawn. Wave 5 of c also could prove a so-called "failure" (failing to exceed the peak of wave 3), while momentum could even peak slightly to the negative. Subsequently, it just might be impossible to buy another minute pretending impossible imbalances, physical and financial, are even remotely sustainable.

The euro-zone is a disaster requiring ever bigger bailout and ever more blood to wash the trail. Where there used to be a choice — inflate or die — now there is none. Inflate and die is Europe's future. Evidence of this reaching even political institutions already is impossible to ignore. How much more dismantling of a once predictable status quo might be immediately ahead amidst spreading desperation throughout the crumbling euro-zone? It's not looking pretty in Spain.

The mere increase in perceived risk of the EMU's disintegration, itself, could prove devastating: a veritable self-fulfilling prophesy. The manner in which markets are widely believed to lead the economy could in such an instance make the euro-zone's and the trans-Atlantic banking system's collapse a fait accompli. We should all remind ourselves that, the detonator has already gone off. Confidence required to endlessly inflate securities at the core of the banking system's fee-based orgy has been shot. Every bit of fundamental and technical evidence developing over the past three years confirms this. Again, the detonator was ignited in the 2007-2008 period. All appears since to be proceeding to the inevitable fat lady singing, while over the interim biding time and little else but breeding chaos of an historic sort. It is quite natural, too, this reality is largely ignored. Still, convulsions yet to come are likely no less perceived and feared than was true at the threshold of historic moments past, as well. Ill-founded hope ever waxes in spite of grave vulnerability hard to ignore. And yet now nothing extraordinary need tip over the applecart, as this part of the market's fall from grace already is done, as is confidence. Only the market's slide over cliffs edge is worthy concern here, be it tomorrow or a few weeks further down the road.


Fast Money
* * * * *

© The Risk Averse Alert — Advocating a patient, disciplined approach to stock market investing. Overriding objective is limiting financial risk. Minimizing investment capital loss is a priority.

Analysis centers on the stock market's path of least resistance. Long-term, this drives a simple strategy for safely investing a 401(k) for maximum profit. Intermediate-term, investing with stock index tracking-ETFs (both their long and short varieties) is advanced. Short-term, stock index options occasionally offer extraordinary profit opportunities when the stock market is moving along its projected path.

Nothing is set in stone. Nor is the stock market's path of least resistance always known. More often than not, there are no stock index option positions recommended.


There's an easy way to boost your investment discipline...

Get Real-Time Trade Notification!

Friday, April 27, 2012

Dollar Debasement Fail


A currency-related curiosity for your consideration...


$USD

Don't ask me why, but whenever the relative performance of the U.S. Dollar Index versus the S&P 500 crossed above its 20-week exponential moving average these past few years (see red dots in the bottom panel), the market soon afterward came under pressure. What could this be in the face of attempts to sustain an unstable mountain of credit securities and assorted derivatives via hyperinflationary bailout? Dollar debasement fail? Something to keep an eye on.


Fast Money
* * * * *

© The Risk Averse Alert — Advocating a patient, disciplined approach to stock market investing. Overriding objective is limiting financial risk. Minimizing investment capital loss is a priority.

Analysis centers on the stock market's path of least resistance. Long-term, this drives a simple strategy for safely investing a 401(k) for maximum profit. Intermediate-term, investing with stock index tracking-ETFs (both their long and short varieties) is advanced. Short-term, stock index options occasionally offer extraordinary profit opportunities when the stock market is moving along its projected path.

Nothing is set in stone. Nor is the stock market's path of least resistance always known. More often than not, there are no stock index option positions recommended.


There's an easy way to boost your investment discipline...

Get Real-Time Trade Notification!

Thursday, April 26, 2012

A Moment Made For Performance Chasers


Just another day in keeping with the post-2008 mantra of "every minute counts." One of these days weakness upon weakness (both fundamentally and technically) registering these past three years riding waves of trillions propping up an insolvent banking system will turn the market more reminiscent of calamity whose "avoiding" is by every indication impossible. It's not a question of if profound vulnerability turns to chaos, but when, while truth remains it could be any minute now...


$SPX

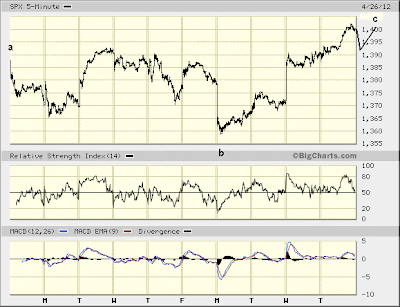
Both relative strength and momentum remain in synch with a view supposing a 2nd wave of five waves down from April 1st peak is nearing completion. Seeing this prospective 2nd wave in the S&P 500 correct to the range within the preceding 1st wave where the fourth of its five waves down formed further supports prospect that, a hard turn south is in store. You couldn't ask for a more favorable technical backdrop projecting a steep fall.

Which is not to claim exhausted is power still to buy hours making every minute count.


SPX 5-min

This week's advance probably has legs enough to suck in the end of month technical trade driven to highly correlate with recent winners. The sudden surge in NYSE-listed issues hitting new 52-week highs suggests this phenomenon probably is behind this week's advance. Yet rather than diminishing prospect of a hard turn south, the likelihood might be thought more assured with "confidence" evidently returning to the ever-shrinking pool of leaders. Like other technical measures, this one too presents a dilemma wherein the market's upside prospect can be reasonably supposed limited, while its downside potential appears only the more fearsome in the face of long-developing, underlying technical weakness coinciding with the market's incredibly prolonged levitation. Truth is one of these days persistently accumulating weakness all too likely will matter more than today's performance chasers dare fathom.


Fast Money
* * * * *

© The Risk Averse Alert — Advocating a patient, disciplined approach to stock market investing. Overriding objective is limiting financial risk. Minimizing investment capital loss is a priority.

Analysis centers on the stock market's path of least resistance. Long-term, this drives a simple strategy for safely investing a 401(k) for maximum profit. Intermediate-term, investing with stock index tracking-ETFs (both their long and short varieties) is advanced. Short-term, stock index options occasionally offer extraordinary profit opportunities when the stock market is moving along its projected path.

Nothing is set in stone. Nor is the stock market's path of least resistance always known. More often than not, there are no stock index option positions recommended.


There's an easy way to boost your investment discipline...

Get Real-Time Trade Notification!

Wednesday, April 25, 2012

Gods of Garbage Smile on a C Wave


As predicted, the market remains in a precarious position on the short coattails of AAPL's 9% surge, while AAPL's prospective crash appears only the more likely on the heals of such a volatile, one-day move in the stock's price.


$NYA

Whether the Elliott wave count above holds up is a prospect made more likely by underlying technical conditions whose deterioration across the board reveals just how precarious is the market's current position. Anticipating a hard turn south, you really couldn't ask for a more favorable backdrop. Thus, today's lift and any follow-through appears but a "c" wave higher, unfolding in formation of a 2nd wave of five waves down. A 3rd wave down from April 1st peak could begin to unfold before the end of the week.


Fast Money
* * * * *

© The Risk Averse Alert — Advocating a patient, disciplined approach to stock market investing. Overriding objective is limiting financial risk. Minimizing investment capital loss is a priority.

Analysis centers on the stock market's path of least resistance. Long-term, this drives a simple strategy for safely investing a 401(k) for maximum profit. Intermediate-term, investing with stock index tracking-ETFs (both their long and short varieties) is advanced. Short-term, stock index options occasionally offer extraordinary profit opportunities when the stock market is moving along its projected path.

Nothing is set in stone. Nor is the stock market's path of least resistance always known. More often than not, there are no stock index option positions recommended.


There's an easy way to boost your investment discipline...

Get Real-Time Trade Notification!

Tuesday, April 24, 2012

One Bad Bunch Will Spoil the AAPL


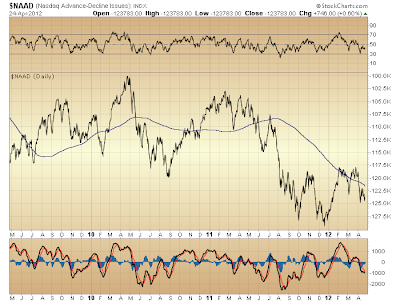
First things first. Keep in mind tomorrow when the world is abuzz with AAPL, the iPhone's coattails have been growing ever shorter these past couple years. This is according to NASDAQ's cumulative advance-decline line, whose current position relative to the NASDAQ Composite Index speaks of a violent crash in waiting...


$NAAD cumulative

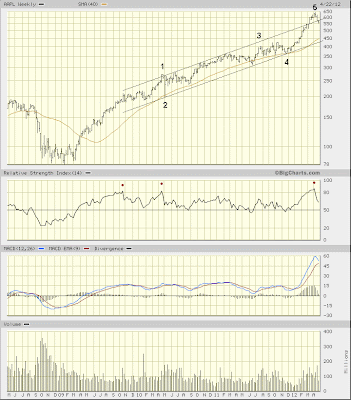
And wouldn't you know it, NASDAQ's very darling is poised to oblige...


company chart ($AAPL)

If formation of wave 2 in ... drum roll ... May 2010 isn't the strangest coincidence here at the prospective conclusion of five waves up in AAPL. The fifth wave of wave 1 unfolded much like wave 5, carrying RSI from 50 straight up to its peak extreme. This time even more so. One thing appears clear. AAPL's recent relative strength surge makes it highly unlikely $1000 will be seen anytime soon. Rather, AAPL appears a fine candidate for a 38.2% haircut, now that its momentum has been lost. A crash back to the range in which wave 4 formed ($350-$400) is very much in the cards.

There has been nothing technically "saving" about yesterday's and today's grind higher following the thud lower to start the week's trading. By all measures the market remains in a precarious position. I suspect this might not change tomorrow, given the likelihood AAPL's after hours gain of 7% is carried forth to the market at large using all the mechanisms the hopelessly bankrupt have for drumming up excitement in garbage left in the ruins of their collapsed Ponzi scheme, all the while only exercising unchanged reality wherein every minute counts.


Fast Money
* * * * *

© The Risk Averse Alert — Advocating a patient, disciplined approach to stock market investing. Overriding objective is limiting financial risk. Minimizing investment capital loss is a priority.

Analysis centers on the stock market's path of least resistance. Long-term, this drives a simple strategy for safely investing a 401(k) for maximum profit. Intermediate-term, investing with stock index tracking-ETFs (both their long and short varieties) is advanced. Short-term, stock index options occasionally offer extraordinary profit opportunities when the stock market is moving along its projected path.

Nothing is set in stone. Nor is the stock market's path of least resistance always known. More often than not, there are no stock index option positions recommended.


There's an easy way to boost your investment discipline...

Get Real-Time Trade Notification!

Monday, April 23, 2012

Irrational Exuberance Sweet 16


Much to Team Fraud's chagrin the German plan to wreck euro scrip by natural means moved forward in France yesterday and Holland today. Yet another leverage prop stands weakened. Thus, the deflationary collapse-o-meter continues reading a resounding "it's not risk on," while at the same time the hyperinflationary blowout-o-meter is in its worst state in a long time, with its 50-day moving average falling below its [still decidedly rising] 200-day for the first time in several years.

Being that uncontrolled debt destruction has a known history, what of the same might sooner be in store probably was the guide ushering "risk" to the exits today. What more flight might be in store as we head into summer still remains a mystery. It could be just breathtaking. Say, something decidedly crushing any hope for recovery. This would be along lines I suggested in "Alternate View, Take II."

In light of this risk the following view toward prior threats turned back in the travails and triumphs of Ponzi finance offers a guidepost for assessing the present threat as it develops over days and weeks ahead...


$SPX weekly

Coincidentally enough, both lines I have drawn virtually intersect the moment Alan Greenspan spoke of "irrational exuberance" whose predicted effect would bring "unduly escalated asset values, which then become subject to unexpected and prolonged contractions." An incompetent central banker, yes, but the evidence certainly vindicates this, his 1996 forecast.

As you can see, any time the S&P 500 has fallen below its top line of support there was a perceived danger threatening what were otherwise highly accommodating credit market mechanics feeding "irrational exuberance." That each new threat increased in gravity and required evermore radical intervention to reverse it — with but the first in 1996 inspiring Greenspan's insightful forecast — is evidenced by a bottom line of support that is descending, thus the more vindicating the maestro's warning.

Best case going into summer the S&P 500's top line of support will hold. Worst case, its bottom line of support might not even find opportunity to be tested, and instead become overhead resistance in a fast-evolving panic unlike anything ever to hit the financial world.

It practically goes without saying the architecture of U.S. stock exchanges these days is well-suited for facilitating calamity: built to make a cold shoulder the answer to great need. We see this sort of sentiment in actions negatively affecting European banks holding sovereign debt. So, securities at the bottom of the capital structure — equities — could just as well meet a moment when, indeed, they are similarly shunned. In such a climate exchange circuit breakers might prove useful only in prolonging misery some number of days. Of course, were this prospect but remote there would be no sane reason, really, to raise its possibility. Yet with the euro-zone's fate appearing anything but secure comes rational cause to fear the worst. Further support of credit market mechanisms feeding irrational exuberance across the spectrum might just be impossible to come by.


Fast Money
* * * * *

© The Risk Averse Alert — Advocating a patient, disciplined approach to stock market investing. Overriding objective is limiting financial risk. Minimizing investment capital loss is a priority.

Analysis centers on the stock market's path of least resistance. Long-term, this drives a simple strategy for safely investing a 401(k) for maximum profit. Intermediate-term, investing with stock index tracking-ETFs (both their long and short varieties) is advanced. Short-term, stock index options occasionally offer extraordinary profit opportunities when the stock market is moving along its projected path.

Nothing is set in stone. Nor is the stock market's path of least resistance always known. More often than not, there are no stock index option positions recommended.


There's an easy way to boost your investment discipline...

Get Real-Time Trade Notification!

Friday, April 20, 2012

Collapse Imminent


Following is more evidence suggesting the market is vulnerable to a hard turn south and stat. Behold a technical configuration like that preceding April 2010 peak wherein deteriorating momentum is seen prospectively setting up the market's collapse.


Displayed above the weekly chart of the S&P 500 is the Percentage Price Oscillator (PPO) momentum oscillator. Below the weekly chart is PPO's cousin, MACD. Both measures are detailed at StockCharts.

Our starting point is the four vertical red lines drawn. These mark a peak from which PPO subsequently fell below its "signal line" for an extended period. Certain similarities in coincident momentum behavior (as measured by both PPO and MACD) subsequent to these so-called "crossovers" lead to a view supposing the market presently is in a position much like April 2010.

Via PPO, notice how the higher S&P 500 low of early-February 2010 (this versus late-June 2009) resulted in a lower PPO reading, which then was followed by a PPO and MACD divergence at the S&P 500's April 2010 peak. This is marked with red dots. Now carry your view forward and check out the green dots. The same background conditions are presented by the S&P 500's performance (higher lows and higher highs) while momentum likewise deteriorated and diverged (divergence at April 1st, 2012 peak is most evident via MACD, yet still occurs ever so slightly, too, via PPO).

In addition to these noteworthy momentum divergences is a "like from like" view suggesting the S&P 500 is well positioned to collapse in a sell-off dwarfing last August's, as well as May 2010 before that. This is presented by the same colored lines (gray and black) I have drawn below MACD. So, now that PPO has crossed over its signal line just as in April 2010, a moment of truth appears at hand. Taking into account the great wealth of other technical measures starkly indicating the market's underlying weakness, one must conclude the market currently is at heightened risk of collapsing.

If you insist something must trigger such an event, then look no further than Argentina's nationalization this week of Spanish Repsol's YPF oil company. The last thing the hopelessly insolvent trans-Atlantic banking system needs is a sovereign kicking out its main prop. Higher energy prices, beyond being a scarcity-driven consequence resulting from hyperinflationary processes tied to ongoing, attempted bailout of a hopelessly insolvent banking system, represent a hidden tax whose proceeds create cash flows necessary to mask the banking system's insolvency. Energy production occurring outside the circle of Team Fraud assets (among which, of course, are oil companies) leaves less room for controlling circumstance allowing the banking system's insolvency to be further masked. So, with Argentina's move comes heightened risk that, energy, as well as other resource props, will be nationalized with increasing haste the world over. Indeed, such a move occurring at all vividly reveals that, only the hopelessly insolvent are deceiving themselves. What impact this realization might have on those whose eyes clearly are fixed on the exits (diminishing volume over the duration of the market's counter-trend rally off March '09 bottom confirms this element is ruling the day) is a mystery whose uncovering finds both fundamental and technical basis for supposing a "shoot first, ask questions later" spirit might imminently sweep over the market and the world, as Argentina's move likewise should raise the pitch in the drive for war.


Fast Money
* * * * *

© The Risk Averse Alert — Advocating a patient, disciplined approach to stock market investing. Overriding objective is limiting financial risk. Minimizing investment capital loss is a priority.

Analysis centers on the stock market's path of least resistance. Long-term, this drives a simple strategy for safely investing a 401(k) for maximum profit. Intermediate-term, investing with stock index tracking-ETFs (both their long and short varieties) is advanced. Short-term, stock index options occasionally offer extraordinary profit opportunities when the stock market is moving along its projected path.

Nothing is set in stone. Nor is the stock market's path of least resistance always known. More often than not, there are no stock index option positions recommended.


There's an easy way to boost your investment discipline...

Get Real-Time Trade Notification!

Thursday, April 19, 2012

The Case for a Hard Turn South


Despite having been bitten more than once supposing the market's counter-trend rally off March '09 bottom might be on the verge of reversing lower with a vengeance, underlying weakness presently revealing the market is on precarious footing overwhelms any impulse to be shy. Truth is the market's current technical state once again exposes a risk whose recently developed outcome would prove more devastating than anything previously thought possible over the immediate period ahead. As indicated yesterday, the market's long-anticipated sinking already could be underway.


$NYA

Combining the compromised technical condition of major indexes (whose relative strength and momentum have turned negative) with fading participation sustaining the market's levitation, it is quite reasonable to fear the worst and stat, as the following measures likewise suggest...


$NYHL

Call this one "the stink of garbage hard to ignore."


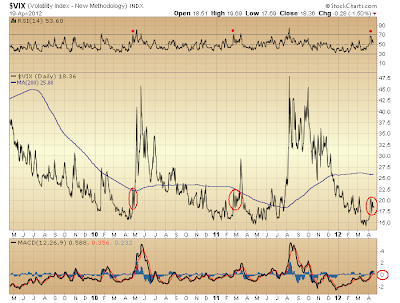
$VIX

And call this one " hey, we know it's garbage, but why not insure it while the cost still is relatively cheap?"

All told, the risk of a hard turn lower challenging last October's bottom is not out of the question.


Fast Money
* * * * *

© The Risk Averse Alert — Advocating a patient, disciplined approach to stock market investing. Overriding objective is limiting financial risk. Minimizing investment capital loss is a priority.

Analysis centers on the stock market's path of least resistance. Long-term, this drives a simple strategy for safely investing a 401(k) for maximum profit. Intermediate-term, investing with stock index tracking-ETFs (both their long and short varieties) is advanced. Short-term, stock index options occasionally offer extraordinary profit opportunities when the stock market is moving along its projected path.

Nothing is set in stone. Nor is the stock market's path of least resistance always known. More often than not, there are no stock index option positions recommended.


There's an easy way to boost your investment discipline...

Get Real-Time Trade Notification!

Wednesday, April 18, 2012

Make Way Titanic


Not a bad day of trading, really, considering that on both the NYSE and NASDAQ more than two issues declined for every one that advanced. Still, the air pocket the market hit at the open today gave testament to eyes fixed on the exits, this particularly following yesterday's strong lift. In fact, how about we consider the possibility the market already has topped and from now until the suicide rate in New York City matches that in Athens, Greece, it is straight down for stocks (except maybe AAPL, which could see $700s before all is said and done, but not likely $1000).


$SPX

Definitely not an outside possibility. With so many technical measures starkly challenging any thought of the market's continued levitation, a timely centennial commemoration of Titanic's sinking rather reasonably might be the market's more likely fate.

One thing to keep an eye on over the final eight trading days of April is the possibility of a so-called "outside month" developing. This would be a fitting price-negative to go along with the many technical negatives making for present possibility that, James Cameron's wealth soon might meet its benefactor at the bottom of the Atlantic.


Fast Money
* * * * *

© The Risk Averse Alert — Advocating a patient, disciplined approach to stock market investing. Overriding objective is limiting financial risk. Minimizing investment capital loss is a priority.

Analysis centers on the stock market's path of least resistance. Long-term, this drives a simple strategy for safely investing a 401(k) for maximum profit. Intermediate-term, investing with stock index tracking-ETFs (both their long and short varieties) is advanced. Short-term, stock index options occasionally offer extraordinary profit opportunities when the stock market is moving along its projected path.

Nothing is set in stone. Nor is the stock market's path of least resistance always known. More often than not, there are no stock index option positions recommended.


There's an easy way to boost your investment discipline...

Get Real-Time Trade Notification!

Tuesday, April 17, 2012

Late-May 2011 And Now


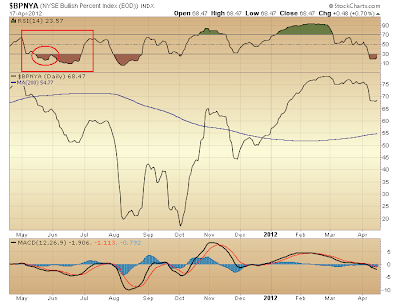
One technical measure presently indicating the market is vulnerable finds similarity to its same condition a year ago when the market was topping. As such, this measure's current state supports an outlook projecting the market's continued levitation over the next several weeks, bringing to completion an Elliott 5-wave advance developing since late-November 2011.


$BPNYA

As I have detailed here before, since March '09 bottom whenever the NYSE Bullish Percent Index's relative strength (top panel) has dropped below 30 the market has come under pressure. Interestingly enough, this same condition had come to be in the latter half of May 2011 to usher in a corrective wave fitting the moment, a decline which bottomed mid-June.


$SPX

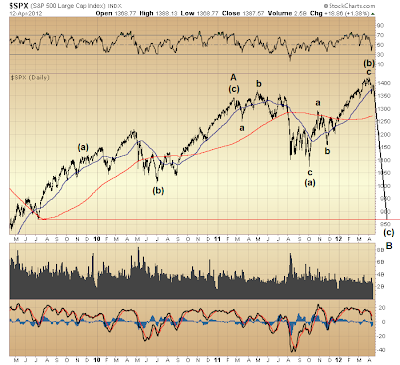
With the S&P 500's momentum (bottom panel) crossing below its 0-line another parallel to late-May 2011 becomes apparent. Today's similar condition, then, both momentum-wise and per the NYSE Bullish Percent Index could put the S&P 500 near mid-stream in forming a 4th wave correction of its preceding 3rd wave advance. Thus the S&P 500's projected wave 4 progression over the next couple weeks, as indicated above.

Given technical weakness building over the entire course of 2012's advance — per the S&P 500, its momentum divergence relative to that registered during October's surge is significant — it is possible wave 4's completion could extend in time across a broadening range, this while the S&P 500's momentum fade deepens rather considerably. In fact contrasted to early-July 2011 momentum during wave 5's upcoming formation could prove more challenged to advance to the positive side of its range. Thus raised would be prospect of the market's subsequent collapse once wave 5 completes, given what followed early-July 2011 peak under conditions that were not quite as weak as today.


Fast Money
* * * * *

© The Risk Averse Alert — Advocating a patient, disciplined approach to stock market investing. Overriding objective is limiting financial risk. Minimizing investment capital loss is a priority.

Analysis centers on the stock market's path of least resistance. Long-term, this drives a simple strategy for safely investing a 401(k) for maximum profit. Intermediate-term, investing with stock index tracking-ETFs (both their long and short varieties) is advanced. Short-term, stock index options occasionally offer extraordinary profit opportunities when the stock market is moving along its projected path.

Nothing is set in stone. Nor is the stock market's path of least resistance always known. More often than not, there are no stock index option positions recommended.


There's an easy way to boost your investment discipline...

Get Real-Time Trade Notification!

Monday, April 16, 2012

Alternate View, Take II


Here's how quickly an alternate view moved to the front burner might be pushed off the stove...


Should $XLF push above its February 2011 peak of 16.86 over weeks ahead, then alive is possibility an a-b-c corrective wave up from March '09 bottom is completing. This would open the door to a devastating crash subsequently. Full punishment due an obscenely leveraged banking system might then ensue. Indeed, the way forward could be far worse than anything ever put forward here...


$SPX monthly

Same chart, much deeper drop and stat. Ultimate objective is "the fourth wave of one lesser degree" (this according to the Elliott Wave Principle). The fourth wave of wave (III) unfolded from 1966-1974. Thus, the S&P 500 could be heading for 60. That's right: 6-0.

If the EMU blows, I will be the last person on earth to think lenders of last resort have hope of containing the fallout. Been there, done that. It was September 15, 2008 and the days following Lehman Brothers' collapse. So, as the euro-zone is flaring up again a dire light might be better thought rising above the horizon. It's the Spanish banking system, it's French elections, it's Glass-Steagall in Italy, it's German constitutional court challenges — not even the victims of Capone's Valentine's Day massacre were so bullet ridden! What's more, opportunities to tighten the bandages are not what they used to be. Much already has been bled dry, as worsening social conditions spreading throughout the euro-zone's periphery testify. The EMU's funeral could be here in the blink of an eye, and in all probability the event will not be pretty.

Going into this summer, then, cyclical guideposts mentioned Saturday could find wave 3 of C of (IV) unfolding, rather than the far less severe drop I detailed. Thus, waves 4 and 5 could coincide rather harmoniously with the cyclical outlook reaching out to 2021, this along lines I likewise mentioned.

Everything technical still is a mess. All presents weakness, yet still the market maintains its levitated state. Plainly, every minute still counts. So, the countdown to whether there are enough minutes remaining for Facebook to go public is officially on. It just might be the trans-Atlantic banking system needs the capital more urgently.


Fast Money
* * * * *

© The Risk Averse Alert — Advocating a patient, disciplined approach to stock market investing. Overriding objective is limiting financial risk. Minimizing investment capital loss is a priority.

Analysis centers on the stock market's path of least resistance. Long-term, this drives a simple strategy for safely investing a 401(k) for maximum profit. Intermediate-term, investing with stock index tracking-ETFs (both their long and short varieties) is advanced. Short-term, stock index options occasionally offer extraordinary profit opportunities when the stock market is moving along its projected path.

Nothing is set in stone. Nor is the stock market's path of least resistance always known. More often than not, there are no stock index option positions recommended.


There's an easy way to boost your investment discipline...

Get Real-Time Trade Notification!

Saturday, April 14, 2012

Substantiating a Revised Outlook


Brought to light here on Thursday was a view forward suggesting the market's counter-trend rally off March '09 bottom still could have legs. Now, this is not the first time such a prospect has been raised. However, being more inclined of late to regard underlying technical weakness as prospectively presaging an imminent collapse sinking major indexes to levels last seen in the 1987-1994 period, the one specific, previously discussed alternate possibility (raised once again on Thursday) was relegated to the back burner. There now is good reason to move it to the front.

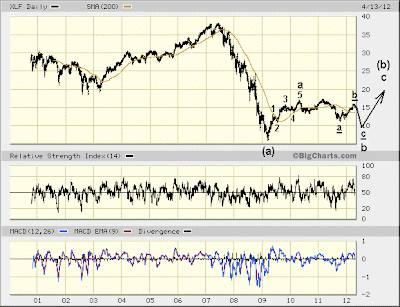
As I said on Thursday, banks and financials are pointing toward this prospective view keeping alive the market's counter-trend rally since March '09. Again, my suspicion on this account is raised strictly from a technical perspective grounded in the Elliott Wave Principle. From this perspective we might assume the means to "extend and pretend" the worth of "assets" on bank books probably is available (meaning there might be something to David Goldman's "negotiation"). Captive lenders of last resort might be better assumed to have not yet emptied their collective bag of tricks. Not that any of it will bring anything that is, even now, already long passed its "best if used by" date. There isn't a trick remaining that can abate hyperinflationary breakdown of the physical economy. Yet controlling this effect some time longer seems a reasonable enough possibility. Supporting this likelihood is the following, prospective Elliott wave view applied to financials...

$XLF

The simple matter of a prospective five waves up from March '09 through April 2010 beckons consideration of a view supposing formation of but wave a of an a-b-c counter-trend rally following $XLF's 2007-2008 bloodletting. Wave b forming since is developing similarly to other major indexes (yet in $XLF this middle corrective wave began in April 2010, as opposed to February 2011 in $SPX).

Projected upcoming weakness — this slated to complete $XLF wave b — is a risk founded on technical evidence accruing over the past six months, the likes of which has been detailed here to no end, while nothing subsequently developing over the interim negated the essence of those several foreboding conclusions arrived at along the way.

Anticipated, upcoming weakness notwithstanding, though, March '09 $XLF bottom must hold, otherwise the Elliott wave count indicated above will be invalid.

So, $XLF's five wave lift off March '09 bottom opens the way for assuming still further development of a counter-trend rally whose unfolding in fact but began with those five waves up. Longstanding technical weakness now gives objective form to the prospective dimension of upcoming selling simply as a consequence of the necessity that, March '09 $XLF bottom must not be violated for there to be any hope that, the stock market might maintain its levitated state for some months and, indeed, years yet to come. With basis $XLF provides for assuming this possibility, then, let's turn to this same prospect applied to the S&P 500...


$SPX

The Elliott wave count applied to $SPX above assigns its labels a bit differently than has been done here previously. The context of this proposed, alternative wave count will be clear in the following monthly chart of the S&P 500 dating back to 1970. Although the above wave count differs from views presented in the past, the essence of the S&P 500's rally off March '09 bottom remains unchanged: it is counter-trend; a corrective wave within a larger decline.

As an aside, the $XLF:$SPX relative performance contrast since Y2k appears a restatement of an ages old lesson regarding the use of leverage: joy is greater when leverage can be furthered, but when it can't, the awful consequences are all the more magnified to the depths of its user's dread.

Might this relative contrast, too, though, particularly since March '09 bottom, offer prospective insight into considerable weakness still likely to develop going into this summer? $XLF already has tested its early-July 2009 interim low (which low ended wave 2 of a). This same level could be the upcoming objective $SPX likewise soon retests (as indicated on Thursday, and further substantiated below). Could $XLF be at considerable risk, then, of imminently challenging its March '09 low were $SPX to slide upward of 40% going into this summer? Possibly. Yet then again, maybe time has come for a notable divergence to presage subsequent continuation of the market's counter-trend rally off March '09 bottom. Maybe the "Recipe for Fraud" that has been called the recently passed "JOBS Act" is precisely what financials need to get back on track, at least for a few years more, anyway.

Further perspective on the above Elliott wave count applied to the S&P 500 is provided below on the index's monthly chart...


$SPX monthly

This chart of the S&P 500 was presented here in late-2009 (sans the Elliott wave count). What's "new" is my "certainty" that, five waves up from 1974 - 2000 form in the S&P 500 the fifth wave of five waves up from 1932, while five waves up from 1932 form but the third wave of a larger, five wave advance whose beginning is thought to date back at least to the Civil War (1861-1865) or quite possibly earlier. The green lines drawn approximate the price channel in which wave V of (III) traversed during its more than twenty-five years of development.

The red line drawn is an interesting curiosity revealing a dynamic line of support-resistance existing over the entire duration of the S&P 500's gyrations charted above. Although I will forego qualifying this line's relevance in the context of the S&P 500's Elliott wave count since 1970, suffice it that from here forward, until the market's eventual collapse, this line likely will cap the S&P 500's advance, both over the next month, as well as over coming years, during which interval wave B of (IV) is slated to complete. Much as we are seeing an abundance of long-developing, underlying technical weakness coinciding with the S&P 500's present test of this dynamic line of resistance (an approximation of this line was drawn on $SPX's daily chart above), we probably can expect the same, widespread demonstration of underlying technical weakness again — indeed, all future indications might be worse than those today — when wave (c) of B nears its end, an event likely to occur in the latter half of the decade. Indeed, I am rather confident this line of resistance will remain intact given today's macro state of affairs wherein leverage once good for the market clearly has turned into a terribly vexing negative.

As for the upcoming completion of wave (b) of B — this projected to culminate in a steep sell-off sinking the S&P 500 to the vicinity of 875 going into this summer — another curiosity appears on the above chart. The gray line I have drawn approximates the S&P 500's steepest trend line since 1974 bottom. Coincidentally enough, a drop to this trend line would sink the S&P 500 to the vicinity of 875. Given deteriorating conditions among the larger countries in the euro-zone periphery there is fundamental reason to suspect this [rising] trend line might soon be tested, not to mention an abundance of well-established technical evidence likewise warning the same.

The question I have right now pertains to the character of wave (c) of B [higher] whose unfolding subsequent to the market's upcoming gassing might extend over several years. We might find its early development a fairly choppy affair, much like that from 2004 to mid-2006.

Not yet mentioned are cyclical factors likewise supporting both the near-term and longer outlook developed here. Although cyclical considerations more so serve as guideposts in my analysis than strict determinants of projected price action, the several cyclical measures I have long kept an eye on all substantiate the prospective path forward laid out here. Thus, too, the market collapse I have been anticipating over the past couple years likewise finds cyclical basis for suspecting such an event might be delayed until the 2018-2021 period.

* * * * *

© The Risk Averse Alert — Advocating a patient, disciplined approach to stock market investing. Overriding objective is limiting financial risk. Minimizing investment capital loss is a priority.

Analysis centers on the stock market's path of least resistance. Long-term, this drives a simple strategy for safely investing a 401(k) for maximum profit. Intermediate-term, investing with stock index tracking-ETFs (both their long and short varieties) is advanced. Short-term, stock index options occasionally offer extraordinary profit opportunities when the stock market is moving along its projected path.

Nothing is set in stone. Nor is the stock market's path of least resistance always known. More often than not, there are no stock index option positions recommended.


There's an easy way to boost your investment discipline...

Get Real-Time Trade Notification!
Friday, April 13, 2012

Held Up By Facebook


Diverging slightly from the view presented here yesterday, there's a couple reasons to think the market's projected sinking might be delayed about a month. First is Facebook's mid-May IPO. Second is a bullish consensus of only 28.1% among individual investors polled this week by the American Association of Individual Investors (while 41.6% of those polled are bearish).

Assuming yesterday's broad outlook proves the way forward, externalities potentially threatening Facebook's IPO seem more likely to be kept in check. In other words, with the market's counter-trend rally off March '09 bottom appearing far from over (notwithstanding significant weakness still in store) tangential confirmation of this outlook will have the Facebook IPO succeeding. Once this long-anticipated event is out of the way, market weakness founded on decidedly suspect technical underpinnings (born of hyperinflationary breakdown) then could develop and send major indexes into a tailspin.


$SPX

So, given this slight tweak, the next few weeks could prove fairly range bound, during which time wave 4 of c of (b) of B should complete its formation, then be followed by wave 5 leading into Facebook's IPO. All manner of technical weakness presently suggesting wave c of (b) of B might have completed on April 1st could yet again prove but a foretaste of further technical weakness still to come as the market's levitation continues over the next month or so.

Confirmation that wave c of (b) of B is some weeks from completing should come next week with the market regaining its legs in a bid eventually to challenge its April 1st peak.

It is worth stressing that, the market's underlying technical weakness in all probability will not be forever defied. Yet, still, although weakness has been building for a long time, the market has remained buoyant. Given this dual reality, then, the view put forward yesterday is further substantiated. In other words, in spite of a severe bout of selling appearing in store and likely producing technical damage only the more revealing increasing underlying weakness, the market still might be able to recover once more.

Look for further development of this new view tomorrow (Saturday, April 14, 2012). Obviously, its possibility represents a significant turn from what to now has been supposed imminent prospect of a setback sinking major indexes to levels last seen in the 1987-1994 period. The case for this alternate view forward, indeed, is rather compelling. Notwithstanding its suggesting that, March '09 lows will hold up some years longer, though, basis for supposing a significant setback, first, near-term (culminating early summer 2012), then some years from now returning major indexes to levels last seen in the 1987-1994 period (minimally) remains entirely intact.


Fast Money
* * * * *

© The Risk Averse Alert — Advocating a patient, disciplined approach to stock market investing. Overriding objective is limiting financial risk. Minimizing investment capital loss is a priority.

Analysis centers on the stock market's path of least resistance. Long-term, this drives a simple strategy for safely investing a 401(k) for maximum profit. Intermediate-term, investing with stock index tracking-ETFs (both their long and short varieties) is advanced. Short-term, stock index options occasionally offer extraordinary profit opportunities when the stock market is moving along its projected path.

Nothing is set in stone. Nor is the stock market's path of least resistance always known. More often than not, there are no stock index option positions recommended.


There's an easy way to boost your investment discipline...

Get Real-Time Trade Notification!

Thursday, April 12, 2012

Diving for Hyperinflationary Overdrive


Every bit of technical evidence still is aligned with a dire, near-term outlook, and relegates the market's bounce, yesterday and today, likewise fitting this same view forward. Apparent both on the surface and under the covers, complacency's last stand aptly describes the moment.

Today's bigger lift with much less help than was delivered yesterday from Chicago also saw volume retreat to its evermore diminishing ways. I'm not convinced technical means available to coax a bid can forever carry on in the face of diminishing turnover. There comes a day when turmoil — upset — can be overcome only with such increasing interest as assures a positive turn of affairs is well-established and more likely to persist indefinitely. Quite unlike today's circumstance, three years into a market levitation defying a persistently fading interest.


$SPX

A 38.2% pullback from its April 1st peak would sink the S&P 500 to around 875. We could be there by the end of June.

The Elliott wave count above leaves open the prospect of a wave C higher still to come, this completing an a-b-c corrective wave up from March '09 bottom. Believe it or not, banks and financials are leading my thinking toward this possibility. Not on any known fundamental basis, of course. Rather, strictly from an Elliott wave perspective does this prospect appear both reasonable and likely.

Coinciding with this outlook yet again finds the EMU weak link of the trans-Atlantic banking system threatening to slip deeper into its solvency crisis, which of course all too likely will be followed by a hyperinflationary deluge that, quite possibly dwarfs the liquidity flood of the past three years. Physical breakdown only more likely to accelerate in the aftermath, the shortage of financial assets to mask collapsing wealth will become only more acute. Nothing will make up for galloping costs, while additional resources to deal with increasing deprivation will fail leaking from the tsunami of liquidity propping up the banking system. At some point, of course, hyperinflation must cease. Then the stock market will collapse.

For the moment the euro-zone has a date with turmoil more threatening than anything yet. Upcoming French elections could prove a big upset — the kind of thing requiring a swindle to mend fracturing unity. The intended outcome no different: unabated hyperinflation, physical consequences be damned. If this proves the general way of it, then the prospect depicted above could be the way forward. Just how high wave C might rise in this eventuality will depend on how breakdown of the physical economy is managed. We'll cross that bridge once the upcoming throttling has run its course.


Fast Money
* * * * *

© The Risk Averse Alert — Advocating a patient, disciplined approach to stock market investing. Overriding objective is limiting financial risk. Minimizing investment capital loss is a priority.

Analysis centers on the stock market's path of least resistance. Long-term, this drives a simple strategy for safely investing a 401(k) for maximum profit. Intermediate-term, investing with stock index tracking-ETFs (both their long and short varieties) is advanced. Short-term, stock index options occasionally offer extraordinary profit opportunities when the stock market is moving along its projected path.

Nothing is set in stone. Nor is the stock market's path of least resistance always known. More often than not, there are no stock index option positions recommended.


There's an easy way to boost your investment discipline...

Get Real-Time Trade Notification!

Wednesday, April 11, 2012

Rumblings of a Train Wreck


With the market's momentum diving following a multi-month rocket ride on the thinnest upside volume yet since March '09 bottom (see $SPX) — this as underlying participation increasingly narrowed as the market's lift persisted throughout this year's first quarter (indeed, shockingly so, as evidence by the 10-day moving average of the NYSE advance-decline differential) — and with the NYSE Bullish Percent Index now ominously poised, a picture of complacency's last stand might be presented via the NYSE's 52-week high-low differential...


$NYHL

Over the course of euro-zone's slow-motion train wreck whenever this measure has fallen below its 200-day moving average pressure in the trans-Atlantic banking system was building. Spring 2010, summer 2011, and so it is once again...


So, per any imminent rush for the exits, index 200-day moving averages could be taken out rather more decidedly than most imagine. Contrarily, one last push higher is by no means out of the question. Yet accumulating, negative technical evidence rather appears lessening this possibility. A rush for the exits even more dizzying than last August's could be in store over days ahead.


Fast Money
* * * * *

© The Risk Averse Alert — Advocating a patient, disciplined approach to stock market investing. Overriding objective is limiting financial risk. Minimizing investment capital loss is a priority.

Analysis centers on the stock market's path of least resistance. Long-term, this drives a simple strategy for safely investing a 401(k) for maximum profit. Intermediate-term, investing with stock index tracking-ETFs (both their long and short varieties) is advanced. Short-term, stock index options occasionally offer extraordinary profit opportunities when the stock market is moving along its projected path.

Nothing is set in stone. Nor is the stock market's path of least resistance always known. More often than not, there are no stock index option positions recommended.


There's an easy way to boost your investment discipline...

Get Real-Time Trade Notification!