Friday, May 28, 2010

Dollar Shortages, Real and Imagined


Fantasy:
"Interbank borrowing costs — a much-watched gauge of the trust banks have in each other — rose to a 10-month high this week, unsettling investors, but many blame the problem mainly on a shortage of dollars in the system rather than outright fear of a bank counterparty failing."
—"Markets Fret, but Chance of Big Bank Crash Slim" (Reuters, 5/28/2010)

Reality:
"I believe finance has tightened and this ... will not prove fleeting.

"...The waves of liquidity unleashed through speculator leveraging and the flight out of safehaven assets has run its course. As we’ve seen over the past few weeks, markets can go from seemingly over-liquefied to illiquid the moment speculators reverse course and head for the exits.

"...The markets have passed an important inflection point, and faltering markets are certainly not good for fragile confidence."
— "Unwitting Beneficiary?" (Credit Bubble Bulletin, 5/28/2010)

That "shortage of dollars" bit from Reuters is hysterical ... not as in funny, but as in panicked.

And that story's headline is not exactly a confidence booster. If recent history is any guide, such is the language used when risk of a big bank crash has become astronomical and, indeed, imminently threatening.

They say, "time will tell." The more I see, the more I agree with Richard Russell. By the end of the year we might not recognize the place.

Circle June 9th on your calendar. That's the day Congress begins deciding the fate of that mountain of casino chips otherwise called OTC derivatives. Being in the bailiwick of the British offshore banking system, how anything combining the words "British" and "offshore" might not quickly conjure images of disaster is a thought worth pondering as election day draws nearer.

Bear in mind, too, the hacks will be conferring immediately following their Memorial Day recess. Chances are the urge to strengthen a terribly weak "reform" bill might be overwhelming once the rage of constituents back home is felt, acting like a torpedo threatening to sink any hope for reelection. Thus, too, the risk of another market dislocation brought on by a threat whose codename is "Glass-Steagall" remains very real.

Probably the more likely scenario, though, is the hacks bleed financial industry lobbyists and fill up their campaign coffers, then put together a bill that is sure to be voted down.


$SPX

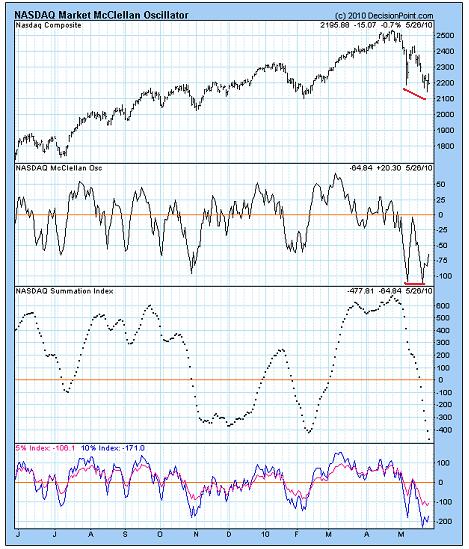
From top to bottom each panel reads: weak, weak, weak, and weak.

RSI, firmly on the sell-side ... the index being turned away from its 200-day moving average ... following a bounce on volume demonstrating a case of George Costanza shrinkage ... leaving momentum (MACD) still firmly in the negative.

All not good. Now, this is a problem we can blame mainly on a dollar shortage!


SPX 5-min

The coming holiday-shortened week might be punctuated by relatively dull trading. In fact, the post-May 6th bounce, as well as that beginning on Friday, May 21st, could offer a reasonable sense of what to expect. Following a sharp drop into a bottom and a strong subsequent recovery in both instances, a slow grind into a top set the stage for the next leg lower. So, presently, it appears a slow grind remains in store as wave iv of 1 [down from late-April top] moves toward its completion.

Not sure what to make of gaps highlighted by the line drawn above. In the slow grind higher over coming days this could be an area where support develops.

(Looking forward, this line might prove upside resistance in the formation of wave 2. At the moment it appears something of a line in the sand is being drawn here. Yet once this line is taken out over the next couple weeks, today's [meager] support might prove tomorrow's [defeated] resistance.)

Possibly toward the end of the coming, holiday-shortened week, the market's anticipated final leg lower — slated to end but the first wave down from late-April top — will begin commencing. This pending decline could sink the S&P 500 to the 950-1000 area. Furthermore, much like occurred this past Tuesday (May 25th), and then on May 6th before that, bottom could be reached intra-day, and be followed by a screaming recovery.

This is how bottoms have developed thus far anyway — in the process demonstrating a "Save Our Ship" mentality one might reasonably expect at this early moment in a massive decline yet to come. "Like from like" behavior has a way of subtly presenting itself during related moves, as I recently mentioned.

Judging by improvements in the condition of various "oversold" technical measures presented here this week (and the fact these measures continue confirming the market's weak state), one can conclude there exists reasonable basis for anticipating a final leg lower in the formation of wave 1 down from late-April top. During this pending decline likely developing will be such technical divergences as pave the way for formation of wave 2.

(p.s. I added some remarks to yesterday's post in response to Doug Kass' observations on fear, because the technical case against his calling March '09 lows a "generational bottom" trumps his expressed sense about what makes for a rational buyer of stocks here.)

(p.p.s. Returning to "fantasy" and "reality" quoted at the start... Is not a "shortage of dollars in the system" in fact a reflection of collapsing confidence in said system's integrity?)


Fast Money
* * * * *

© The Risk Averse Alert — Advocating a patient, disciplined approach to stock market investing. Overriding objective is limiting financial risk. Minimizing investment capital loss is a priority.

Analysis centers on the stock market's path of least resistance. Long-term, this drives a simple strategy for safely investing a 401(k) for maximum profit. Intermediate-term, investing with stock index tracking-ETFs (both their long and short varieties) is advanced. Short-term, stock index options occasionally offer extraordinary profit opportunities when the stock market is moving along its projected path.

Nothing is set in stone. Nor is the stock market's path of least resistance always known. More often than not, there are no stock index option positions recommended.


There's an easy way to boost your investment discipline...

Get Real-Time Trade Notification!

Thursday, May 27, 2010

Suckers in Droves: May 10th and Today


There is no reason to consider any change to yesterday's outlook. If anything, a day like today might seem to increase odds a [third wave] collapse is imminent.

However, there remains solid technical basis for sticking with the view that, a first wave down from late-April top has been forming its fifth and final sub-wave (i.e. wave v) since May 13th...


SPX 5-min

(Anticipated price action drawn above obviously is just a rough guess of what lies ahead.)

At last, coincident relative strength registered thus far during formation of wave v of 1 is lending technical substantiation for the Elliott wave count you see above. This took a while.

The worst RSI reading thus far registered during formation of wave v coincided with formation of wave 3 of v. Since Elliott third waves typically are the most dynamic, it stands to reason that, wave 3 [down] would produce the worst RSI reading.

Next we see relative strength improving during formation of wave 4 of v — besting its strongest reading registered during formation of wave 2 of v. Again, this is typical. As five waves down near their end, the fourth wave should reveal improving technical conditions. This we saw with yesterday's pop at the open.


$NYAD

Just as an elevated number of advancing, NYSE-listed issues registered during formation of wave iv of 1 (specifically, on Monday, May 10th) ... a similarly elevated number of advancing issues has registered during formation of wave 4 of v of 1 (specifically, today).

(The Elliott Wave Principle is all about "like from like." That is why price action over 75 years can be analyzed in precisely the same fashion as price action over 75 minutes. Very useful stuff, indeed. This "like from like" principle similarly can be applied to analysis of underlying technical conditions, much as here via the NYSE Advance-Decline differential.)

One final remark in support of the view that a first wave down from late-April top is in the process of forming...

Were collapse imminent (as in mere hours or days) it hardly seems likely that, such upside extremes in the NYSE Advance-Decline differential as we have seen this month would be registering. Instead, just prior to collapse we might better expect relatively more subdued advancing issue participation on such big up days as today (and Monday, May 10th). I know for a fact this was the case just prior to the crash of October 1987.

Look at it this way, too. There is something of a double-edge sword to ponder here...

Given buying interest revealed today (and, again, on May 10th), who among strong hands distributing shares for months on end would not desire to do the same while there still remains time and, most critically, interest? That's one edge of the sword ... and it further supports the probability a first wave down from late-April top is forming ... with a second wave [up] on the way.

The sword's opposite edge is seen, again, by the very same wide buying interest as was demonstrated today (and, again, on May 10th). Coming so near a moment when the risk of collapse is becoming elevated, should we expect anything less? Said another way ... do not the masses typically charge in with abandon near tops? Such is how suckers are made! And their number is being measured by an exceptionally elevated NYSE Advance-Decline differential, such as was evidenced today and, again, on May 10th.


According to Doug Kass, "The high frequency trading community has so screwed up the market that, you can throw out all technicals." This is like saying, "Wall Street so thoroughly owns members of Congress that, elections do not matter." It just is not so. The building Mass Strike movement likely will prove this in spades over the next couple years.

But let's not quibble over the impact of the high frequency trading community when neither he nor I can prove our position. Kass believes the increase in high frequency trading activity over the past month from 60% to 80% changes everything. I, on the other hand, do not believe any real change in the market's underlying condition is affected by high frequency trading, no matter the extent of its impact on a day-to-day basis.

Indeed, my own technically substantiated, extraordinarily bearish position is bolstered when one considers the lesson delivered by the stock market's dislocation on May 6, 2010. If increased high frequency trading is becoming a principle source of liquidity in the market, then when some matter striking fear precipitates increased selling, the consequence of liquidity's evaporation (such as occurred on May 6th) simply exemplifies the market's truly negative state — a reality overwhelmingly evidenced by a bevy of technical measures.

Kass says, "Fear is the friend of the rational buyer" and that, "fear is a necessary agent for building a base in the market." On these two points I completely agree.

Yet how does fear present itself as a necessary agent for building a base — how does it manifest as friend of the rational buyer — in the arena of the stock market? Is fear measured by people appearing on CNBC blubbering about this or that reason not to own stocks? Is it measured by bearish unanimity among hedge fund managers appearing at a conference in Las Vegas? How about among investment advisors who form an elevated bearish consensus?

The answer is no, No, and NO! Rather, fear is objectively evidenced by measures demonstrating the presence of a "wall of worry."

Long-time readers know what I am referring to here ... and likewise realize that, none of the wall of worry has been in evidence since March '09 bottom (Kass' so-called "generational low").

Summarizing... The wall of worry, such as demonstrates a bullish presence of fear, is reflected by an expanding balance among buyers and sellers. Its existence most emphatically is seen via the volume trend and relative strength performance over the duration of an advance.

Rather than again detailing these matters here, I would rather for the time being stress the criticality of an advancing price trend. It is upon this foundation one even begins assessing fear as the mortar holding together the wall of worry. In other words, fear as friend of the rational buyer requires a confluence of constructive price performance amidst a sound technical backdrop.

(Per fear being "a necessary agent for building a base in the market," one technical manifestation of this is seen via improving relative strength, first in RSI divergences registered as bottom is established, then in RSI remaining on the sell-side of its balance as the market's base develops.)

So, Kass' claim that, the market is trading on such fear as is the friend of the rational buyer simply finds no basis in cumulative technical evidence since March '09 bottom. In fact, as far as I am concerned, he kills his own argument admitting that, among "fundamental headwinds" is the role of de-leveraging in slowing economic growth. Were it not for the addition of profound leverage over recent decades the bull market of the '80s and '90s would not have been possible in an environment where real growth in the physical economy more or less was being inhibited with abandon. With that inhibition, though, de-leveraging became inevitable ... and its arrival is the kiss of death on risk assets of every sort. Indeed, to characterize de-leveraging as a "fundamental headwind" is a lot like calling the Gulf of Mexico oil spill "ugly." Truth is it is much worse than that...


Fast Money
* * * * *

© The Risk Averse Alert — Advocating a patient, disciplined approach to stock market investing. Overriding objective is limiting financial risk. Minimizing investment capital loss is a priority.

Analysis centers on the stock market's path of least resistance. Long-term, this drives a simple strategy for safely investing a 401(k) for maximum profit. Intermediate-term, investing with stock index tracking-ETFs (both their long and short varieties) is advanced. Short-term, stock index options occasionally offer extraordinary profit opportunities when the stock market is moving along its projected path.

Nothing is set in stone. Nor is the stock market's path of least resistance always known. More often than not, there are no stock index option positions recommended.


There's an easy way to boost your investment discipline...

Get Real-Time Trade Notification!

Wednesday, May 26, 2010

Larry Kudlow(!) Becomes a Cautious Bear


Even before Larry Kudlow tonight called himself a "cautious bear" my mind already was firmly made up ... convinced the market's worst for now probably is behind us.

But thanks for the heads up, Larry! Like Gregg Hymowitz in March 2000 singing the "new era" song for tech, I shall never forget Kudlow's bullish bent in 2008, clinging to that dogma of his like a child with a brand new pet.

(Don't get me wrong. On high-level matters such as enabling the entrepreneurial spirit I appreciate Kudlow's interjection encouraging thoughtful consideration. But to suggest gutting Medicare and Social Security is an act wherein government could fulfill its mandate to "promote the general Welfare" is a position I find particularly offensive. Even the mere suggestion is a stark reflection of the nation's sickly economic health ... which is where discussion should begin and end.)

Regarding the stock market's health I am back to thinking that, but the first wave down from late-April top presently is unfolding. Recently, the view has been that, the first and second waves down from top already have unfolded and the third wave down was but beginning to form (since Thursday, May 13th).

Granted, that possibility still remains wide open ... and could lead to a rapid collapse over days straight ahead. Yet I suspect a swoon back toward March '09 lows instead might be delayed. Indeed, the technical case characterizing many indicators as "oversold" begs serious consideration here.

So, following is a prospective view of the first wave down from late-April top...


$SPX

Relative strength's resiliency — presently diverging from its May 7th low, albeit ever so slightly — supports the Elliott wave count indicated above. Likewise does volume, which in formation of wave v of 1 is demonstrating selling exhaustion relative to wave iii of 1.

This frame of reference returns to a previously discussed view, and foremost was motivated once I took a gander at Bullish Percent readings on both the NYSE and NASDAQ...


$BPNYA
$BPCOMPQ

The present, "oversold" state of the relative strength (RSI) of both Bullish Percent indexes — at absolute levels from which has reliably followed a rising market — tonight brought a change of heart returning my Elliott wave view to that indicated above on the chart of the S&P 500.

In fact, were it not for technical confirmation of the market's decline to date presented via the NYSE and NASDAQ McClellan Oscillators, I might otherwise suspect wave v of 1 completed yesterday...


NYSE McClellan
NASDAQ McClellan

It appears these two measures (presently improving) are setting up for a divergence to register once the NYSE and NASDAQ Composite Indexes fall to new lows, post-April top, sometime over days ahead. Once this occurs — notwithstanding the fact establishing a "bottom" here could prove a prolonged affair — wave 1 down from late-April top probably will have completed.

Now, allow me to draw your attention to profound weakness, relatively speaking, presented by every McClellan measure applied to both the NYSE and NASDAQ. To my way of seeing things this validates an Elliott wave view supposing there is great risk of additional selling over months ahead.

This view likewise is bolstered by current readings of NASDAQ's Bullish Percent Index relative to the NYSE's. That, suddenly, a greater percentage of NASDAQ-listed issues have bullishly configured point-and-figure charts (when for many months NASDAQ's Bullish Percent Index was lagging the NYSE's) substantiates my view that, the consensus believes tech does not need a functioning banking system to thrive. I beg to differ. NASDAQ's "leadership" here is as ill-placed as it was in August 2008. Thus, we find further indication suggesting there is great risk of additional selling over months ahead.

An outlook supposing that, March '09 lows could be challenged sometime before year-end indeed possesses considerable technical substantiation...


Fast Money
* * * * *

© The Risk Averse Alert — Advocating a patient, disciplined approach to stock market investing. Overriding objective is limiting financial risk. Minimizing investment capital loss is a priority.

Analysis centers on the stock market's path of least resistance. Long-term, this drives a simple strategy for safely investing a 401(k) for maximum profit. Intermediate-term, investing with stock index tracking-ETFs (both their long and short varieties) is advanced. Short-term, stock index options occasionally offer extraordinary profit opportunities when the stock market is moving along its projected path.

Nothing is set in stone. Nor is the stock market's path of least resistance always known. More often than not, there are no stock index option positions recommended.


There's an easy way to boost your investment discipline...

Get Real-Time Trade Notification!

Tuesday, May 25, 2010

Delivering the Weinerschnitzel


PREDICTION: The minute Germany leaves the Euro, the global banking system will rapidly accelerate its spiral into the abyss, leading to a crush for capital so extreme as to make May 6th's flash crash appear to have been caused by disoriented carrier pigeons.

Now, per today's reversal and the claim made by Fast Money traders suggesting Goldman Sachs led the way higher...


company chart (GS)

If this is leadership, then there is just one thing left to do: look out below!

But seriously...


SPX 5-min

Today finally saw relative strength exceed to the downside its previous worst reading registered during the S&P 500's decline over the past eight days. The trouble is this did not add any clarity aiding discernment of the Elliott wave count over the interim. Despite this mystery, however, it is clear the market's decline since Thursday, May 13th remains incomplete. This morning's dive carrying relative strength to a new low says as much now as it did on Friday, May 14th.

So, maybe Goldman Sachs is telling us something. It could be that, wave 3 down (since May 13th) thus far consists of a series of first and second waves, with one big third wave due to unfold any moment now.

Likely to receive guidance from the British — the king of bankrupt nations — on how to accelerate current global financial chaos (a British offshore banking specialty) prior to meeting the Germans, Treasury Secretary Geithner, upon revealing proposals for "solving" the Euro crisis might be given a weinerschnitzel up the you know what in response, so let's keep an eye on young Timmy's gait when he arrives back home on Friday. This might be one of those occasions where, if he is smiling, it could be a very bad sign, indeed.


Fast Money
* * * * *

© The Risk Averse Alert — Advocating a patient, disciplined approach to stock market investing. Overriding objective is limiting financial risk. Minimizing investment capital loss is a priority.

Analysis centers on the stock market's path of least resistance. Long-term, this drives a simple strategy for safely investing a 401(k) for maximum profit. Intermediate-term, investing with stock index tracking-ETFs (both their long and short varieties) is advanced. Short-term, stock index options occasionally offer extraordinary profit opportunities when the stock market is moving along its projected path.

Nothing is set in stone. Nor is the stock market's path of least resistance always known. More often than not, there are no stock index option positions recommended.


There's an easy way to boost your investment discipline...

Get Real-Time Trade Notification!

Monday, May 24, 2010

Foreboding Differences


Let's take a closer look at May 6th's collapse and intra-day recovery, and similarities with the collapse and intra-day recovery of April 4, 2000. So far in May 6th's aftermath these similarities remain noteworthy. Yet, too, there are distinct differences, now versus then, whose significance is fitting the moment. These likely will result in the market turning decisively lower sooner than occurred back in 2000.

First, the S&P 500 during Y2k...


$SPX (2000)

And now, the S&P 500 over the past six months...


$SPX

Both collapses witnessed a notable spike in volume and both saw losses entirely recovered over successive days following. Likewise, during subsequent recoveries volume persistently contracted as the S&P 500 moved back up to its pre-collapse levels.

Following these recoveries the S&P 500 reversed course and took out intra-day lows set on the day of collapse. In both instances accompanying volume never exceeding volume registered on that day (thereby indicating a short-term bottom — i.e. selling exhaustion).

In both instances, too, a [rising] 50-day moving average was positioned above a [rising] 200-day moving average. Of course, this sort of configuration typically is associated with an upwardly trending market. Yet despite this, the collapse of April 4, 2000 eventually was to be seen part and parcel of an evolving trend reversal whose confirmation did not arrive for another 6-7 months.

Now, the collapse of May 6, 2010 likely will not require nearly as much time before 50-day and 200-day moving averages fall in line and confirm that day's ominous dislocation. That's because, presently, continuation of a [large] corrective wave that began in October 2007 is thought to have commenced in late-April 2010, whereas in 2000 a [smaller] corrective wave was just in its very beginning, and this following a five year advance unrivaled in market history.

Supporting this conclusion are differences the May 6, 2010 collapse reveals in contrast to that of April 4, 2000.

For example, on April 4, 2000 the S&P 500 found support at its 50-day moving average, whereas on May 6, 2010 the S&P 500 decisively fell below its 50-day moving average and did not find support until reaching its 200-day moving average.

Then, in 2000 the S&P 500's 200-day moving average was the area in which support developed once selling had become exhausted in late-April. Presently, however, the 200-day moving average — having been penetrated to the downside last week — is setting up to offer resistance. So, should similarity to 2000's post-dislocation performance persist, then following demonstration of selling exhaustion a correction of losses thus far suffered probably would put the S&P 500's 200-day moving average in the cross hairs.

Per the possibility selling presently is becoming exhausted (as recent days' volume relative to May 6th suggests) ... let's consider the prospect of an upcoming bounce in the context of the dire outlook discussed Friday ... wherein an imminent decline to the area of March '09 lows was thought in store — a prospect finding considerable technical substantiation with precedent seen in the weeks following the collapse of Lehman Brothers (September 15, 2008)...

Simply stated, a first and second wave (of five waves down from late-April top) are thought to have completed on May 13th. Since then, a third wave down appears to have begun unfolding. This third wave, itself, will subdivide into five waves. Of these, the first appears to be nearing completion. Formation of the second wave of wave 3 could bring the S&P 500 back up to its 200-day moving average, and might even see the index trading above it (if that's what it takes to draw in the last sucker). So, a seeming demonstration of selling exhaustion at present (evidenced via contracting volume relative to May 6th's) might only lead to a rather short-lived bounce. Subsequently, a rapid fall toward March '09 lows might then commence.

There's one glaring technical difference, now versus April 2000, setting up the possibility of but a brief recovery in the S&P 500 (in contrast to its more prolonged recovery in 2000) despite there now being evidence of selling exhaustion similar to that witnessed in April 2000.

Observe how May 6th's collapse weighed on both RSI and MACD to the effect of sinking both measures to the sell-side of their respective ranges. Contrast this to the April 4, 2000 collapse. At the end of the day both measures remained on the buy-side of their respective ranges. Indeed, not until the S&P 500 later took out its intra-day low of April 4, 2000 did both measures finally sink to the sell-side of their respective ranges. The difference these two measures present, now versus April 2000, reflects on the market's underlying condition whose relative weakness, currently, should have an impact on any near-term recovery, both its duration and its strength.


SPX 5-min

Among Fast Money traders there was unanimous consensus at the conclusion of today's trading believing this afternoon's weakness was foreboding, and could be signaling a good deal of selling ahead.

No doubt, there has not been much of any relative strength improvement over the past week when the S&P 500 briefly bounced, so the case calling for further weakness finds technical substantiation on this count, as it does by the fact that, each new low in the S&P 500 over the past week likewise has been confirmed by still weaker relative strength readings.

Yet over the past week, too, relative strength has not once exceeded its low set on Friday, May 14th, when the S&P 500's present move lower (following completion of wave 2 the day before) was just beginning. This is causing some confusion as to where in the formation of wave 3 down the S&P 500 presently stands.

Notwithstanding this, evidence of selling exhaustion (as mentioned above) and tonight's negative consensus among Fast Money traders leads me to believe a floor might be put under the market at levels not much lower than has been seen thus far. Still, that a third wave down presently is thought to be forming, further evidence of [momentary] selling exhaustion might yet be demonstrated while in the process [hopefully] bringing clarity as to where in the formation of wave 3 down the S&P 500 presently stands. A bounce leading RSI to exceed its best last Tuesday (at the open) would be a welcome development indicating the first wave of wave 3 down is nearing its end. As of now, though, there is no indication suggesting the decline of the past seven days is nearing completion.

So, although I expect further weakness before any prospective rally toward the S&P 500's 200-day moving average, just how this might develop is unclear.


Fast Money
* * * * *

© The Risk Averse Alert — Advocating a patient, disciplined approach to stock market investing. Overriding objective is limiting financial risk. Minimizing investment capital loss is a priority.

Analysis centers on the stock market's path of least resistance. Long-term, this drives a simple strategy for safely investing a 401(k) for maximum profit. Intermediate-term, investing with stock index tracking-ETFs (both their long and short varieties) is advanced. Short-term, stock index options occasionally offer extraordinary profit opportunities when the stock market is moving along its projected path.

Nothing is set in stone. Nor is the stock market's path of least resistance always known. More often than not, there are no stock index option positions recommended.


There's an easy way to boost your investment discipline...

Get Real-Time Trade Notification!

Friday, May 21, 2010

Stage Set for Chaos


First, on failure of the U.S. Senate to even so much as debate the Cantwell-McCain Glass-Steagall amendment to the Restoring American Financial Stability Act of 2010 passed yesterday...


Possessing all the teeth and sanity of Family Guy's "Herbert" the Senate bill, like its companion passed in the House, rather clearly announces: get ready for bank runs.

Building upon a foundation of what already appears regulatory complicity facilitating blatant financial fraud over recent years, so-called FinReg possesses all the confidence-building allure of a mushroom cloud. Nothing ultimately bolstering stability is secured. Rather, ingraining a well proven means for precipitating chaos is the route "reform" is taking.

And for what? Assets to be had on the cheap, Lehman style, gaming a vulnerable system bankrupted by the same instruments "reform" otherwise further legitimizes.

One great difficulty is imagining how anyone in the know believes radically game-changing, "unintended consequences" might somehow be avoided pretending what's being reformed is not already hopelessly insolvent.

Be that as it may, so long as such denial prevails, then bank runs are a cinch. Legislation failing to restore confidence is destined to have this effect.


$IRX

What's this? Is Uncle Benny's liquidity gusher running dry? Well, then, it's buhbye carry trade ... and hello bank runs. Given a glaring failure of the "flight to safety trade" to light up the safest of them all this week — and this in the midst of increasingly stressed credit markets — the crush for capital appears quite real.

Lender of last resort capacity to expand support (as it must) of a hopelessly insolvent arrangement evidently is bumping against physical reality. Further support needed to maintain the illusion of solvency of massively bloated liabilities simply escapes both the economy's ability to generate real wealth, as well as political feasibility to continue gutting the general welfare.

FinReg is a reflection of this reality. It is the free market preparing for rapid consolidation. Apparently, Congress doesn't "get it." However, Germans do.

Yet might even these be but playing their expected part in the presently unfolding, global drama? To wit, what is breakup of the Euro-zone when chaos facilitating asset grabs is the desired goal?


$SPX

There are interesting technical similarities presently with the September - October 2008 period seen via the measure of S&P 500 momentum (MACD in the bottom panel).

First, momentum's current rate of descent is rivaled only by this prior period. Likewise its present dive, just like then, is occurring following a declining momentum trend marking successive S&P 500 peaks.

(That in the present instance declining momentum peaks occurred as the S&P 500 was rising, as opposed to falling back in '08, is thought possibly a mitigating factor lessening the ultimate impact of the market's presently unfolding decline.)

Then, consider present comparisons to the September 15-30th, 2008 period in the immediate aftermath of the Lehman Brothers bankruptcy. From May 6th to present we see a remarkable likeness featuring volatile swings in the S&P 500 failing to reverse a strongly negative momentum trend. This prospectively projects a rather ominous decline in the S&P 500 over days straight ahead.

The question right now is whether relative strength (top panel) might first improve a bit (although likely remaining biased to the sell-side, below 50) before making a challenge of its worst levels registered in October 2008 ... (and in so doing confirming the likelihood of still further selling ahead targeting levels last seen in the 1980s).


SPX 5-min

So, for now let's suppose the market's post-May 6th bounce formed wave c of 2 of five waves down from April top, and wave 3 has begun to unfold. Not to be flip flopping on the wave count, but this point of view well fits a prospectively dire, near-term outlook projecting a challenge of March '09 lows sooner than most observers believe likely (or, indeed, even think possible).

Just where in the course of forming wave 3 down the S&P 500 presently stands is difficult to say. Relative strength improvement indicative of buying support such as has been lacking over the past couple days appears to have begun developing today, however modestly. It is unclear, though, how this week's relatively less extreme RSI lows should be construed following on last Friday's deeper RSI dive to the sell-side. Nevertheless, that each new low the S&P 500 set this week was matched by a new RSI low suggests still more selling following on this week's decline lies ahead.


Fast Money
* * * * *

© The Risk Averse Alert — Advocating a patient, disciplined approach to stock market investing. Overriding objective is limiting financial risk. Minimizing investment capital loss is a priority.

Analysis centers on the stock market's path of least resistance. Long-term, this drives a simple strategy for safely investing a 401(k) for maximum profit. Intermediate-term, investing with stock index tracking-ETFs (both their long and short varieties) is advanced. Short-term, stock index options occasionally offer extraordinary profit opportunities when the stock market is moving along its projected path.

Nothing is set in stone. Nor is the stock market's path of least resistance always known. More often than not, there are no stock index option positions recommended.


There's an easy way to boost your investment discipline...

Get Real-Time Trade Notification!

Thursday, May 20, 2010

No Bottom Yet in Sight


Well, let's see. After thirteen months spent spoon feeding shares to suckers with an affinity for helicopters hovering over a deep sea of bankruptcy ... the inevitable rogue wave crashes into lenders of last resort worldwide and faith evaporates faster than you can say "global recovery."

With the volume of shares recently shoveled onto the market rivaling the bad old days of '08 and then to boot, a wide swath of listed issues driven lower just like then, too ... there plainly appears something nasty afoot. Odds are the move down from April top is not merely a correction of gains made since March '09 bottom. Rather, resumption of a giant bear trend begun in October 2007 quite likely has commenced.


SPX 5-min

Yesterday's bounce was thought suspect because no discernible improvement in relative strength late-Tuesday, early-Wednesday preceded it.

See any improvement yet? Nope. There's risk of further selling, then.


And they say history never repeats! Mark Hulbert most definitely was singing the same tune back in early-'08.

Apparently, a hope-filled tendency built up over recent decades by a credit bubble involving the greatest Ponzi scheme the world has ever seen continues trumping a reality wherein otherwise plainly demonstrated is truth the globe's dying, fraud-rife financial system is hopelessly insolvent.


Investors Intelligence

Just look how bearish investment advisors were in 2008 (pay especially close attention to July '08). The lesson plainly is that, it is a mistake evaluating sentiment readings wearing a bull cap when the market is vulnerable to devastating runs.

Being the need to raise capital selling liquid risk assets presently is necessitated by a collapsing credit system leveraged to the teeth ... and being power to stop this is nowhere near capacities available to national treasuries and central banks ... the state of mind among investment advisors, even following the shock of May 6th, generally appears delusional to say the least.

Mark Hulbert taking stock in the rate at which sentiment has become less bullish merely adds icing to the crazy cake baked by a bunch of proven incompetents running roughshod over both the private and public sectors. Bon appetit.


Fast Money
* * * * *

© The Risk Averse Alert — Advocating a patient, disciplined approach to stock market investing. Overriding objective is limiting financial risk. Minimizing investment capital loss is a priority.

Analysis centers on the stock market's path of least resistance. Long-term, this drives a simple strategy for safely investing a 401(k) for maximum profit. Intermediate-term, investing with stock index tracking-ETFs (both their long and short varieties) is advanced. Short-term, stock index options occasionally offer extraordinary profit opportunities when the stock market is moving along its projected path.

Nothing is set in stone. Nor is the stock market's path of least resistance always known. More often than not, there are no stock index option positions recommended.


There's an easy way to boost your investment discipline...

Get Real-Time Trade Notification!

Wednesday, May 19, 2010

Fast and Furious Collapse Ahead: Richard Russell


I wonder what's eating Richard Russell of the Dow Theory Letters (Sell it All, Risk of 'Major Crash').

Of course, I agree with Russell's outlook. I'm curious, though, what makes him say, "by the end of this year [people] won’t recognize the country."


$NYAD

One technical development adding weight to Russell's view is evidenced via the NYSE Advance-Decline differential. Note how its wide swings — first, to the downside, coinciding with May 6th's flash crash, then, to the upside on May 10th, following Bernanke's helicopter run over the European continent — find precedent in October 2008.

Most fundamentally noteworthy is insight this reveales about the market's underlying psychological state. This plainly is different than what was in evidence from May - July 2008 when the market was tracing but its initial leg lower in a far larger decline.

Thus, a reasonable doubt might be cast upon yesterday's view suggesting the market could go lower, slower over the next 12 months. Richard Russell instead might prove correct. Lord knows, the long-term chart of the S&P 500 presented in OTC Derivatives-Driven De-leveraging was intended to visually support the possibility of a stunning collapse over the next 12-18 months.


$CPC

At last, some measure of long equity hedging typically preceding a period of sustained support (albeit likely only amounting to a counter-trend rally) entered into the picture today. Two things worth noting here, though...
  1. Being the intermediate-term risk at hand is a projected collapse in equity markets (this following on the initial downdraft from October 2007 - March 2009), the measure of buying support and commensurate put option hedging necessary to affect a counter-trend rally probably will be greater than anything seen since October 2007 top. In other words, the CBOE Put/Call Ratio might spike toward 2-1 before any sustainable bounce develops.

  2. One wonders whether much of today's put option buying was directed toward hedging new positions in financials established on the hope that, regulatory reform being debated in the U.S. Senate would move forward in its presently weak state with today's cloture vote. Minutes before today's close, however, we got word the Senate's cloture motion failed. The risk of momentous regulatory change (read: Glass-Steagall) remains on the table.


SPX 5-min

The case made by Fast Money trader Gary Kaminsky in raining on the parade of those who were impressed with today's close appears to have technical merit.

Note how during yesterday's late-day bounce (and then again at the start of trading today) there was no marked improvement in relative strength compared to mid-day yesterday. True, there were divergences this morning as the S&P 500 sank to its bottom ... however there was no indication previous to this suggesting buying strength was building over the course of yesterday's selling as it carried forward and ended today.

Thus, a presumed fifth wave down from last month's top — forming since last Thursday's peak (which seems like 100 years ago!) — might feature further selling before completing. How this might take shape is difficult to say, yet one thing is certain: development of technical divergences indicative of a bottom forming require indexes close below May 7th's close (the day after the flash crash, when a presumed third wave down from last month's top ended).


Fast Money

* * * * *

© The Risk Averse Alert — Advocating a patient, disciplined approach to stock market investing. Overriding objective is limiting financial risk. Minimizing investment capital loss is a priority.

Analysis centers on the stock market's path of least resistance. Long-term, this drives a simple strategy for safely investing a 401(k) for maximum profit. Intermediate-term, investing with stock index tracking-ETFs (both their long and short varieties) is advanced. Short-term, stock index options occasionally offer extraordinary profit opportunities when the stock market is moving along its projected path.

Nothing is set in stone. Nor is the stock market's path of least resistance always known. More often than not, there are no stock index option positions recommended.


There's an easy way to boost your investment discipline...

Get Real-Time Trade Notification!


Tuesday, May 18, 2010

Lower, Slower, Over the Next 12 Months?


Considering the similar evolution of price action off March '09 bottom with that occurring during the market's counter-trend rally off March '08 bottom (that is in relation to respective declines preceding each rally), near-term perspective might be gained on what lies ahead (assuming these similar relations continue), as major indexes begin tracing their initial wave lower in a larger decline targeting levels last seen in the 1980s...


$SPX

Observe the S&P 500's initial wave lower following completion of its counter-trend rally from March - May 2008. Note how the S&P 500's rate of descent from May - July 2008 was relatively less dramatic than was the case prior to March '08 bottom.

If relative similarities considered here were to carry forward, then the presently anticipated, initial trip back down to March '09 low (and quite possibly a bit beyond) might be an affair lasting the better part of the next twelve months. Seeing there was no great rush to retest March '08 low following completion in May '08 of the counter-trend rally off that low, retest of March '09 low might be similarly restrained, relatively speaking.

In other words, no matter how bad — vulnerable — things might in fact be throughout the global financial system, near-term damage inflicted on stocks could be relatively contained during the presently unfolding (still in the very early stages), initial resumption of the next leg lower in an Elliott corrective wave that began in October 2007.

Shortening this view to the here and now, the completion of five waves down from last month's top awaits. In the process the S&P 500 should make a decisive break below its 200-day moving average.

Judging by today's trading (and failure to sustain the early bid) the present thought is the fourth wave of five waves down from last month's top completed last Thursday. So, the fifth wave down might be unfolding right now, with the worst of its decline possibly occurring before the end of the week.


Fast Money
* * * * *

© The Risk Averse Alert — Advocating a patient, disciplined approach to stock market investing. Overriding objective is limiting financial risk. Minimizing investment capital loss is a priority.

Analysis centers on the stock market's path of least resistance. Long-term, this drives a simple strategy for safely investing a 401(k) for maximum profit. Intermediate-term, investing with stock index tracking-ETFs (both their long and short varieties) is advanced. Short-term, stock index options occasionally offer extraordinary profit opportunities when the stock market is moving along its projected path.

Nothing is set in stone. Nor is the stock market's path of least resistance always known. More often than not, there are no stock index option positions recommended.


There's an easy way to boost your investment discipline...

Get Real-Time Trade Notification!

Monday, May 17, 2010

Poisoning the Lemonade


It's possible that, five waves down from last month's top completed today...


SPX 5-min

The fifth wave (a so-called "failure" per the Elliott Wave Principle) would be seen forming from last Thursday through today. Of course, these five wave down (were this view correct) are thought but the start of a much steeper decline yet to come — a first wave of five larger waves down. Thus, a brief period correcting this initial move lower from last month's top might be in store this week.

Or, it could be that, the fourth of five waves down from last month's top still is forming (with a move back up to the upper end of last week's range pending).

Or, today's turnaround might be all or part of a second wave of five waves of a larger third wave down from top (in keeping with last week's view that, the second wave down from top might have formed a so-called "running correction" and finished on Thursday).

Relative strength diverged today relative to Friday, so possibility of some short-term bottom being in place here has some technical substantiation. Whether this proves meaningful enough to forestall a challenge of May 6th's low remains to be seen, though.

(Yet the longer that day's low goes unchallenged, the stronger should become one's sensitivity toward evidence demonstrating desperation in the ongoing fight for a hopelessly bankrupt cause.)


$SPX

Personalities better cheerleaders than journalists can dig up whatever "technical" explanation for May 6th's gassing as is fitting their bottomless capacity for making lemonade out of lemons ... yet the fact of the matter is an entire month's gains (and then some) are not lost in a single day's trading in the midst of some bull run. Quite the contrary at this particular moment ... far, far removed from the far less leveraged 1980s.

Throw in volume rivaling records set during the collapse of '08, and you have the makings of a really serious development. Thus, those busy beavers who for many months had been distributing shares in slow fashion to those for whom time does not wait for any length over a quarter (so-called portfolio managers) at best might have one last opportunity in a relative moment of calm to finish their deed before any new threat of game-changing regulation makes an uphill charge.


So, banks are at a "stress test" threshold where they need to recapitalize ... again ... says John Tobacco. Hmmm. Where do you suppose they'll be raising said capital?

Judging from news that Soros dumped a huge stake in Citigroup ... said capital just might prove exceedingly scarce.


Fast Money
* * * * *

© The Risk Averse Alert — Advocating a patient, disciplined approach to stock market investing. Overriding objective is limiting financial risk. Minimizing investment capital loss is a priority.

Analysis centers on the stock market's path of least resistance. Long-term, this drives a simple strategy for safely investing a 401(k) for maximum profit. Intermediate-term, investing with stock index tracking-ETFs (both their long and short varieties) is advanced. Short-term, stock index options occasionally offer extraordinary profit opportunities when the stock market is moving along its projected path.

Nothing is set in stone. Nor is the stock market's path of least resistance always known. More often than not, there are no stock index option positions recommended.


There's an easy way to boost your investment discipline...

Get Real-Time Trade Notification!

Friday, May 14, 2010

OTC Derivatives-Driven De-leveraging


This seems a timely moment to consider the impact on the stock market of that flood of credit created over the past few decades via OTC derivatives, and the prospect that, continuance of this arrangement is more gravely threatened now than ever before...


SPX monthly

Increasing leverage largely facilitated the stock market's spectacular ascent following the crash of October 1987. It was the Age of Greenspan ... who became Fed chairman earlier that year (raising the question: was the crash but some manufactured crisis created so some desired change might be gamed ... this one involving an intellectual skilled in oratory needed to rationalize a securities arrangement whose theoretical power facilitated risk mitigation of credit created to finance anything under the sun, even unbridled speculation?).

Yet since Y2k the power of increasing leverage has been escaping the global financial system — and this despite the lender of last resort moving to become "all in."

Last week's euro-fun demonstrated this truth once again ... let alone the fact that, risk of runs on liquid capital markets has by no means dissipated. Indeed, everything built up using OTC derivatives appears to be crashing down, everywhere — even China.

So, the recently accelerating regulatory rampage attacking all things fraud, everywhere — the likes of which OTC derivatives largely facilitated (and this, no less, to the shock of Herr Maestro) — has got to be one big wake up call. One rather suspects the stock market is made all the more vulnerable to destructive runs venturing to raise capital no longer available in credit markets threatened to become even more dysfunctional with [much needed] regulatory reform. A throttling back to levels last seen at the dawn of the Age of Greenspan seems almost a best case scenario.

Furthermore, a collapsing credit system is the kind of thing that can strike a wide swath of highly liquid asset classes, including gold and commodities in general ... as 2008 amply demonstrated.

Speaking of gold... Bob Prechter, co-author of the Elliott Wave Principle, today revealed an interesting tidbit about current investor sentiment toward that prized asset...


Everyone being "all in" gold jives with the growing probability that, the present political season again will feature a mad dash for capital available in liquid assets, be they metal or paper.

Now, let me draw your attention to the Elliott wave count on the chart above, covering the S&P 500 over the past forty-five years. In case you are wondering wave V (ending October 2007) completes five waves up from 1932. This fifth wave offers an interesting study in the so-called "rule of alternation" put forward in the Elliott Wave Principle.

Note how alternation takes form in second and fourth waves throughout the formation of wave V. You might recall this is very much like what developed during formation of five waves off March '09 bottom.

Of particular interest here, though, is how the fourth wave of wave V (2000-2002) markedly weakened the S&P 500's advance since 1974 — this by its downwardly-biased, alternating form, as well as its greater negative impact on RSI, both seen in relation to the second wave of wave V (1976-1982). Added confirmation of increasing weakness is seen via coincident RSI registered following 2002 bottom ... first, as the fifth and final wave from 1974 unfolded (failing to best RSI registered during formation of the third wave of wave V), and then since top (moving strongly to the negative, and now to buy- and sell-side balance following a short squeeze for the ages off March '09 bottom).

So, this longer view offers a suitable backdrop, then, to recent musings suggesting an imminent decline challenging March '09 lows appears in the offing. As you can see, a far worse fate could be awaiting the stock market, as the viability of what Warren Buffett once called financial weapons of mass destruction meets its greatest challenge ever in the U.S. Senate.

This does not mean March '09 lows will be taken out precisely as indicated above, though. What is intended here simply is a view of the path of least resistance over the next few months extending through the next couple years.

Nevertheless, a near-term, catastrophic collapse ought not be ruled out, particularly considering last Thursday's shocking turn of events. Revealed was just how extraordinarily frail are markets of all sorts. The possibility is very real we might soon witness a period wherein circuit breakers prevent most from exiting trades, leading to a relentless, cascading tumble, turning today's trusting souls with no inkling of the past decade's distribution into tomorrow's tragic losers.

So, let's consider the technical situation at the present moment...


$SPX

Relative strength measured on a daily basis is in a much weakened position. Presently registering firmly on the sell-side of its range, RSI suggests the market is vulnerable to further selling.

Is this threat more like late-January ... when the S&P 500 was but poising to finish a five wave move lower?

Or, instead, will selling more greatly resemble periods prior to March '09 bottom?

I strongly suspect the latter. Thus, were it likely that, a third wave down from April top began unfolding today, then it seems equally likely that, momentum (MACD) is slated to fall below its trough set at March '09 bottom (and in the process increase the probability of that larger market decline presented above, wherein a return to levels last seen in the 1980s is projected).


$VIX

The market's counter-trend rally off March '09 bottom has been likened to that previous counter-trend rally from March-May 2008. Indeed, given the uncanny similarity price action off March '09 bottom has with that off March '08 bottom (that is in relation to respective declines preceding each rally), one wonders if, as a consequence of the present, initial resumption of a larger projected decline, volatility might behave similarly, relative to its range established during the market's preceding decline.

As you can see, the market's decline from May-July 2008 — a sell-off taking the S&P 500 below its March '08 low (and representing but initial resumption of a larger decline) — resulted in the Volatility Index rising to a level near its highest reading set during the market's decline into March '08 bottom.

Might the same occur now, as the initial decline of a larger projected sell-off unfolds over days immediately ahead, resulting in the VIX being carried back up to the attic?


$CPC

As noted recently, one might expect a marked burst in put options purchases hedging long equity positions were buying support necessary for initiating a counter-trend rally (within the context of a larger, unfolding decline) thought in place.

Yet relative to intermittent lows from which a counter-trend rally developed during the 2007-2008 period, the present level of put options hedging is not yet in the ballpark where one might expect buying support. So, here too, is added evidence suggesting a good deal more selling might be in store over days straight ahead.


Fast Money
* * * * *

© The Risk Averse Alert — Advocating a patient, disciplined approach to stock market investing. Overriding objective is limiting financial risk. Minimizing investment capital loss is a priority.

Analysis centers on the stock market's path of least resistance. Long-term, this drives a simple strategy for safely investing a 401(k) for maximum profit. Intermediate-term, investing with stock index tracking-ETFs (both their long and short varieties) is advanced. Short-term, stock index options occasionally offer extraordinary profit opportunities when the stock market is moving along its projected path.

Nothing is set in stone. Nor is the stock market's path of least resistance always known. More often than not, there are no stock index option positions recommended.


There's an easy way to boost your investment discipline...

Get Real-Time Trade Notification!