Friday, October 31, 2008

One More Moan for a Missed Opportunity...


Alright, I finally finished the Elliott Wave analysis I promised you the other day...

20/20 Hindsight Meets $20 Million Foresight

Pardon my continuing to kick myself for missing the golden opportunity the market's October decline presented. I only do this in the hope we learn something from it. Take a look at what hit me between the eyes tonight. How could I be so blind?


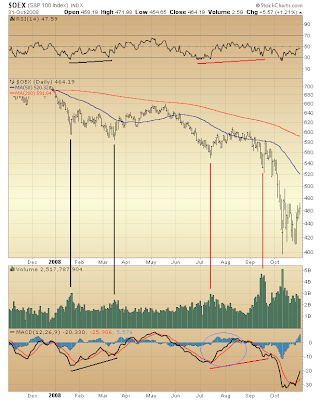
$OEX

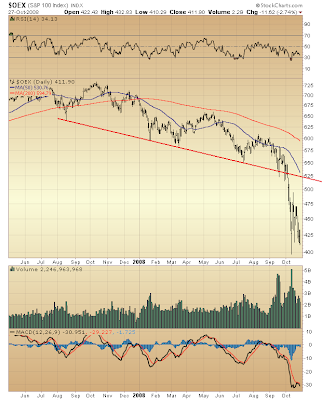
As you know, I am always looking for divergences — positive or negative — at turning points.

September 17th... there were the oft' noted RSI and MACD divergences relative to the July 15th bottom ... just as happened at bottom, March versus January. Oh yeah, I was all over that.

But look at volume going into the September 17th low relative to July 15th. Was this anything like March versus January? Quite the opposite! Volume in March diverged from January, and in so doing, confirmed bottom. Contrarily, volume in September widened ... this at a lower low than July ... confirming an urgency to selling ... and man, did we see a lot more of that!

I completely missed the volume clue. I wanted to show you, so next time maybe you'll wake me up.

Remember back in late-July when it had become clear imminent "capitulation" was moving off the table? MACD was rising to its 0 line and I indicated this needed watching. Yet look ... by September 17th it was solidly negative ... and falling like a rock. What was I thinking! Talk about your deer in the headlights...


That's enough crying for now over one big miss on some serious bank. So, let's play connect the dots...


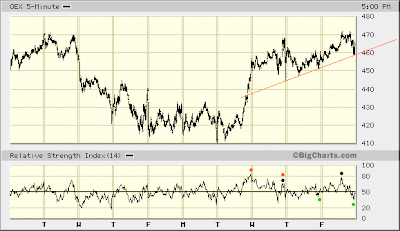
OEX 5-min

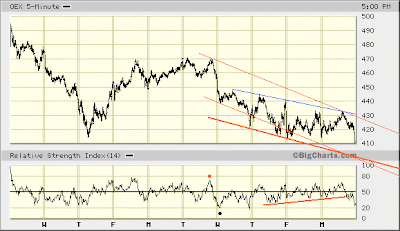
Red dots ... a price-RSI divergence at a new high. That's a negative ... as in bearish ... and all the more so because the first print reached a buy-side RSI extreme. No wonder, then, once the price-RSI divergence registered it took two days for OEX to trade slightly higher.

Black dots ... a price-RSI confirmation of a new high. That's a positive ... as in bullish.

Green dots ... a price-RSI divergence at a higher low. That's a negative. This is what I was looking for when on Mr. Market Twitter I wrote, "Upon a higher index low coinciding with a lower 5-min RSI low will the market again be about to turn lower in its bottoming process." If you look at the 10-day chart of the NYSE Composite Index in yesterday's post, you will see this condition developing just before the market came unglued last week.

Connecting the dots it looks like we have a mixed bag.
Now take a look at the 1-year S&P 100 chart above, and pay particular attention to the early February period when, like now, MACD was just beginning its break higher. Do you see how it came back down ... right at the start of the month no less? Well, Monday is the first day of trading in November, and all four of the Fast Money traders tonight said the new month's end would find the market trading higher, so be aware...


Fast Money
* * * * *

© The Risk Averse Alert — Advocating a patient, disciplined approach to stock market investing. Overriding objective is limiting financial risk. Minimizing investment capital loss is a priority.

Analysis centers on the stock market's path of least resistance. Long-term, this drives a simple strategy for safely investing a 401(k) for maximum profit. Intermediate-term, investing with stock index tracking-ETFs (both their long and short varieties) is advanced. Short-term, stock index options occasionally offer extraordinary profit opportunities when the stock market is moving along its projected path.

Nothing is set in stone. Nor is the stock market's path of least resistance always known. More often than not, there are no stock index option positions recommended.


There's an easy way to boost your investment discipline...

Get Real-Time Trade Notification!

Thursday, October 30, 2008

Picturing The Bottoming Process


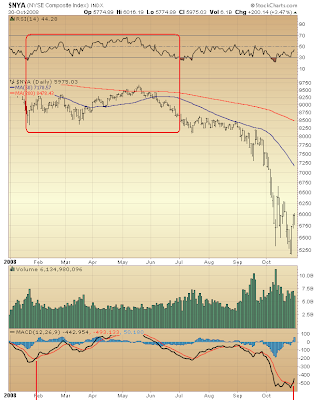
Some fuller visualization of how things might unfold over the weeks/months ahead as the stock market goes through its bottoming process is on tap tonight ... hoping to maintain perspective and establish reasonable expectations.


$NYA

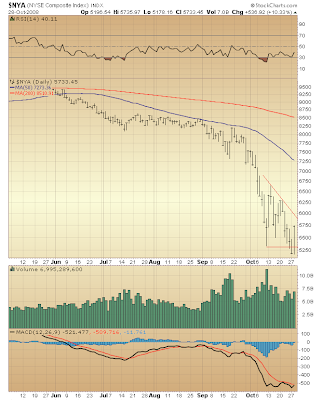
The six months isolated above might reasonably reflect the qualities of action set to unfold before the most rip-screaming rally in five years gets under way.

As you can see, MACD has just begun to turn higher... This is one of several "first signs" the stock market's bottoming process is, indeed, under way.

Now, before bottom is in we might see MACD first rise to a slightly positive level ... exceed August's peak ... then once again turn lower and finish well-above its present depths as indexes simultaneously retest current lows. (MACD rising to a positive reading is not a prerequisite to bottom. Yet a divergence such as occurred at the March bottom should be rather expected.)


$BPNYA

More "first signs" to a bottom. Indeed, the Bullish Percent Index clearly has made the turn. The same can be said for the NYSE McClellan Oscillator. So, the case for an upcoming period of relative buoyancy is gaining technical substantiation.


NYSE 5-min

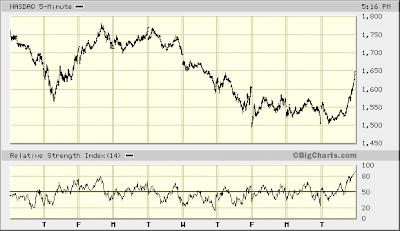
Another lower volatility treat today. In tonight's Fast Money clip Pete Najarian talks about volatility coming in. Since this is a "keeping things in perspective" post, you might want to consider how "volatility coming in" is a relative matter. Judging by the VIX, you might be hard-pressed to conclude volatility is "coming in." True, I recently have argued much the same as Najarian. Yet as you can see, the NYSE Composite appears vulnerable to another let down, a la last Wednesday, 10.22.08 (not that this has to happen tomorrow). In other words, daily moves of 5% or more (in both directions) remain on the radar...

Here's a couple other relevant thoughts of mine made in comments at other blogs...

Bears Have Rallies Too

Enough Panic. Let's Make Some Money!


Fast Money
* * * * *

© The Risk Averse Alert — Advocating a patient, disciplined approach to stock market investing. Overriding objective is limiting financial risk. Minimizing investment capital loss is a priority.

Analysis centers on the stock market's path of least resistance. Long-term, this drives a simple strategy for safely investing a 401(k) for maximum profit. Intermediate-term, investing with stock index tracking-ETFs (both their long and short varieties) is advanced. Short-term, stock index options occasionally offer extraordinary profit opportunities when the stock market is moving along its projected path.

Nothing is set in stone. Nor is the stock market's path of least resistance always known. More often than not, there are no stock index option positions recommended.


There's an easy way to boost your investment discipline...

Get Real-Time Trade Notification!

Wednesday, October 29, 2008

No Love for Monetarist Monkeys


Well, what do you think? We've got the most bullish Put/Call ratio since summer, and 62% of OEX open interest on the Call side...


$CPC

This is coinciding with yesterday's 5-minute RSI surge to a buy-side extreme, today's price-RSI divergence, and a show of no love whatsoever for a bunch of bungling monetarist monkeys...


OEX 5-min

Just don't you worry if things turn sour once again. Hopefully for the sake of bottom being somewhere nearby today's mixed bag, lower volatility treat becomes something of a new trend...


Fast Money
* * * * *

© The Risk Averse Alert — Advocating a patient, disciplined approach to stock market investing. Overriding objective is limiting financial risk. Minimizing investment capital loss is a priority.

Analysis centers on the stock market's path of least resistance. Long-term, this drives a simple strategy for safely investing a 401(k) for maximum profit. Intermediate-term, investing with stock index tracking-ETFs (both their long and short varieties) is advanced. Short-term, stock index options occasionally offer extraordinary profit opportunities when the stock market is moving along its projected path.

Nothing is set in stone. Nor is the stock market's path of least resistance always known. More often than not, there are no stock index option positions recommended.


There's an easy way to boost your investment discipline...

Get Real-Time Trade Notification!

Tuesday, October 28, 2008

Shining Apple Like Cramer


Bottoms up! Oh, I know you're wondering... Is bottom in? Yeah, it's in alright ... in the vicinity. And that's it. If nothing else, today went some way toward furthering the probability the stock market is in the process of bottoming.

First, it is encouraging to see the stock market's large-capitalization indexes relatively outperforming the broader market...


$OEX

As you can see, the S&P 100 broke out of its declining trend since peaking intra-day on Tuesday, October 14, 2008. Mind you, there is really nothing analytically noteworthy about this. I point it out only to reveal large-cap leadership being demonstrated. You'll see how in just a moment...

You might also note the S&P 100's intra-day low set on Friday, October 10, 2008 was not once exceeded prior to today's turn higher. This is a positive indication some well-capitalized buying interest is willing to snap up the cream of corporate equities. Thus, one might conclude the market's "generals" are leading the larger army out of a ditch. And this is as it should be at this point in the battle. Large-cap leadership offers evidence bottom is in the vicinity.

Still, despite signs of improving circumstances, there's no reason yet to get excited. RSI continues to trend lower and MACD, despite looking to bottom, has yet to decisively turn higher.

Now, lets contrast the situation presented by indexes tracking both major U.S. exchanges...


$NYA

Beyond yesterday's price-RSI divergence (relative to 10.10.08) I am hard-pressed to find anything constructive to say here. Nevertheless, the RSI divergence itself is positive indication the NYSE Composite's bottoming process is a work-in-progress.

Clearly, though, there's more work needed before bottom finally is in. Curiously enough, no price-MACD divergence registered yesterday. Instead, MACD confirmed the NYSE Composite's new low close. So, evidence here tilts toward maintaining a cautious posture. Once again there's just no compelling reason to get excited about today's surge higher.


$COMPQ

Just like the NYSE Composite, the NASDAQ Composite registered a price-RSI divergence yesterday (relative to 10.10.08). There are a couple other positive developments to note here, too...

First, yesterday's NASDAQ close at a new low coincided with a positive MACD divergence. And second, today's surge higher brought the NASDAQ Composite right up to its declining trend line (originating at its 10.14.08 peak), whereas the NYSE Composite fell well-short of its same declining trend line.

You will recall when I wrote, "Another Not-So-Kudlow-esque Chart Fest," my describing how NASDAQ demonstrates leadership in both directions. We're seeing the same thing here as the market forms bottom. So, much as large-cap indexes are revealing the sort of leadership one would expect, NASDAQ too is doing the same.

Tonight, Cramer talked about AAPL in much the same light.

Still, caution here is better advised...


OEX 5-min
NYSE 5-min
NASDAQ 5-min

Is there really any need to micro-analyze the situation 5-minute RSI reveals? The last time this happened was at the open on October 14th. At 9:36 a.m. Mr. Market Twitter said, " Red Alert! 5-min RSI screams 'SELL, SELL, SELL!'"

So, again, the last of selling probably has not been seen ... and odds Maria will soon moan in utter frustration still remain elevated...


Fast Money
* * * * *

© The Risk Averse Alert — Advocating a patient, disciplined approach to stock market investing. Overriding objective is limiting financial risk. Minimizing investment capital loss is a priority.

Analysis centers on the stock market's path of least resistance. Long-term, this drives a simple strategy for safely investing a 401(k) for maximum profit. Intermediate-term, investing with stock index tracking-ETFs (both their long and short varieties) is advanced. Short-term, stock index options occasionally offer extraordinary profit opportunities when the stock market is moving along its projected path.

Nothing is set in stone. Nor is the stock market's path of least resistance always known. More often than not, there are no stock index option positions recommended.


There's an easy way to boost your investment discipline...

Get Real-Time Trade Notification!

Monday, October 27, 2008

Bears Eating the Excitable for Pre-Hibernation Dinner


First up today... perspective.

Day after day the market declines. Yet I continue to contend the worst damage (for the moment, anyway) already has been done. Indeed, I see more reason to remain calm than fear any parallels to a dire past (1929 comes to mind).

Instead, you might want to start thinking seriously about new all-time record highs being set sometime over the next year...

Believe it or not, within the framework of Dow 3600, this is entirely possible.

(I am still working on analysis laying this out.)

Forgive me for being repetitive. The stock market is in the process of bottoming and this simply is going to take some time. Bottom might not be reached until sometime early next year. Contrarily, it might be forming right now. Either way, bottom probably will not be far from intra-day lows set on October 10, 2008.


$OEX

We've got RSI and MACD divergences going, as well as volume coming in...

Still, RSI and MACD remain in downtrends. So, look first for these trends to finally break. Indeed, that they have yet to do so suggests the market's decline since September continues.

Now, it is quite possible the market's decline since September is but part of a larger decline that began in May. This, too, needs time to complete. On Thursday I showed you what to look for.

The line you seen drawn on the above chart is a dividing line of sorts. Over the weeks ahead you will know the market remains in its bottoming process as long as that line is not penetrated. If, by chance, it is exceeded to the upside, then you will know bottom is in.


OEX 5-min

We did not get the 5-minute RSI improvement I was looking for (see Friday's post). This only increases the odds Maria Bartoromo will moan like she's suffering from a terrible stomach virus sometime over the days ahead. In other words, there could be more pain like today's.

Hey, look at that! The grid on the 10-day chart has shrunk to "just" 10 points. There you have it, then. Volatility apparently is diminishing (duh!). However, you wouldn't know it looking at the VIX.

If you watch todays "Word on the Street" clip, you will see a couple stocks that have turned the corner. This is precisely the course indexes should soon take, as well...


Fast Money
* * * * *

© The Risk Averse Alert — Advocating a patient, disciplined approach to stock market investing. Overriding objective is limiting financial risk. Minimizing investment capital loss is a priority.

Analysis centers on the stock market's path of least resistance. Long-term, this drives a simple strategy for safely investing a 401(k) for maximum profit. Intermediate-term, investing with stock index tracking-ETFs (both their long and short varieties) is advanced. Short-term, stock index options occasionally offer extraordinary profit opportunities when the stock market is moving along its projected path.

Nothing is set in stone. Nor is the stock market's path of least resistance always known. More often than not, there are no stock index option positions recommended.


There's an easy way to boost your investment discipline...

Get Real-Time Trade Notification!

Sunday, October 26, 2008

20/20 Hindsight Meets $20 Million Foresight


Elliott Wave Analysis Update

I always say nothing is set in stone. And I will say it again because ... obviously ... Dow 3600 is by no means a slam dunk certainty. Truth is that's just life. Still, a fall to Dow 3600 sometime over the next few years remains a rather high probability.

Also true is this...

FACT: The stock market has reached a very oversold condition.

Of course, this is a relative thing, and nothing set in stone says a very oversold market cannot soon collapse and become even more so. However, odds are against this.

Furthermore ... given how deeply oversold the market presently is ... given how unusually negative a multitude of underlying technical measures have become ... this Elliott Wave Guy strongly suspects the market's recent decline is a "third wave of a third wave" (typically the most dynamic of all Elliott Waves). In other words, it is more likely an "impulse wave" in the direction of the main trend (down), rather than part of some "corrective wave" within this trend lower.

A "dynamic" move is powerful. It has the effect of lending greater analytical certainty to past and present market action, as well as confirm the unfolding trend. Obviously, the market's decline over the month of October well-qualifies, then.


A Confession

Not at any time over the course of this year did I ever suspect the market might decline to such a magnitude as we have seen. True, back in April-May I was bearish (as I have been all year). I argued a sell-off demonstrating "capitulation" likely would take out January/March '08 lows. But never did I imagine such a bloodbath coming so soon.

I bring this up because I say, "nothing is set in stone," yet I am just as susceptible as the next stock market analyst to taking a hard-and-fast view toward past performance and future probabilities.

If there is anything I consider unwise in this game, it is holding too tightly to a forecast and doing everything to make the ever-unfolding evidence fit a given outlook at the expense of other viable alternatives. You see this all the time, no matter the observer's analytical framework — be it technical, fundamental, historical, statistical, whatever. The commentator almost seems "married" to a forecast, constantly presenting perspective lending credibility to a given outlook. In fact, I find this is more the rule than the exception.

And I am just as subject to this pitfall as the next person...

I am still kicking myself for missing the golden opportunity this recent decline presented. The monetary score trading stock index options could have been HUGE. I regret not perceiving the very conditions conducive to low-risk options play. Every time I look back to September I shake my head in disgust over not even seeing the possibility the market might collapse. It was all right there!

Long-time readers know I had a problem with the May 19th - July 15th decline. It simply was an analytical stretch arguing the much anticipating "capitulation" had, indeed, unfolded. The evidence was far from conclusive.

So, why was I not all over the possibility the market might crater?

I simply was "married" to one specific outlook among several possible alternatives en route to Dow 3600 sometime over the next few years. Indeed, this is the reason why I declared, "Capitulation!" on September 15, 2008 (the day Lehman died).

Argh! Looking back at my analysis then, I was thoroughly fooled to think there was time for one screaming advance prior to collapse. Yeah, there was time alright ... all of two days (September 18-19).

Proof I was married to one specific outlook toward how Dow 3600 might likely be reached came Monday, September 29, 2008. It was on this day index lows previously set on September 17th were taken out.

If ever there was an "Aha!" moment that should have been an indication something unusual — something unexpected — was developing ... this was it. I more or less thought 9.17.08 lows would hold. And I was unprepared for the possibility they might give way like a dry rotted floor. This largely was because I gave primary focus to but one possible analytical view on how indexes might trace their respective declines to levels last seen in 1994.


What Went Wrong?

Probably most responsible for this has been the view I have taken toward the market's progress since the year 2000...
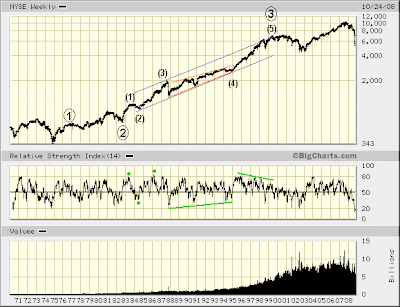

NYSE weekly

As you can see, I have not labeled the any of the components of wave . That's because I have been under the assumption this "corrective wave" still was forming. However, I should have been suspicious of this likelihood way back in late-2004 when the NYSE Composite reached a new, all-time record high.

Here's the deal. The Elliott Wave Principle's "Rule of Alternation" provides guidance for setting expectations in all wave formations. Its most basic aspect can be applied to "corrective" waves, and states that no two sequential corrections of the same magnitude will ever be the same type.

Waves and are "corrections of the same magnitude." Wave is a so-called "irregular flat" (and a special kind at that ... called a "running correction"). As such, then, the "Rule of Alternation" strongly suggests wave will not form another "irregular flat."

Yet once the NYSE Composite reached new high ground late in 2004, odds increased wave might be forming another "irregular flat." Granted, I have been assuming a different variation of an "irregular flat" might unfold ... and its complexity likely would differ from wave . Nevertheless, the "Rule of Alternation" suggests this outcome is improbable, because both waves and then would be forming the same type of corrective wave.

Not giving this simple fact greater play probably is at the root of why I did not anticipate the stock market's recent collapse.

Assuming the market was still in the process of correcting gains made from 1982-2000, I was constrained by a different set of probabilities most likely to develop at present.

Let me cut right to the chase... Odds are the stock market's advance from 1974 probably completed in October 2007. I simply have not given this possibility much consideration until now. The fact weekly RSI has reached a sell-side extreme not seen in decades is proving the deciding factor driving my altered analysis of present circumstances.

True as it is I did not expect this, there it is nevertheless. So, change my view I must...


NYSE weekly

The one (and only) thing I do not like about this prospective view is the failure of wave to reach the upper end of the NYSE Composite's price channel from 1974 (parallel red lines).

Supporting the above view, however, is the Elliott Wave Principle's guideline on "wave equality"...
It is one of the tenets of Elliott wave theory that two impulse waves will always tend toward the same size in both time and price. It generally holds true for two non-extended waves and especially true if wave 3 is an extension.

Now, I have stretched this guideline a bit. Note the bars I have drawn showing price equality (black bars) and time equality (red bars) ... overlapping, first, impulse wave and corrective wave ... and then, corrective wave and impulse wave . Is this legitimate? We will see.

But this new view solves the problem involving the "Rule of Alternation" of wave relative to wave . The NYSE Composite's correction from mid-1999 through October 2002 is seen as a "triple three" with a declining bias. Indeed, wave 's declining bias might go some way toward explaining why wave failed to reach the upper end of the price channel from 1974-2007.


Where Now?

Ever since concluding a market melt-up was no longer likely (see my "Outlook" of August 25, 2008 in the left column), I have been assuming the trip to Dow 3600 had begun, and would likely unfold in five waves down from last October's peak. So, as recently as a few weeks ago, I was labeling the market's decline since October '07 as follows...


$NYA

This assumed view on how Dow 3600 might be reached had me [wrongly] seeing the September 17, 2008 low as I did, and as well had me [quite possibly wrongly, too,] labeling the October decline as I did above on October 7th. As I said already, the severity of the market's October collapse has me seeing things slightly differently now.

Some time ago I mentioned how developments in the stock market (reflected by underlying technical conditions) take time to sink into my skull. That's because further developments often are needed before my initial interpretations are confirmed. This is particularly true when my analysis is challenged by circumstances.

The market's decline this month has proven one representative occasion. It has made more likely the following Elliott Wave interpretation...


$NYA

At the start I indicated the intensity of the recent decline suggests a "third wave of a third wave" (typically the most dynamic of all Elliott Waves) is unfolding. While the Elliott Wave count on the above chart might not be definitive — it might be subject to slight change — it presents a fair representation of what this means. The market's collapse this month simply justifies this revision.

Furthermore, given the market's current, deeply oversold condition, the case for a bottom being near seems well-justified, too (why even from November 1929 through April 1930, half the losses realized during the 1929 crash were recovered).

So, according to this revised Elliott Wave view, waves 4 and 5 of (c) are still to unfold. As this occurs it is safe to assume the five wave decline from May '08 forming wave (c) likely will channel as prescribed by the Elliott Wave Principle.

Now, how much lower this might take the NYSE Composite remains to be seen. I suspect either a so-called "fifth wave failure" might be in store, or wave 5 of (c) will not fall much below wave 3 of (c). Here is why...


NYSE weekly

This is the same longer-term chart of the NYSE Composite as was presented above, but drawn on arithmetic scale (rather than logarithmic). I have isolated the triangle forming wave (4) of and extended its boundaries forward through all the years since it formed.

At first glance this might seem an arbitrary and meaningless point of analysis. Yet there are Elliott Wave considerations worth pondering here...

In the matter of Depth of Corrective Waves, the Elliott Wave Principle states that, "corrections, especially wave four corrections, tend to terminate within the range of the previous fourth wave of one lesser degree."

Might the NYSE Composite's wave bottom in 2002 satisfy this guideline? If so, wouldn't it stand to reason the first leg down following wave 's completion might end in this range, too? (The casual reader might not grasp what I am analytically suggesting here, but the Elliott Wave geek who has been around awhile will...)


What's Ahead?

As you know, I believe "the Dow Jones Industrials could fall to 36oo tomorrow and still remain in a long-term uptrend." Let me show you why this is. You should appreciate this perspective...


DJIA monthly

Well, there you have it. In fact, the Dow could fall to 2000 tomorrow and remain in a long-term uptrend. Strange how talk of the Great Depression has become rather the rage these days...

So, now what?

Well, this might come as a shock to some, but the market might rise toward all-time record highs over the months ahead. In the eyes of this Elliott Wave Guy — particularly in light of what just passed — a melt-up is entirely possible.

I am not saying new all-time records are likely. Instead, I am only suggesting they are possible.

And while we're considering near-term possibilities, let's defer back to charts recently presented, showing upcoming objectives. The Elliott wave form assumed then might have slightly changed, but the indicated targets and direction quite possibly have not...
(This is a valuable aspect of Elliott Wave analysis. Not only can prospects often be usefully reduced to certain finite possibilities, but each alternative form ... different in some substantive way ... might point in the same direction, and portend a move of similar magnitude. You just can't beat that.)

First, there was the long-term chart of the S&P 100 suggesting why you should "Call Me the Chip Diller of Stock Market Analysts." Its purpose was to show why a sizable, upcoming bounce can be expected here. Weekly RSI screams, "All is well, remain calm."

Then, the next day I was "Turning the Market Clock Back to 1973-1974" with a long-term chart of the NYSE Composite showing how the price-RSI pattern of 1970-1974 bore a remarkable similarity to the 2002-present period. This was to suggest the worst is yet to come. Look again at this one. What if the present RSI dive is more like 1970's? This raises the possibility a launch to new-record levels might develop sometime over the months ahead before the market ultimately craters.

Which is to say I continue believing Dow 3600 could be reached sometime over the next few years, despite anticipating a rise toward all-time record levels quite possibly unfolding near-term...

* * * * *

© The Risk Averse Alert — Advocating a patient, disciplined approach to stock market investing. Overriding objective is limiting financial risk. Minimizing investment capital loss is a priority.

Analysis centers on the stock market's path of least resistance. Long-term, this drives a simple strategy for safely investing a 401(k) for maximum profit. Intermediate-term, investing with stock index tracking-ETFs (both their long and short varieties) is advanced. Short-term, stock index options occasionally offer extraordinary profit opportunities when the stock market is moving along its projected path.

Nothing is set in stone. Nor is the stock market's path of least resistance always known. More often than not, there are no stock index option positions recommended.


There's an easy way to boost your investment discipline...

Get Real-Time Trade Notification!
Friday, October 24, 2008

Base Forming on a Global Financial System Regulatory Pipe Dream


So, what does one make of a sideways trading stock market whose measured volatility — already extraordinarily elevated — continues growing as indexes merely retest their respective October 10, 2008 intra-day lows?

It might just mean the market will sooner bounce than fall apart in a big way. Today's trade seems to support this thesis.


$VIX

Rising volatility is all well and good while it coincides with a decidedly declining market. However, volatility's continued increase (as indexes stabilize, relatively speaking) might better be seen from a contrarian's viewpoint. As such, then, a bounce should be expected.

Volatility's recent rise to an extreme level certainly goes toward confirming an Elliott Wave view now bringing me to label the market's decline since September a "third wave of a third wave" (more on this over the weekend). Thus, taking perspective from volatility, then, one is left to ask how much worse can the market's decline get? In other words, is the worst probably over? I believe it is.


$NYA

(A word of caution... Whenever you see me draw lines on index charts projecting near-term possibilities ... it is entirely for the sake of indicating direction and magnitude, rather than suggesting the Elliott Wave structure and its timing.)

The market's pending bounce should lift respective indexes to the upper end of trading ranges established over the past couple weeks. Don't be surprised, though, if the trip higher is choppy rather than decisive. The late-January through late-February period might offer perspective.

More critically, the effect on RSI should be similar to what developed then. In fact, whether a choppy or a decisive advance develops, the desired effect on RSI is what matters here. A break in RSI's downtrend since May would indicate growing, underlying buying support and raise the probability the market is in the process of bottoming.

Then, following this projected bounce we should expect a retest of present lows (possibly exceeding them) whose net effect on RSI, the VIX and other technical measures would be similar to what occurred at the March bottom. Thus, expect technical divergences relative to extremes registered thus far in the market's decline. These will confirm the likelihood bottom is in. Bear in mind this probably will take some weeks to develop and could even extend into early next year.


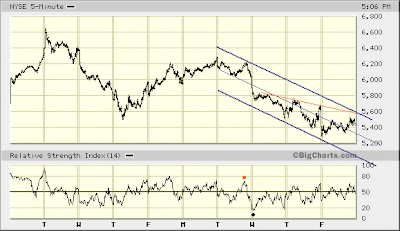
NYSE 5-min

(The channel I have drawn on the chart above is tentative.)

About today's Chip Diller vindication... Keep the "remain calm" advice in mind. There might be a bit more downside pressure over the days ahead before any meaningful bounce develops.

Assuming this week's turn lower is not yet over, here's what to look for before the market's anticipated bounce gets under way...

First, some added measure of buoyant price action (much as entered the market after today's opening drop) should result in 5-minute RSI rising above the red dot. This would indicate underlying buying support is strengthening. Subsequently, a decline to a new low should result in 5-minute RSI bottoming above the black dot. Thus, a positive price-RSI divergence would be established and set the stage for a technically constructive bounce.

The very fact today's extraordinarily negative pre-market indications did not precipitate a full blown collapse is significant. It demonstrates the existence of a determined buying interest willing to step in at currently depressed levels, no matter what degree of fear and uncertainty remains pervasive. This is precisely what Chip expected. Still, it's rather evident the rally off today's opening thud is not likely the start of the market's anticipated bounce. So, again, remain calm.

The market's bottoming process appears to have a good bit more to go before any sustainable advance lasting some months gets under way. Yet once it does, it's possible the market's charge higher could carry some [large-cap] indexes to new all-time record levels.

Now, I am not so sure how likely this possibility is. However, no matter how high the market might rise, its advance will occur within the context of a larger bear market that began last October (2007). This bear market's tentative objective is in the vicinity of index levels last seen in 1994. It is slated to end sometime over the next few years. I'll further develop this outlook over the weekend...


Fast Money
* * * * *

© The Risk Averse Alert — Advocating a patient, disciplined approach to stock market investing. Overriding objective is limiting financial risk. Minimizing investment capital loss is a priority.

Analysis centers on the stock market's path of least resistance. Long-term, this drives a simple strategy for safely investing a 401(k) for maximum profit. Intermediate-term, investing with stock index tracking-ETFs (both their long and short varieties) is advanced. Short-term, stock index options occasionally offer extraordinary profit opportunities when the stock market is moving along its projected path.

Nothing is set in stone. Nor is the stock market's path of least resistance always known. More often than not, there are no stock index option positions recommended.


There's an easy way to boost your investment discipline...

Get Real-Time Trade Notification!
Thursday, October 23, 2008

New All-Time Record Highs Within a Year?


Chip Diller here. You know the refrain... Remain calm! All is well. I am saying this now simply because downside pressure sure to develop between here and bottom might lead you to push the panic button. Don't do it.

It could be another month or more before bottom finally is in. The next week or two probably will feature range-bound trading essentially going nowhere. Further confirmation of a pending bottom should develop as a consequence. Like I've been saying, expect the stock market's bottoming to be a process.


$NYA

I'll keep this short. The final move to bottom probably will not get under way until such time as RSI rises above the level I have indicated on the above chart. Furthermore, any decline below the intra-day low set on Friday, October 10, 2008 should be quickly reversed. This applies as much over the next couple days as it will once bottom ultimately is set sometime in the weeks ahead.

As you know, the Elliott Wave Principle affords a considerable degree of analytical flexibility. In light of this I want to briefly tell you it is possible the market topped last October (indeed, this is likely) ... has begun its steep decline to the vicinity of levels last seen in 1994 (the vaunted Dow 3600 objective) ... and yet might soon bounce to such a degree as results in some major stock indexes setting new, all-time record highs sometime during the next year (believe it or not!).

I'll detail this possibility shortly. For now, just remain calm. All is well...


Fast Money
* * * * *

© The Risk Averse Alert — Advocating a patient, disciplined approach to stock market investing. Overriding objective is limiting financial risk. Minimizing investment capital loss is a priority.

Analysis centers on the stock market's path of least resistance. Long-term, this drives a simple strategy for safely investing a 401(k) for maximum profit. Intermediate-term, investing with stock index tracking-ETFs (both their long and short varieties) is advanced. Short-term, stock index options occasionally offer extraordinary profit opportunities when the stock market is moving along its projected path.

Nothing is set in stone. Nor is the stock market's path of least resistance always known. More often than not, there are no stock index option positions recommended.


There's an easy way to boost your investment discipline...

Get Real-Time Trade Notification!

Wednesday, October 22, 2008

Why Kimberly-Clark Is A "Defensive" Stock


Does anyone know if the profit margins on "Depend" undergarments are wider than "Scott" toilet tissue? Both are made by Kimberly-Clark (NYSE: KMB). I'm just curious because these are non-discretionary, personal hygiene products ... and being most everyone with an interest in the stock market is pooping their pants, I figure this stock might be a screaming buy!

So much for my fun-da-mental analysis...

Today's Fast Money was a stock market fright fest, start to finish. Reaching deep inside my analytical bag of tricks, I find this version of Mary Mary Quite Contrary producing similar images of carnage taunting Fast Money traders and recognize the irony. Much like the nursery rhyme, despite yesterday's victims being buried, fearsome memories sometimes shrink the fact life goes on. As such, then, we find hindsight sometimes is the curse of the living...

According to Dennis Gartman, speaking on the subject of today's trading, "This is a bear market and this is how bear markets act."

Yet he failed to mention that, within a bear market stocks sometimes rally 20-50% or more. I believe this is nearly where we are at.


$OEX

You see volume diminishing with each successive trip to the vicinity of today's close (all occurring during decidedly down days over the past couple weeks). Although on one hand this suggests selling exhaustion, on the other it demonstrates how the ongoing crisis of confidence continues. The failure of a sustainable bid materializing is resulting in continued downward pressure despite the fact selling is diminishing.

Positive RSI divergences are encouraging, yes ... yet RSI's downward trend remains intact. Likewise, MACD has yet to display anything strongly suggesting a decided reversal higher is imminent. On both counts, though, one day's strong advance could change all that.


OEX 5-min

You see today's selling had the effect of dragging 5-minute RSI lower than what registered last Thursday (10.16.08) when the S&P 100 declined to what then was thought possibly bottom. This negative price-RSI divergence heightens my more recently expressed doubt toward last week, in fact, being "bottom."

Still, 5-minute RSI today reached sell-side levels typically coinciding with reversals higher. So, assuming the market is in the midst of a bottoming process, it is just as well I conclude today's comments just like yesterday's.

I still tend to think a slow, painful bleed might be in order — something to break the will of the "bottom is in" faithful. Today certainly went some way toward this end. Thus, soon we might more confidently develop a bullish stance metaphorically based on the London Bridge is Falling Down nursery rhyme...


Fast Money
* * * * *

© The Risk Averse Alert — Advocating a patient, disciplined approach to stock market investing. Overriding objective is limiting financial risk. Minimizing investment capital loss is a priority.

Analysis centers on the stock market's path of least resistance. Long-term, this drives a simple strategy for safely investing a 401(k) for maximum profit. Intermediate-term, investing with stock index tracking-ETFs (both their long and short varieties) is advanced. Short-term, stock index options occasionally offer extraordinary profit opportunities when the stock market is moving along its projected path.

Nothing is set in stone. Nor is the stock market's path of least resistance always known. More often than not, there are no stock index option positions recommended.


There's an easy way to boost your investment discipline...

Get Real-Time Trade Notification!

Tuesday, October 21, 2008

Whether Water or Money, a Tsunami is a Frightful Thing


Tonight's post begins with a short, 16 second video clip offering a reminder of the need for "Guaging the Stock Market's Selling Avalanche Risk." Let's just say that, with monetarist monkeys running low on bananas, the phrase, "Be careful, it's a jungle out there," might find new meaning ... as might notions involving "blood in the streets." Not that I believe this risk is imminent. However, its prospect is near enough to suggest one not lose sight of frightful possibilities building with a tsunami of money that's largely unrestrained from engaging in outright extortion. Watch closely...


I jumped too! Yet the fright speaks volumes toward what might be considered a natural follow-on to increasing instances of blackmail — each costing hundreds of billions of dollars — the likes of which contemporary culture apparently is too weak, politically, to resist. The trend that is your friend here is, first, chaos, then, blackmail. If you think this is going away with the Bush administration, you're dreaming. The risk of a selling avalanche in all things "dollar" (including the stock market) sometime over the next few years is very, very real.

The only thing interesting worth noting today follows on yesterday's observation of OEX open interest. Despite the S&P 100 rising nearly 5% on Monday, OEX Call open interest expanded by nearly 3,000 contracts over Put open interest. This is opposite what one would normally expect. So, either "the bottom is in" faithful got more long, or strong hands shorting a rising market added to their hedges. Both have negative implications.


$NYA

Resistance to any further rise off last Thursday's intra-day low probably is not far overhead. However, just how fast and furious any subsequent selling might be is an open question. I tend to think a slow, painful bleed might be in order. Something to break the will of the "bottom is in" faithful. We'll just have to wait and see what develops...


Fast Money
* * * * *

© The Risk Averse Alert — Advocating a patient, disciplined approach to stock market investing. Overriding objective is limiting financial risk. Minimizing investment capital loss is a priority.

Analysis centers on the stock market's path of least resistance. Long-term, this drives a simple strategy for safely investing a 401(k) for maximum profit. Intermediate-term, investing with stock index tracking-ETFs (both their long and short varieties) is advanced. Short-term, stock index options occasionally offer extraordinary profit opportunities when the stock market is moving along its projected path.

Nothing is set in stone. Nor is the stock market's path of least resistance always known. More often than not, there are no stock index option positions recommended.


There's an easy way to boost your investment discipline...
Get Real-Time Trade Notification!

Monday, October 20, 2008

Not Yet Time To Be "All In"


Did you happen to notice both the NYSE and NASDAQ McClellan Oscillators turned positive following today's "surge" higher in the stock market? The case for bottom builds.

Did you also happen to notice volume the past three days has been drying up, while indexes have been rising?


$NYA

One of the Fast Money Traders questioned this tonight while Carter Worth was presenting his case for being "all in" on the long side. Carter didn't answer Tim Seymour. So, I will...

Are you noticing various commentators and analysts (myself included?) displaying a great deal of willingness to pound the table on bottom being in?


$CPC

The CBOE Put/Call Ratio sure is coming in quite fast. You might say those who are pounding the table about bottom being in are putting their money where their mouth is. Likewise, OEX open interest has begun the November front-month with a decided bias to the Call side. This suggests either strong hands are short the market and their positions are hedged with Call options, or speculators are so sure about bottom, they're "all in."

I don't like this one bit. It's not that I am afraid the floor is about to fall out from underneath the market. Rather, I suspect the official Vince Farrell bottom has yet to be seen. Looks like there might be more gnashing of teeth still to come.

This is not to suggest the market will immediately reverse tomorrow and begin its final dive. Indeed, it may be several days ... and possibly a few weeks ... before the market retests recent lows ... then subsequently explodes higher.


Fast Money
* * * * *

© The Risk Averse Alert — Advocating a patient, disciplined approach to stock market investing. Overriding objective is limiting financial risk. Minimizing investment capital loss is a priority.

Analysis centers on the stock market's path of least resistance. Long-term, this drives a simple strategy for safely investing a 401(k) for maximum profit. Intermediate-term, investing with stock index tracking-ETFs (both their long and short varieties) is advanced. Short-term, stock index options occasionally offer extraordinary profit opportunities when the stock market is moving along its projected path.

Nothing is set in stone. Nor is the stock market's path of least resistance always known. More often than not, there are no stock index option positions recommended.


There's an easy way to boost your investment discipline...

Get Real-Time Trade Notification!