Thursday, June 30, 2011

Poised to Disappoint


The imbalance of recent negative sentiment, relative strength and momentum no doubt is being repaired on the back of this week's rally — itself, an unusually strong burst occurring amidst the weakest technical backdrop since last year's "flash crash."

Yet beyond this repair, nothing technically compelling is accompanying the market's recovery. If anything, only further indications of underlying weakness are being revealed.


$SPX

For example, volume accompanying advancing periods since June 16th bottom is but more muted than advancing periods previous — indeed, something of a consistent trend since March '09 bottom, and now only the more curious. Oh wall of worry, where art thou?

Why, below we see that long equity hedging at "bottom" inflection points this year — late-January, mid-March and mid-June — in the vicinity of SPX 1275 have been consistently increasing, yet the question is whether this will prove sufficient, now that the market's momentum (bottom panel of $SPX chart above) was turned to the negative in June...


$CPC

An ominous setup the CBOE Put/Call Ratio presents (see early-May 2010). Then, considering volatility's marked contraction this week, all the more ominous is the technical backdrop.

Likewise, with daily breadth relatively subdued this week, yet averaged over the past ten days rather reflecting a consensus relatively certain about the market's positive prospects, what awaits in truth might reasonably be thought anything but.

By every technical measure I consider in these parts, the market appears poised to disappoint, and this even in a most dramatic fashion.

Watch index momentum. Its present rise from the negative to approach its "0" line will fail crossover only if the market turns south, and probably in a big way, over the next few days.

Without going into details tonight, it appears top to the market's advance since late last Friday (6/24) is nearly at hand. Should my negative outlook here — still supposing June 16th bottom will be taken out, if not left in the dust — reflect a correct read of underlying technical conditions, then the market's 5-wave advance since last last Friday is seen forming the "c" wave of an a-b-c corrective wave up, this recovering some of the market's losses from May 1st top. Once this corrective wave higher completes, it's right back down she goes. And I will say it again: the trip just might turn nasty.


Fast Money
* * * * *

© The Risk Averse Alert — Advocating a patient, disciplined approach to stock market investing. Overriding objective is limiting financial risk. Minimizing investment capital loss is a priority.

Analysis centers on the stock market's path of least resistance. Long-term, this drives a simple strategy for safely investing a 401(k) for maximum profit. Intermediate-term, investing with stock index tracking-ETFs (both their long and short varieties) is advanced. Short-term, stock index options occasionally offer extraordinary profit opportunities when the stock market is moving along its projected path.

Nothing is set in stone. Nor is the stock market's path of least resistance always known. More often than not, there are no stock index option positions recommended.


There's an easy way to boost your investment discipline...

Get Real-Time Trade Notification!

Wednesday, June 29, 2011

Death Cross & Death Cross on Ponzi Place


There's no need to alter yesterday's conclusion that, the market's technical state remains notably weak, leaving the market at heightened risk of extending its loss off May 1st top. This perspective is particularly weighty with national treasuries being torched today in a fit of rage directed toward cowardly parliamentarians who once again bowed to corrupt financial enterprises which, themselves, appear on the verge of destruction...


XLF

It appears the dirty secret that, the trans-Atlantic banking system is an insolvent train wreck is becoming common knowledge despite mighty efforts pretending it isn't so being put forward in heavy doses of sophistry spewed by a herd of perishing dinosaurs dominating high places in both the public and private sector on both sides of the Atlantic.

The question now is where will capital needed to prop up the king lender of last resort — the U.S. Treasury — be found once the bankrupt Federal Reserve ends its hyperinflationary QE madness tomorrow?

And how many European finance ministries must be torched in defense of the indefensible? Let's face it, as many as need be in order that interest rates at the core of Adam Smith's Leveraged Ponzi Scheme be indefinitely held down...


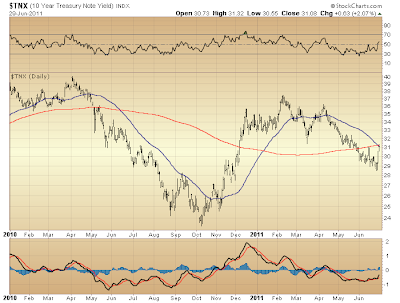
$TNX

Death Cross numero two. Come Italy, come Ireland, come Portugal, come Spain ... into U.S. Treasuries. Worry not! China can prop up your euro scrip while it eats German manufacturing for lunch. Thus, the euro-zone periphery shall not suffer alone. Every European nation, rich and poor, will be made to endure its own disintegration, as physical shutdown brutally imposed removes excess supply at the very dear price of millions of lives simply no longer sustainable in this, the collapsing phase of the greatest Ponzi scheme the world has ever seen.

This is all very bad for the riskiest financial asset of all, particularly since expanding consumption is the basis upon which its lofty valuations are founded.


SPX 15-min

Relative strength's receding phase (like that last Tuesday and Wednesday) believed yesterday to have begun following the market's strong lift higher at the open, proved a premature expectation in the face of today's excitement over seeming success extorting the weakest among European sovereign nations. Following on last Thursday's capitulation, though, seeing how soon has come its polar opposite — irrational exuberance — evidenced by RSI at today's open reaching a fair, buy-side extreme, the greater gravity of undue conviction among bottom fishers in the face of some of the weakest, underlying technical conditions since March '09 bottom weighs on prospects for a further bout of selling taking major indexes lower still from respective May 1st peaks. Indeed, one rationally supposes the risk of the market's imminent collapse only is increasing.


SPX 1-hr

Best estimate at the moment is that, resumed weakness of any consequence probably will not develop until next week. First, top to the presently unfolding counter-trend rally off last Thursday's low ... probably occurring tomorrow with the market moving little higher. Then, an initial fade and recovery, leaving relative strength in a weakened state and the market but more vulnerable to disappointment. The setup toward this end could carry through to Friday's close.

Of course, near-term prognostications of this sort require dynamic assessment during the course of each trading day, with useful conclusions reached contrasting index performance at various time intervals and contexts. Likewise, for the sake of gauging animal spirits — whether they be waxing or waning — one might also compare, say, the S&P 500 with the NASDAQ 100.


NDX 15-min

Survey says animal spirits be waning, notwithstanding appearances on the surface.

Now, short-term perspective useful for day trading generally has not been the focus here over the past few years. Instead greater attention has been (and will continue to be) given to bigger picture considerations with a view toward a July 1932 moment approaching. An historic buying opportunity like then but first awaits inevitable unraveling of Adam Smith's Leveraged Ponzi Scheme, then capitalism's return to sanity, this beginning with restoration of Glass-Steagall (which two things need not proceed in the order I have stated, much as May 6, 2010 amply demonstrated).

Over the past couple weeks I have begun logging intra-day observations on both SPX and NDX, and doing this with an eye toward creating a fee-based service for short-term traders. However before I launch this, I want feedback from those who could immediately use it. Those who, say, might get their trading ideas using some automated stock/option/ETF trading system and desire more consistent success using it. With my intra-day observations supplementing your decision making, your more certain ability to profit might finally pry from the market the rich reward you rightly deserve.

So, if I have your attention, then write me (subject: SPX v NDX). I will point you to my intra-day blog (it functions like Twitter in that updates automatically appear without you needing to reload the page).

Right now, I'm just looking to get your constructive feedback. Let's see if by incorporating my succinct, short-term-oriented analysis into your current trading methodology a barrier to your more consistent and profitable success might be breached.

My email address appears in the blog header above. Go ahead and write me.


Fast Money
* * * * *

© The Risk Averse Alert — Advocating a patient, disciplined approach to stock market investing. Overriding objective is limiting financial risk. Minimizing investment capital loss is a priority.

Analysis centers on the stock market's path of least resistance. Long-term, this drives a simple strategy for safely investing a 401(k) for maximum profit. Intermediate-term, investing with stock index tracking-ETFs (both their long and short varieties) is advanced. Short-term, stock index options occasionally offer extraordinary profit opportunities when the stock market is moving along its projected path.

Nothing is set in stone. Nor is the stock market's path of least resistance always known. More often than not, there are no stock index option positions recommended.


There's an easy way to boost your investment discipline...

Get Real-Time Trade Notification!

Tuesday, June 28, 2011

Undue Conviction Among Bottom Fishers


There is ample, underlying technical weakness to suppose Thursday, June 16th did not mark the low to the market's decline from May 1st top. It rather appears another round of selling imminently threatens.

The scope of this risk presently is uncertain. A slow, orderly decline could develop, or a gassing leaving little doubt about May 1st top contrarily might unfold.

Should further selling prove orderly and not terribly deep, then whether May 1st peak will in fact mark top to the market's counter-trend rally off March '09 bottom likely will be put to the test subsequently.


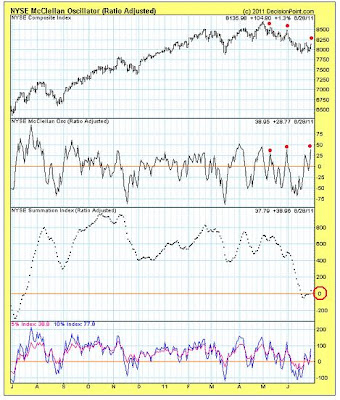
NYSE McClellan

No doubt, there has been some notable improvement in McClellan Oscillator readings since the market's June 16th bottom. Seeing the Oscillator registering higher lows as the market was stabilizing over the past couple weeks might from a static point of view indicate a floor being put under the market.

All the more might this conclusion seem fitting following the market's bounce early last week, taking the Oscillator positive, after which its "0" line was retested following last Thursday's and Friday's weakness. Today's seeming confirmation of increasing underlying strength, such as lifted the NYSE McClellan Oscillator to a new high, post-June 16th bottom, might only further conviction that, a floor is in place. The Summation Index's lift to the positive today might be thought presenting but icing on the cake.

However a more dynamic view contrasts one measure in relation to the other. So, with the NYSE Summation Index having gone into a tailspin following many months of registering increasing underlying weakness, improving Oscillator readings coinciding with lower NYSE peaks since May 1st top rather might reveal undue conviction among bottom fishers bidding the market higher following its further fall (each decline having been confirmed to the negative by the McClellan Oscillator). Twice already since May 1st this has proven the case. And here again another instance, yet this time with the NYSE Summation Index clearly reeling. Hence the market's prospective collapse is a most reasonable fear.


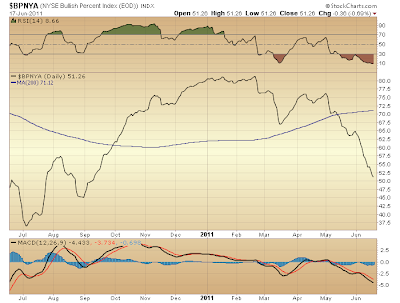
$BPNYA

The relative strength measure of the NYSE Bullish Percent Index remains in what has proven a danger zone (below 30) for the market. Since March '09 bottom, this condition's existence consistently has coincided with market weakness.

Per $BPNYA's improving relative strength since the market's June 16th low, it is worth noting similar improvement going into end-of-month, May — a positive turn which then proved a fleeting indication of pending market strength, as June's trading further sunk the NYSE Bullish Percent Index, as well as the measure of its relative strength.

Were the market to continue its decline from May 1st peak the Bullish Percent Index likely will follow. How this will impact $BPNYA's relative strength remains to be seen. Given the depth to which it fell this month, a [positive] divergence reasonably might be anticipated. Thus does possibility of a more orderly decline upcoming gain technical substantiation.

All things considered, what appears immediately in store finds agreement with a point of view Katie Stockton of MKM Partners put forward yesterday after the close in an interview with CNBC's Sue Herera...


Of course, I don't share her more sanguine view toward what likely will follow the coming "shakeout." Yet the factors she cites anticipating near-term weakness seem in agreement with my conclusion that, the market's technical state presently leaves it vulnerable to falling further from its May 1st peak.

Now, if you have been keeping a close eye on insights I dutifully present here following each trading day, and your better sense of the market's near-term direction is well-served, then you might value all the more free access to my intra-day perspective coming soon. Bringing you greater certainty in your daily dealings is my single objective in this new venture.

Depending who you are — how frequently you are trading — timely technical insights from yours truly when the U.S. market is open could elevate your trading prowess and better assure your success.

More tomorrow about this goodness. For now, though, a taste of things to come...


SPX 15-min

RSI weakening prior to the market's turning lower, such as has occurred on several occasions this month (the most recent is highlighted above), has yet to develop over the course of the market's advance since late-Friday (6/24). This anticipated RSI weakening could have begun late this afternoon, though. Likewise, its furthering should coincide with the market remaining levitated well into tomorrow's trading. Were a weak close to follow this, then look out below.


Fast Money
* * * * *

© The Risk Averse Alert — Advocating a patient, disciplined approach to stock market investing. Overriding objective is limiting financial risk. Minimizing investment capital loss is a priority.

Analysis centers on the stock market's path of least resistance. Long-term, this drives a simple strategy for safely investing a 401(k) for maximum profit. Intermediate-term, investing with stock index tracking-ETFs (both their long and short varieties) is advanced. Short-term, stock index options occasionally offer extraordinary profit opportunities when the stock market is moving along its projected path.

Nothing is set in stone. Nor is the stock market's path of least resistance always known. More often than not, there are no stock index option positions recommended.


There's an easy way to boost your investment discipline...

Get Real-Time Trade Notification!
Monday, June 27, 2011

Fearing the Worst


I suspect that Friday's perfect absence of any follow-through whatsoever to Thursday's strong upside reversal following that day's rough start had a lot to do with the Russell Reconstitution. Likewise today's seeming casting to the wind any residual fear born of Thursday's whipsaw and Friday's disappointing letdown: a technically driven affair in a world where indexing is outsized business.

So, any "message" tech is thought to be sending, then, certainly seems better understood in the context of machinations surrounding Russell index re-balancing, rather than anything involving such sophistry as today claimed the euro-zone's debt crisis was stabilizing. One big tip-off that, today's rally was largely technical in nature was the moribund Microsoft leading the way (+3.7%).


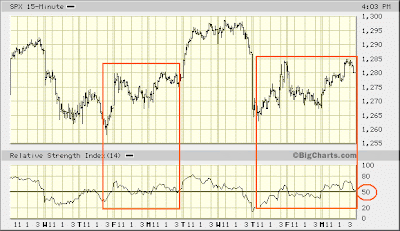
SPX 15-min

You can see where I am going with the similarity presented above. The only thing in doubt is whether a further move higher tomorrow might be premature, being that last Thursday's bottom was confirmed (to the negative) by RSI at 15-minute intervals, whereas bottom the previous Thursday (6/16) was accompanied by a [positive] relative strength divergence.

Honestly, if last Thursday's presumed capitulation is followed by what appears conviction that, weakness since May 1st has run its course — an advance leaving last Thursday's low unchallenged, without any [positive] relative strength divergence first being registered — then maybe we should start fearing the worst.


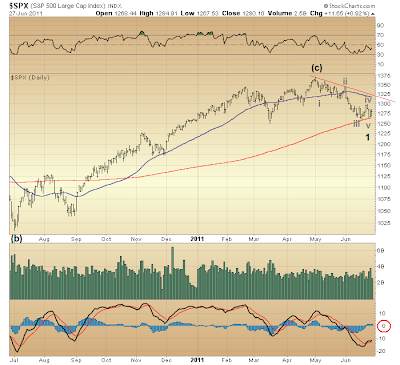
$SPX

Considering the prospect that, the market's counter-trend rally off March '09 bottom ended on May 1st with completion of wave (c), a preliminary Elliott wave count detailing the market's decline thus far might rightly find the first leg down gaining support at the 200-day moving average. Watch momentum (bottom panel) during formation of wave 2, then. It should remain on the sell-side of its range (below 0) while the market retraces some part of its initial decline off May 1st top.

With QE2 expiring, the euro-zone coming unglued and the President a sitting duck, what's there to hold the market up? With even the circus bankrupt, everyone's attention could soon turn in a direction largely unexpected, where, indeed, the President's sudden removal, one way or another, moves front and center.


Fast Money
* * * * *

© The Risk Averse Alert — Advocating a patient, disciplined approach to stock market investing. Overriding objective is limiting financial risk. Minimizing investment capital loss is a priority.

Analysis centers on the stock market's path of least resistance. Long-term, this drives a simple strategy for safely investing a 401(k) for maximum profit. Intermediate-term, investing with stock index tracking-ETFs (both their long and short varieties) is advanced. Short-term, stock index options occasionally offer extraordinary profit opportunities when the stock market is moving along its projected path.

Nothing is set in stone. Nor is the stock market's path of least resistance always known. More often than not, there are no stock index option positions recommended.


There's an easy way to boost your investment discipline...

Get Real-Time Trade Notification!
Sunday, June 26, 2011

Time Inside the Doors Waiting for the Sun


A blast from the past finds its mark in our time...


C'mon in Ann Marie.

You're dreaming if you think the occasion for debating Medicare reform can occur prior to reinstatement of Glass-Steagall. You're simply out of touch with the fact that, the trans-Atlantic banking system is at the precipice of a chain reaction collapse whose effect will call for leadership capable of saving the nation, let alone the means by which it provides quality health care. No diversion, how ever finely perfumed, will succeed in distracting from the most critical policy matter involving many trillions of worthless gambling debts about to go bust, whose unraveling will hasten a shut down of the physical economy with unprecedented speed and devastation. The echo of FDR's 1933 Inaugural Address indicting "money changers" soon will become deafening. And the likes of these Rep. Ryan proposes subsidizing even further than the President already has with his so-called healthcare "reform?" Talk about a guaranteed non-starter!

Oh look! By golly, now Italy is blowing out...


* * * * *

© The Risk Averse Alert — Advocating a patient, disciplined approach to stock market investing. Overriding objective is limiting financial risk. Minimizing investment capital loss is a priority.

Analysis centers on the stock market's path of least resistance. Long-term, this drives a simple strategy for safely investing a 401(k) for maximum profit. Intermediate-term, investing with stock index tracking-ETFs (both their long and short varieties) is advanced. Short-term, stock index options occasionally offer extraordinary profit opportunities when the stock market is moving along its projected path.

Nothing is set in stone. Nor is the stock market's path of least resistance always known. More often than not, there are no stock index option positions recommended.


There's an easy way to boost your investment discipline...

Get Real-Time Trade Notification!

Saturday, June 25, 2011

Weekly v. Daily Breadth


You might recall my claim that, animal spirits are waning. One piece of evidence bolstering this view is NASDAQ's cumulative advance-decline line whose disposition remains in a death spiral...


$NAAD cumulative

Or so it seems. Yet some question about this conclusion arises when one considers advance-decline data from a weekly perspective...


Weekly A-D

Last week's trading saw the number of advancing issues exceeding declining issues on both NASDAQ and the NYSE. Of course, this result would stand to reason on NASDAQ, as the Composite Index rose 1.39% on the week. However the NYSE Composite fell 0.32% while advancing issues nearly doubled declining issues over the course of the week.

No doubt, a weekly perspective might enrich our perspective. Trouble is a long-term chart of cumulative weekly advances-declines going back ten years is not presently at my fingertips. So, let's make do with what's available at MasterDATA (a gold mine of breadth data analysis for major indexes and ETFs).

In contrasting weekly data with daily let's consider, rather than the NASDAQ Composite, the NASDAQ 100 ... and for grins a tracking ETF, 2x leveraged at that: the ProShares Ultra QQQ.


QLD

As you can see (bottom panel), the NASDAQ 100's cumulative, daily advance-decline line has not yet exceeded its March bottom. Now, contrast this with the NASDAQ Composite's cumulative, daily advance-decline line above. Its March 2011 low has been taken out, as has its November 2010 low. File this disparity, then, under growing underlying technical weakness afflicting NASDAQ more broadly.

Yet consider the NASDAQ 100's cumulative, weekly advance-decline line (again, contrasted to the ProShares Ultra QQQ)...


QLD weekly

Very interesting. First, if you look closely, the NASDAQ 100's weekly, cumulative advance-decline line did take out its March 2011 low. So, some further indication of increasing underlying technical weakness is evidenced via NASDAQ's top 100.

Yet plain as day is the fact that, taken weekly, the NASDAQ 100's cumulative advance-decline line is solidly rising. Whether this tempers my "death spiral" thesis is uncertain (for lack of data at the moment). Probably not, considering new 52-week highs and lows data...


As you can see, at no time over the past year have the number of NASDAQ 100 issues hitting new 52-week highs exceeded readings registered going into April 2010 peak. There is no indication of broadening underlying strength propelling the market's advance, despite the weekly, cumulative advance-decline line's consistent upward expansion. So, "death spiral" or not, NASDAQ's leadership, no doubt thin, is seen narrowing.

The oscillator plotted at the center of the above chart appears another useful means of substantiating an Elliott wave count. It presents the percentage of NASDAQ 100 components in weekly uptrends (i.e. trading above 200-day moving averages). Only with this reading's recent sinking off May 2011 peak has its late-August 2010 bottom been exceeded (adding evidence revealing 4th wave versus 2nd wave technical deterioration). Likewise might this measure's relative, negative extreme suggest an approaching bottom.

There's a lot more available at MasterDATA you might find useful, particularly if you are a frequent trader. Check it out.

* * * * *

© The Risk Averse Alert — Advocating a patient, disciplined approach to stock market investing. Overriding objective is limiting financial risk. Minimizing investment capital loss is a priority.

Analysis centers on the stock market's path of least resistance. Long-term, this drives a simple strategy for safely investing a 401(k) for maximum profit. Intermediate-term, investing with stock index tracking-ETFs (both their long and short varieties) is advanced. Short-term, stock index options occasionally offer extraordinary profit opportunities when the stock market is moving along its projected path.

Nothing is set in stone. Nor is the stock market's path of least resistance always known. More often than not, there are no stock index option positions recommended.


There's an easy way to boost your investment discipline...

Get Real-Time Trade Notification!

Friday, June 24, 2011

The Lost Hope for a Hopeless Cause


Not at all was today's trading a constructive postscript to yesterday's presumed capitulation. Whether June 16th's bottom will hold is considerably in doubt.

Yet despite foreboding technical conditions more or less remaining intact, there are reasons to believe a panic will not immediately transpire. These might explain why the past two days were not as damaging as they might otherwise have been, as some reasonable measure of underlying support apparently remains in place, anticipating the market's reversal higher.


$SPX

As you can see, both relative strength (top panel) and momentum (bottom) are on the mend and, indeed, turning higher. However, both measures remain on the sell-side of their respective ranges, so by no means is it safe to say the market likely is immune to further selling extending weakness over the past two months. June 16th bottom very well might be taken out before any reversal higher commences.

Now, given the fairly rapid manner in which both waves 1 of (c) (beginning at late-June 2010 bottom) and 3 of (c) (beginning late-August) launched higher, I might have been more cautious yesterday in assuming that, Thursday, June 16th marked the end of wave 4 of (c). Yesterday's slaughter at the open (although still reasonably seen a capitulation), when considered in the context of waves 1 and 3 of (c) previously, appears a less than fitting part of any start of wave 5 of (c) higher.

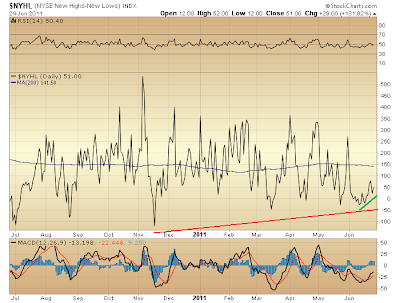
All weakness aside (including today's to end the week), if one still were to assume June 16th marked the end of wave 4 of (c), the lower channel boundary connecting wave 4 with wave 2 (see green line drawn above) was not violated either yesterday or today. So, continued weakness remains fairly well-contained, indeed, as it has for the past two months and for many months previous.


$NYHL

The fair handful of listed-issues supporting the market for as long as Benito Bernanke has been serving his QE elixir apparently remain dear to those whose sugarplum addiction will not be easily broken.

Supporting this view is Doug Noland who in today's "Red Alert" wonders "where the euro would trade today without the market perception that the Chinese are there to provide a backstop bid for European debt and the currency." He may have no doubt that, "global policymakers will act in ways to try to stabilize the system," as apparently do most sugarplum addicts, too. Yet with contagion spreading across the European continent, are not global policymakers at increasing risk of suffering a fatal vote of no confidence? Might the backstop bid more likely be soon withdrawn, if only because the euro is rapidly being perceived a hopeless cause?

* * * * *

© The Risk Averse Alert — Advocating a patient, disciplined approach to stock market investing. Overriding objective is limiting financial risk. Minimizing investment capital loss is a priority.

Analysis centers on the stock market's path of least resistance. Long-term, this drives a simple strategy for safely investing a 401(k) for maximum profit. Intermediate-term, investing with stock index tracking-ETFs (both their long and short varieties) is advanced. Short-term, stock index options occasionally offer extraordinary profit opportunities when the stock market is moving along its projected path.

Nothing is set in stone. Nor is the stock market's path of least resistance always known. More often than not, there are no stock index option positions recommended.


There's an easy way to boost your investment discipline...

Get Real-Time Trade Notification!

Thursday, June 23, 2011

Micro Capitulation, Macro Panic


Huge save today. Per technical negatives detailed here the past two days, it is well enough that, at this late hour in the game of let's pretend the banking system isn't doomed to a chain reaction collapse the fullest measure of underlying weakness is being evidenced following months and months of much the same, this as the market approaches a major turning point from which it is slated to endure the horror of discovering Adam Smith's Leveraged Ponzi Scheme is dead.


SPX 5-min

In other words, today's dive at the open rather appears a capitulation by the last of sellers for the moment.

No doubt, the setup leading into trading today was quite similar to that preceding the market's gassing on Friday, June 10th. First, was weakening relative strength as the market reached toward its peak from mid-day Tuesday through yesterday afternoon (up to the final ninety minutes of trading). Then was weakness going into yesterday's close whose result dragged relative strength to the sell-side of its range (below 50). Both these conditions likewise had developed on Thursday, June 9th.

Yet selling during yesterday's final twenty minutes produced one subtle difference from that into June 9th's close. Relative strength yesterday was decidedly more biased to the sell-side, finishing just above 20, whereas upon June 9th's close relative strength had settled only slightly below mid-range.

Yesterday's considerable imbalance of sellers going into the close followed by a still greater imbalance of sellers at today's open presents evidence that, a capitulation has transpired. This evidence is bolstered by today's recovery. Nothing quite so positively impactful on relative strength occurred on Friday, June 10th. All the more convincing is the fact that, the market settled today very near its high for the day. Not so June 10th.

So, for now Thursday, June 16th, appears to mark the end of wave 4 of (c), and the final leg of the market's advance off late-June 2010 bottom (and March '09 bottom before that) apparently is underway.

Now, how about that strategic petroleum reserve announcement today! Apparently, military vets McCain and Kerry in the Senate did not provide enough cover for the President to dodge impeachment for his so-called humanitarian intrusion in Libya that some are claiming an action in flagrant violation of the U.S. Constitution. Well, with gasoline already down to $3.83 at the pump here in these parts (whoopie!), there should be no confusing the President's humanitarian intentions with today's record SPR release, sans a crisis justifying its necessity. Lord knows (apparently Mark Fisher didn't get the message) that, with the free market rid of swindlers ever since our new and not-so-improved Richard Nixon signed Dodd-Frank into law, everyone stands to benefit with the increased supply of crude oil so magnanimously provided at a time of already considerable weakness in energy markets.

Seriously, who in their right mind thinks increasing signs of panic at the top make for stable financial markets?


Fast Money
* * * * *

© The Risk Averse Alert — Advocating a patient, disciplined approach to stock market investing. Overriding objective is limiting financial risk. Minimizing investment capital loss is a priority.

Analysis centers on the stock market's path of least resistance. Long-term, this drives a simple strategy for safely investing a 401(k) for maximum profit. Intermediate-term, investing with stock index tracking-ETFs (both their long and short varieties) is advanced. Short-term, stock index options occasionally offer extraordinary profit opportunities when the stock market is moving along its projected path.

Nothing is set in stone. Nor is the stock market's path of least resistance always known. More often than not, there are no stock index option positions recommended.


There's an easy way to boost your investment discipline...

Get Real-Time Trade Notification!

Wednesday, June 22, 2011

More Threatening Technical Warnings


The ominous technical configuration of the Volatility Index noted yesterday remained entirely intact today. Adding to concern over the possibility of a substantial sell-off upcoming are a couple other measures, both of which average the NYSE Advance-Decline differential over varied time intervals...


$NYAD

First is the NYSE Advance-Decline differential's 10-day moving average versus its 200-day moving average. Note a remarkably similar setup to October 2008. Yikes!


NYSE McClellan

Next is the NYSE McClellan Summation Index. Having declined since May 1st to the negative side of its range while the Oscillator confirmed every [lower] NYSE high and low along the way, the Summation Index's bounce to zero during the past week's rally raises prospect that, the present moment rather is a decisive one. The fact that the Summation Index now is in a position to challenge its early-July 2010 bottom reveals just how weak are the market's underpinnings, this while major indexes remain at relatively lofty levels.

Whether this sets up an imminent slaughter remains to be seen. For now it is well enough to suppose June 16th bottom likely will be challenged sometime over the next few days.

Yesterday I suggested that, currently ominous indications of further selling ahead might require altering the Elliott wave count for wave (c) from late-June 2010 bottom, such that its end might be thought reached on May 1st. There are other possibilities, as well. For example, wave 4 of (c) still could be forming. Its bottom, then, might be upcoming.


Fast Money
* * * * *

© The Risk Averse Alert — Advocating a patient, disciplined approach to stock market investing. Overriding objective is limiting financial risk. Minimizing investment capital loss is a priority.

Analysis centers on the stock market's path of least resistance. Long-term, this drives a simple strategy for safely investing a 401(k) for maximum profit. Intermediate-term, investing with stock index tracking-ETFs (both their long and short varieties) is advanced. Short-term, stock index options occasionally offer extraordinary profit opportunities when the stock market is moving along its projected path.

Nothing is set in stone. Nor is the stock market's path of least resistance always known. More often than not, there are no stock index option positions recommended.


There's an easy way to boost your investment discipline...

Get Real-Time Trade Notification!

Tuesday, June 21, 2011

Fraught With Risk


There's something going on raising concern that, the market might be on the verge of coming unglued...


$VIX

The Volatility Index's behavior over the past week or so offers a starting point from which concern builds. At first blush the spike in the VIX taking it above its 200-day moving average might be thought reflective of the greater measure of fear typical at market bottoms. Yet the configuration of both the VIX's relative strength (top panel) and momentum (bottom panel) bears striking similarity to the period just prior to the market's mid-March swoon.

The one difference with the present moment versus early March finds the VIX already above its 200-day moving average, whereas prior to the market's mid-March sell-off the VIX held below its 200-day moving average. Seeing this at a time when major indexes remain in a technically vulnerable state raises concern but further...


$SPX

Both the S&P 500's relative strength (top panel) and momentum (bottom panel) remain decidedly positioned on the sell-side of their respective ranges. Back in early-March both measures were more positively positioned on the buy-side of their respective ranges. Thus, does the present moment appear fraught with risk.

Of course, any imminent throttling of the market would force the conclusion that, wave (c) forming off late-June 2010 bottom already completed on May 1st. This possibility to date has not been considered. Yet the market's weak technical condition currently is threatening to increase this possibility's likelihood just the same.


$NYAD

June 14th's "Skyward: A Major Turning Point" noted how the NYSE Advance-Decline differential that day had registered its strongest reading since the end of wave 3 of (c) in early-November 2010. Increased buying interest this was assumed to reveal was thought indicating a floor being put under the market. However this conclusion rather was debunked the following day when the market sank to a new low for the month. Turns out the buying interest was but suckers anxious to be fleeced.

Who's to say today's assumed increase in buying interest won't prove the same?

George Papandreou? Why it rather appears another lap dog well-trained in the art of buying time has done well today...


Fast Money
* * * * *

© The Risk Averse Alert — Advocating a patient, disciplined approach to stock market investing. Overriding objective is limiting financial risk. Minimizing investment capital loss is a priority.

Analysis centers on the stock market's path of least resistance. Long-term, this drives a simple strategy for safely investing a 401(k) for maximum profit. Intermediate-term, investing with stock index tracking-ETFs (both their long and short varieties) is advanced. Short-term, stock index options occasionally offer extraordinary profit opportunities when the stock market is moving along its projected path.

Nothing is set in stone. Nor is the stock market's path of least resistance always known. More often than not, there are no stock index option positions recommended.


There's an easy way to boost your investment discipline...

Get Real-Time Trade Notification!

Monday, June 20, 2011

Upside Target on a Major Turning Point


Assuming the market's final lift higher off late-June 2010 bottom has begun (as I am), channeling guidelines as put forward in the Elliott Wave Principle provide a view toward the upside target wave 5 of (c) might likely reach...


$SPX

The channel's upper end has two parallels: one to the peak of wave 1 of (c), the other to the peak of wave 3 of (c). Were the lower parallel (i.e. to wave 1) to mark the end of wave 5 of (c), it seems wave 5 might likely unfold about as rapidly as did wave 1, and closely approximate its length.

At this early moment in supposed formation of wave 5 of (c) at the top of my list is the possibility that, a major turn in the market might be but some days away, as the just mentioned scenario suggests. The first point of curiosity on the way, then, will be the 50-day moving average, as was noted last week.


SPX 1-hr

RSI's constructive configuration noted Friday became only the more so today. Last Thursday's bottom appears all the more solid as a consequence.

The ultimate end of what I have labeled in marking the ongoing correction of last week's lift off bottom is supposing enough underlying technical weakness across the broad market for this correction to persist another day or two. Last week's NASDAQ 100 performance, in fact, is seen raising this possibility...


NDX 5-min

Quite simply, the RSI extreme reached at last Thursday's bottom raises prospect that, NDX bottom might not yet be in. Minimally, a retest of Thursday's low accompanied by RSI divergence could develop over the next couple days, keeping a lid on seeming prospects for a decided move higher at present.

Yet by several technical measures there is a growing case for supposing the market is about to trace its final advance, at last, in counter-trend rally off late-June 2010 bottom (and March '09 bottom before that), and soon reach a major turning point from which collapse could rapidly develop.


Fast Money
* * * * *

© The Risk Averse Alert — Advocating a patient, disciplined approach to stock market investing. Overriding objective is limiting financial risk. Minimizing investment capital loss is a priority.

Analysis centers on the stock market's path of least resistance. Long-term, this drives a simple strategy for safely investing a 401(k) for maximum profit. Intermediate-term, investing with stock index tracking-ETFs (both their long and short varieties) is advanced. Short-term, stock index options occasionally offer extraordinary profit opportunities when the stock market is moving along its projected path.

Nothing is set in stone. Nor is the stock market's path of least resistance always known. More often than not, there are no stock index option positions recommended.


There's an easy way to boost your investment discipline...

Get Real-Time Trade Notification!
Friday, June 17, 2011

Whether War or Glass-Steagall


Hmmm. Apparently, prior to the inception of the euro currency Martin Feldstein warned that any future breakup of the EMU could lead to war on the continent...


Well, then, judging by the virtual inevitability of the breakup of the euro-zone, could one conclude war, indeed, might have been intended from the very beginning?

This question becomes all the more relevant when you consider it in light of calls to make a horrible example of Greece. A lurid proposal, no doubt, demonstrating a mind of questionable sanity, as well. For how much more loudly might those being targeted for destruction be inspired to chant the phrase "Due Diligence" in expanded protest? Funny how it didn't take long for the man who calls Europe's problems "overblown" to present the context in which his conclusion is made: from the distorted view of an imperial monetarist whose sophistry is incapable of fathoming the human consequence of reckless policies put in place over recent decades, which understanding otherwise might shatter belief in such financial alchemy as has brought the world to this most dangerous place.

Truth is the present bankruptcy of the euro-zone, and the trans-Atlantic financial system more generally, cannot be resolved without proper identification of the utter failings of financiers and regulators whose lack of due diligence played the largest part in creating today's systemic crisis. Those, like David Goldman, who believe this inconvenient truth can be swept under the rug while calling for a more brutal response in defense of the indefensible are no less suffering a delusional fantasy than were those in Congress who last year delivered "the most sweeping financial reform since the Great Depression."

The looming question on the chessboard rather simply is whether war or Glass-Steagall will prevail. Either way, for Adam Smith's Leveraged Ponzi Scheme it's game over — checkmate. With each new day, it seems, the probability of a major market turning point being at hand finds no shortage of aligned constellations making a financial calamity appear virtually inevitable.


$BPNYA

No doubt, a growing sense of trouble ahead might be seen behind the shrinking portion of NYSE-listed issues whose point-and-figure charts are bullish. Yet the fact this is occurring despite the NYSE Composite still holding up rather well likewise delivers a subtle message revealing that, but a handful of issues are sustaining the market's levitation.

The importance of this observation is twofold. First, it suggests the market still could have legs. Its further levitation evidently does not require broad participation. More ominously, though, it reveals any future attack on today's thin leadership could prove nothing short of devastating.


$NYHL

The differential of NYSE new 52-week highs and lows presents further evidence that, the market's leadership remains intact. Thus, does the path appear clear for wave 5 of (c) ahead.

Of course, this conclusion does not alter the fact that, this very same technical measure over the past year has done nothing but confirm how very thin has been the market's leadership over the duration. Expect this glaring disparity to persist with the market's final lurch higher upcoming.


SPX 1-hr

There's a case for claiming wave 5 of (c) has begun. Anticipated relative strength divergences registering this week as the market fell nominally lower have been followed by today's healthy relative strength configuration coinciding with correction of the market's initial lift off bottom. A decisive burst higher probably will not be much delayed. Further confirmed, then, will appear prospects a major turn is close at hand.

* * * * *

© The Risk Averse Alert — Advocating a patient, disciplined approach to stock market investing. Overriding objective is limiting financial risk. Minimizing investment capital loss is a priority.

Analysis centers on the stock market's path of least resistance. Long-term, this drives a simple strategy for safely investing a 401(k) for maximum profit. Intermediate-term, investing with stock index tracking-ETFs (both their long and short varieties) is advanced. Short-term, stock index options occasionally offer extraordinary profit opportunities when the stock market is moving along its projected path.

Nothing is set in stone. Nor is the stock market's path of least resistance always known. More often than not, there are no stock index option positions recommended.


There's an easy way to boost your investment discipline...

Get Real-Time Trade Notification!