Wednesday, September 30, 2009

Briefly on a Brief Period


Apparently, four days does not "a brief period of sideways trading" make. So, a day or two more ... before ... stocks fall through the floor it appears.


Fast Money
* * * * *

© The Risk Averse Alert — Advocating a patient, disciplined approach to stock market investing. Overriding objective is limiting financial risk. Minimizing investment capital loss is a priority.

Analysis centers on the stock market's path of least resistance. Long-term, this drives a simple strategy for safely investing a 401(k) for maximum profit. Intermediate-term, investing with stock index tracking-ETFs (both their long and short varieties) is advanced. Short-term, stock index options occasionally offer extraordinary profit opportunities when the stock market is moving along its projected path.

Nothing is set in stone. Nor is the stock market's path of least resistance always known. More often than not, there are no stock index option positions recommended.


There's an easy way to boost your investment discipline...

Get Real-Time Trade Notification!

Tuesday, September 29, 2009

Could October Fest Bring A 200-Day Test?


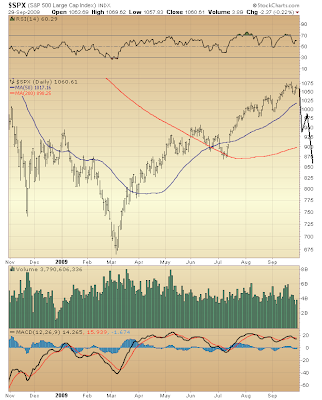
There sure is good reason still to fear more selling yet to come. In fact, October might turn interesting. And you can't throw out the possibility 200-day moving averages could be challenged.


$SPX

Supporting probability more selling looms are both NYSE and NASDAQ McClellan Oscillators ... each positioned on the sell-side of their respective balances ... this, following an extended period weakening — diverging from indexes in their persistent climb higher off March bottom.

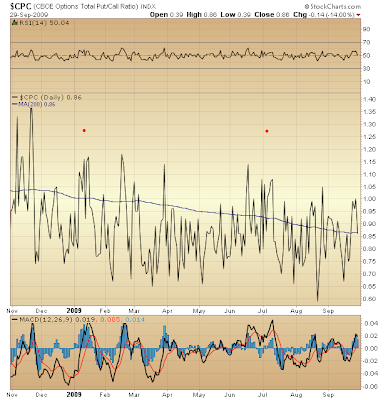
The CBOE Put/Call Ratio also appears positioned in a potentially foreboding way...


$CPC

The ratio's present position relative to its 200-day moving average has a couple noteworthy precedents this year. So, the message is beware.

Regarding five waves down as shown on the above S&P 500 chart ... this would be just grand from an Elliott Wave perspective ... because the mystery in what subsequently could lie ahead, surely, would only thicken ... and isn't that rather both typical and fitting.


Fast Money
* * * * *

© The Risk Averse Alert — Advocating a patient, disciplined approach to stock market investing. Overriding objective is limiting financial risk. Minimizing investment capital loss is a priority.

Analysis centers on the stock market's path of least resistance. Long-term, this drives a simple strategy for safely investing a 401(k) for maximum profit. Intermediate-term, investing with stock index tracking-ETFs (both their long and short varieties) is advanced. Short-term, stock index options occasionally offer extraordinary profit opportunities when the stock market is moving along its projected path.

Nothing is set in stone. Nor is the stock market's path of least resistance always known. More often than not, there are no stock index option positions recommended.


There's an easy way to boost your investment discipline...

Get Real-Time Trade Notification!

Monday, September 28, 2009

One Eye on Hedge Funds Seen Through a Yawn


Zzzzz. Zzzzz. Zzzzz. Oh! Is it over? So many mergers and so little carry-on speculative interest targeting similarly situated companies. Volume today was pathetic.

Could this possibly indicate weak hands (a.k.a. "suckers") even populate those corporate boards seeing "bargains" at a time when, in fact, the case for cash remaining king for as far as the eye can see is rather compelling?


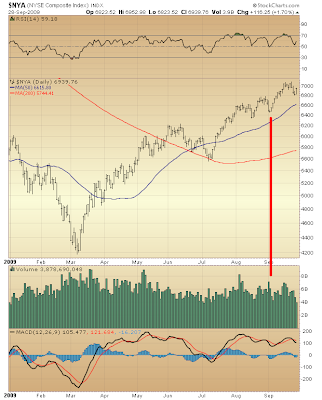
$NYA

All things mentioned Friday suggesting further selling straight ahead are relegated questionable by similar technical conditions as exist now likewise existing early-September. Thus, reluctance to claim top is in.

Nevertheless, the coordinated role of bankrupt European and American interests in buying time to offload worthless assets with help of a prolific media whose intelligence value these days struggles to top Sesame Street, while at the same time physical economy continues its collapse, must be gaining notice in circles seeking to exploit the profound vulnerability of those presently seeking benefit, come hook or crook.

Now, just how such exploitation might be run is rather a mystery. My gut feeling is certain select, ill-positioned hedge funds somehow could be hung out to dry. This, after all, was how the present bear market was initiated, when at considerable expense to most, if not all, Americans two Bear Stearns hedge funds were attacked for the benefit of a select, British-connected enterprise...


Fast Money
* * * * *

© The Risk Averse Alert — Advocating a patient, disciplined approach to stock market investing. Overriding objective is limiting financial risk. Minimizing investment capital loss is a priority.

Analysis centers on the stock market's path of least resistance. Long-term, this drives a simple strategy for safely investing a 401(k) for maximum profit. Intermediate-term, investing with stock index tracking-ETFs (both their long and short varieties) is advanced. Short-term, stock index options occasionally offer extraordinary profit opportunities when the stock market is moving along its projected path.

Nothing is set in stone. Nor is the stock market's path of least resistance always known. More often than not, there are no stock index option positions recommended.


There's an easy way to boost your investment discipline...

Get Real-Time Trade Notification!

Friday, September 25, 2009

Was It Top or Is It Topping?


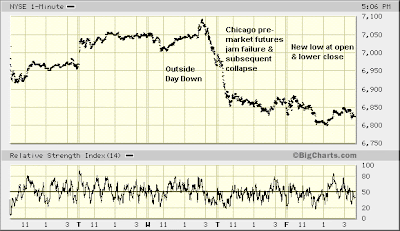
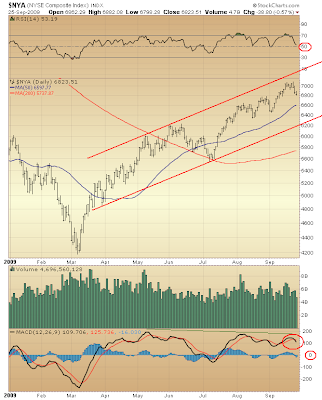
Moving from prior days' perspective viewing stock market history over the past forty-to-one-hundred-plus years let's consider how this week's trading, seen minute by minute following Federal Reserve confirmation that, yep, the financial system still is dead, supports the probability top to the counter-trend rally off March '09 bottom is in.


NYSE 1-min

Comments on the above NYSE Composite chart summarizing each day, Wednesday through Friday, indicate why, with each day building upon the previous, further selling likely lies ahead.


$NYA

Momentum's negative turn (see MACD) likewise supports the case for further selling straight ahead, although a brief period of sideways trading might precede this, too, much as today is seen.

Further confirming this view projecting more selling yet to come is Thursday's volume increase over Wednesday's, as well as today's, "consolidation-like," volume contraction.

This, however, is about as far as one really ought be willing to go with one's belief top might be in. Given underlying technical conditions still positioned on the buy-side of respective balances — and we have seen this for many months now, despite persistent deterioration — there's no point pounding the table when Elliott wave-related considerations allow still higher highs in the formation of the present counter-trend rally off March '09 bottom.


Fast Money
* * * * *

© The Risk Averse Alert — Advocating a patient, disciplined approach to stock market investing. Overriding objective is limiting financial risk. Minimizing investment capital loss is a priority.

Analysis centers on the stock market's path of least resistance. Long-term, this drives a simple strategy for safely investing a 401(k) for maximum profit. Intermediate-term, investing with stock index tracking-ETFs (both their long and short varieties) is advanced. Short-term, stock index options occasionally offer extraordinary profit opportunities when the stock market is moving along its projected path.

Nothing is set in stone. Nor is the stock market's path of least resistance always known. More often than not, there are no stock index option positions recommended.


There's an easy way to boost your investment discipline...

Get Real-Time Trade Notification!

Thursday, September 24, 2009

Bowling for NASDAQ: Striking Out for a Perfect Game


Let me tie together two thoughts presented this week. I'd like to answer the question, if the NASDAQ Composite were to fall to levels last seen in 1987 sometime over the next 1-3 years, what objective might the Dow Industrials reach (and similarly the S&P 500)?

My reason for asking is because yesterday's shocking NASDAQ forecast might appear out of line with Tuesday's Dow Jones Industrials' long-term RSI analysis. This seeming disparity, though, is easily resolved simply applying an alternate Elliott wave count to the Dow Industrials.
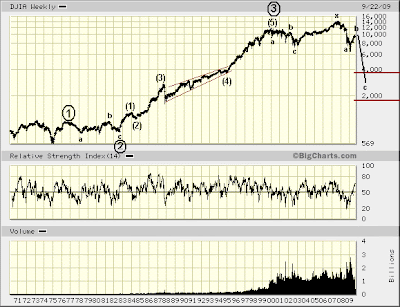

DJIA weekly

Rather than supposing wave 4 of five waves down from October '07 has been forming since November '08, wave B of an A-B-C down from October '07 is seen instead.

Due up next, then, is wave C, whose pending decline — rather, more likely, collapse — would fit both current NASDAQ forecast prospects, as well as Elliott Wave Principle guidelines.

Were the Dow Industrials since topping January 2000 seen forming a 4th wave [of 5 waves up since 1974], then the EWP suggests the target for this 4th wave is the range of the fourth wave of one lesser degree. This projects a price level for the Dow 30 somewhere between where it traded from 1987-1994. That's ballpark 1700-3600. A rather wide range, no doubt. Yet much lower than presently either way.

The Dow's currently forming 4th wave alternates in complexity with its 2nd wave (1975-1982), thus satisfying the Elliott Wave Principle's "rule of alternation."

And considering the very long-term Dow Jones Industrials trend ... over the next couple years the Dow could fall well below 3600 yet still remain solidly in an uptrend.

Were a collapse forthcoming, it is likely NASDAQ's trend leadership role would continue. In other words, the NASDAQ Composite probably will be drained far more deeply than the Dow 30 once ultimate bottom to the present, negative, intermediate-term trend (starting October '07) is reached. So, although levels last seen following the 1987 stock market crash could be $COMPQ's fortune, $INDU could fare considerably better. How much so, practically speaking, probably will amount to only a slightly lighter shade of despair for most investors, however.

Finally, there is nothing saying the stock market's collapse is imminent. In fact, there's a better case to be made that, a period during which underlying weakness builds likely will first develop before rightful expectations for imminent collapse are reasonably entertained. Wasn't this one lesson of 2008?

Thus, we return to the important, psychological matter of defending March '09 bottom, because a failure of this bottom implies a failure of the lender of last resort in stabilizing a broke down Ponzi scheme. So, it seems most reasonable, then, that near-term support be expected at March '09 lows.

With this in mind we are wise to be on the lookout for price action extending the formation of what I labeled above as wave B, unfolding since November '08. There's nothing saying major indexes cannot trade sideways (in a very wide range, percentage-wise) for another year or more before finally collapsing.

No doubt, major indexes have bounced about as far as was thought possible many months ago. Nevertheless inquiring minds want to know: is top to this move in? Maybe yes, maybe no. Maybe underlying technical weakness must grow further before one can confidently claim top has been reached, though.

Still, no matter, wave B's completion might further await 3-waves down, testing March '09 support (or possibly smashing right through it), followed by 5-waves up ... or some other Elliott corrective wave variation.

Similarly, there's nothing saying that, following NASDAQ's reaction back up to its head-and-shoulders neckline, its subsequent decline to its minimal objective likely will occur with haste. Indeed, there is every reason to anticipate resistance toward this inevitable trend lower, allowing as many suckers as possible to be put in position for ultimate abuse once the lug nuts finally come off. So, here too, we have reason to look forward to collapse without supposing it is imminent.

By the way ... being that levels last seen in 1987 are the objective portended by NASDAQ's head-and-shoulders top ... this targets the vicinity of 300 in $COMPQ.

Preposterous you say?

No, preposterous is believing a mountain of unproductive debt built up over decades while physical economy was allowed to shrivel away can possibly be sustained indefinitely.


Fast Money
* * * * *

© The Risk Averse Alert — Advocating a patient, disciplined approach to stock market investing. Overriding objective is limiting financial risk. Minimizing investment capital loss is a priority.

Analysis centers on the stock market's path of least resistance. Long-term, this drives a simple strategy for safely investing a 401(k) for maximum profit. Intermediate-term, investing with stock index tracking-ETFs (both their long and short varieties) is advanced. Short-term, stock index options occasionally offer extraordinary profit opportunities when the stock market is moving along its projected path.

Nothing is set in stone. Nor is the stock market's path of least resistance always known. More often than not, there are no stock index option positions recommended.


There's an easy way to boost your investment discipline...

Get Real-Time Trade Notification!

Wednesday, September 23, 2009

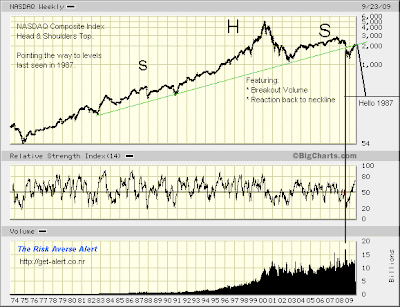
The Great NASDAQ Head and Shoulders Top


Well, will you look at this...


NASDAQ weekly

Is this possible is not the question. It is.

A head-and-shoulders top is a pattern associated with "distribution." And could trading on NASDAQ this past decade be better summarized?

Clincher, though, is most recent action...
  • A volume spike accompanying the downside break of the head-and-shoulders neckline.
  • The reaction back up to the neckline.
All textbook. And going by this same book, the minimal objective of NASDAQ's head-and-shoulders top targets the vicinity of levels last seen in 1987. The only thing I cannot tell you is what will become of the wireless internet revolution over the interim.

So, there it is, the great NASDAQ head-and-shoulders top ... staring everyone right in the face ... bringing new meaning to the adage, it's not the face you f^@%, but the f^@% you face.


Fast Money
* * * * *

© The Risk Averse Alert — Advocating a patient, disciplined approach to stock market investing. Overriding objective is limiting financial risk. Minimizing investment capital loss is a priority.

Analysis centers on the stock market's path of least resistance. Long-term, this drives a simple strategy for safely investing a 401(k) for maximum profit. Intermediate-term, investing with stock index tracking-ETFs (both their long and short varieties) is advanced. Short-term, stock index options occasionally offer extraordinary profit opportunities when the stock market is moving along its projected path.

Nothing is set in stone. Nor is the stock market's path of least resistance always known. More often than not, there are no stock index option positions recommended.


There's an easy way to boost your investment discipline...

Get Real-Time Trade Notification!

Tuesday, September 22, 2009

Levitating Dead Money


Speaking of levitating, following yesterday's options-given sense looking ahead, near-term, expecting just that...


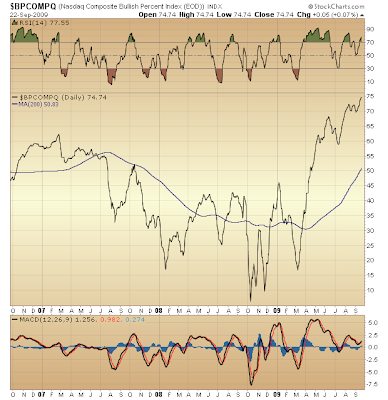
$BPNYA

The percentage of NYSE-listed stocks with bullish point and figure charts is ... off the charts.


$BPCOMPQ

Ditto NASDAQ.

I see nothing bullish about this. To my way of viewing things what's being demonstrated is such fearlessness one might rightly expect just prior to spectacular collapse.

Were there contrarily some degree of trepidation reflected via a more subdued balance in these measures, this year versus last, I might not be so confidently bearish. Yet it appears the world is so cocksure the worst is behind us that, there's more bullish interest in stocks now than was the case at the top in 2007!

Furthermore, viewing the performance of these measures in relation to the market's advance off March bottom — that is, the relative shallowness of it seen in contrast to the prior decline — one is left thinking something is not right with the picture. Indeed, this is a conclusion reaching even the stock market's leading issues...


DJIA weekly

Find me an instance in the past forty years when relative strength had rebounded so spectacularly and exceeded a prior reading, this while the Dow Industrials traded lower than was the case at that prior time. For example, consider the situation now versus May '08, then find an instance when something similar developed. Good luck.

Here, too, we see another long-term relative strength picture whose every indication suggests trouble ahead.

One thing about this relative strength picture yet before mentioned intersects the manner in which I use RSI to help confirm an Elliott 5-wave sequence. Observe how the price-RSI relationship now versus May '08 leaves open the possibility that, presently, a 4th wave [of five waves down from October '07] is forming. This suggests the end of the trend since October '07 lies straight ahead, following the upcoming 5th wave whose downside price action might be rather devastating.

This possibility is in keeping with a view put forward in May. So, now, RSI seemingly raises the greater likelihood of this possibility.

Bear in mind, too, even were this to play out and a [much lower] "bottom" to form over months ahead, present index levels might be the best seen for many years to come. Unlike what has been the case off March '09 bottom, a period during which a floor is built under stock prices likely would develop, and this, of course, will require time during which relatively little improvement will appear in the stock market, at least on the surface. The situation "under the covers," however, should markedly improve — much as was the case from July 2002 - March 2003 — with a measure of underlying fear likewise remaining present, even after the floor is built.

Thus, you see why, looking out years ahead, I dare call equity "dead money." Of course, there is nothing set in stone about this view. Yet I must say that, its technical substantiation is rather compelling. Wouldn't you agree?


Fast Money
* * * * *

© The Risk Averse Alert — Advocating a patient, disciplined approach to stock market investing. Overriding objective is limiting financial risk. Minimizing investment capital loss is a priority.

Analysis centers on the stock market's path of least resistance. Long-term, this drives a simple strategy for safely investing a 401(k) for maximum profit. Intermediate-term, investing with stock index tracking-ETFs (both their long and short varieties) is advanced. Short-term, stock index options occasionally offer extraordinary profit opportunities when the stock market is moving along its projected path.

Nothing is set in stone. Nor is the stock market's path of least resistance always known. More often than not, there are no stock index option positions recommended.


There's an easy way to boost your investment discipline...
Get Real-Time Trade Notification!

Monday, September 21, 2009

Reading the Options Open Interest Tea Leaves


Well, we just might be getting a clue of what to expect straight ahead now that the September options contract is off the board and the front month moves to October. Lots o' OEX Put contracts opened last week ... speculating on the prospect of sudden death. How do I know this? Well, yet again a new front month begins with OEX Call open interest exceeding Put open interest (this after going out September with 60k more Puts than Calls). That's how.

What, then, does last week's OEX options trade hint?

How about an increased likelihood that, the market will remain levitated in some fashion facilitating the collection of premiums on bets the market will fall? After all, September and October historically are the stock market's worst months.

So, what might this mean per the Elliott wave count?

Nothing. In levitating we could see unfold some form of a rising wedge — a formation appearing in the fifth and final wave in a five wave sequence.

The question is, in which fifth wave might this rising wedge form? The one that began early-July (wave 5 [of C]), or early-September (wave v of 5 [of C])?

Either way, it is entirely reasonable to expect some near-term pressure — something to excite the bear camp and help extract Put premium as the October contract ages.


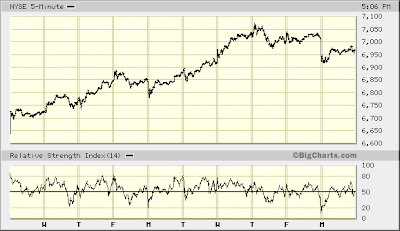
NYSE 5-min

One significant difference today versus last Monday was the failure to reverse the negative effects of that relatively thinner offering of shares put up for sale at today's open. It appears suckers were a little less willing today to bid the "bargains" and so, might require steeper bargains still.

The sell-side imbalance at the open was a bit of an eye-opener. On one hand, such relative strength damage on so little selling, relatively speaking (see today's volume), is a bad omen if you are of the bullish persuasion. Yet with the urgency to sell seemingly evaporating once again following today's open, those of the bearish persuasion, like me, ought recognize that, the ongoing distribution of equity from strong hands to weak looks to persist for as long as can be, right up until such time as it becomes unavoidable to dump long positions with abandon.

And as sure as the physical economy possesses even less capacity today than last year to operate at a profit ... and as sure as the mountain of financial claims against this shrinking capacity has only grown larger ... that moment will arrive none too soon, no doubt.


Fast Money
* * * * *

© The Risk Averse Alert — Advocating a patient, disciplined approach to stock market investing. Overriding objective is limiting financial risk. Minimizing investment capital loss is a priority.

Analysis centers on the stock market's path of least resistance. Long-term, this drives a simple strategy for safely investing a 401(k) for maximum profit. Intermediate-term, investing with stock index tracking-ETFs (both their long and short varieties) is advanced. Short-term, stock index options occasionally offer extraordinary profit opportunities when the stock market is moving along its projected path.

Nothing is set in stone. Nor is the stock market's path of least resistance always known. More often than not, there are no stock index option positions recommended.


There's an easy way to boost your investment discipline...
Get Real-Time Trade Notification!

Friday, September 18, 2009

Still a Ticking Time Bomb


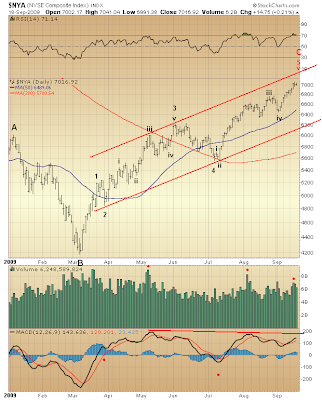
This week's continuation of last week's push to new highs, post-March bottom, just might diminish the likelihood of last week's NYSE Composite Index Elliott wave count. Thus, resumption of the bearish trend that began October 2007 now appears more imminent.

We are right back to the original view ... where wave 5 of C, unfolding since early-July, is seen nearing completion. Then, once done, kaboom. Major indexes easily could challenge respective March '09 lows before year's end, too.


$NYA

Again, both RSI and MACD degradation, wave 4 versus wave 2 [of C], are typical of a 5-wave Elliott Wave formation. Likewise, nothing about the underlying technical configuration coincident with wave 5 of C's unfolding challenges this particular Elliott wave count. Indeed, across the board the technicals confirm this view without one shred of doubt.

Judging by volume registered this week, the third wave of wave v of 5 of C is in, with only the fourth and fifth waves of wave v of 5 of C still to come. There is not much upside remaining. Time to shed dead equity at prices that might not be seen again for years to come is running short, indeed.


Fast Money
* * * * *

© The Risk Averse Alert — Advocating a patient, disciplined approach to stock market investing. Overriding objective is limiting financial risk. Minimizing investment capital loss is a priority.

Analysis centers on the stock market's path of least resistance. Long-term, this drives a simple strategy for safely investing a 401(k) for maximum profit. Intermediate-term, investing with stock index tracking-ETFs (both their long and short varieties) is advanced. Short-term, stock index options occasionally offer extraordinary profit opportunities when the stock market is moving along its projected path.

Nothing is set in stone. Nor is the stock market's path of least resistance always known. More often than not, there are no stock index option positions recommended.


There's an easy way to boost your investment discipline...
Get Real-Time Trade Notification!

Thursday, September 17, 2009

As Fine a Day as Any for a Top


A thought adding to yesterday's NEoWave discussion...

It is entirely within the realm of possibility that over the next 6-9 months (or even longer) major indexes could trade within respective ranges established thus far this year. As such, then, the spirit of Glenn Neely's outlook might appear coming to fruition. Yet, no matter, collapse at some point following in all probability will continue being a threat.

This view, of course, is Elliott Wave-based and assumes the accelerating breakdown of the global physical economy will proceed more or less unchecked. Still, just how this breakdown progresses and leads to the point of precipitating a financial panic is impossible to say. So, just how prospective, upcoming, range-bound trading might be labeled using the framework set forth in the Elliott Wave Principle is uncertain, and may not be reasonably known until well after March '09 low has been violated.


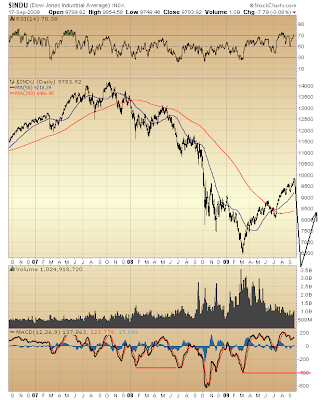
$INDU

Confirmation of spectacular collapse pending awaits some similar form of momentum deterioration such as was evidenced last year, July versus January (see MACD). Again, this development could happen before the end of the year.

Per the prerequisite need for a top to the current counter-trend rally, nothing in my collection of technical mumbo jumbo suggests top could not possibly be at hand. Quite the contrary. Yet how many months already has this been true?(!) Still, nothing is challenging the viability of a technically-based conclusion suggesting a turn for the worst might be imminent. Nothing.


Fast Money
* * * * *

© The Risk Averse Alert — Advocating a patient, disciplined approach to stock market investing. Overriding objective is limiting financial risk. Minimizing investment capital loss is a priority.

Analysis centers on the stock market's path of least resistance. Long-term, this drives a simple strategy for safely investing a 401(k) for maximum profit. Intermediate-term, investing with stock index tracking-ETFs (both their long and short varieties) is advanced. Short-term, stock index options occasionally offer extraordinary profit opportunities when the stock market is moving along its projected path.

Nothing is set in stone. Nor is the stock market's path of least resistance always known. More often than not, there are no stock index option positions recommended.


There's an easy way to boost your investment discipline...
Get Real-Time Trade Notification!

Wednesday, September 16, 2009

The Big Lie


Hey, do you remember CEO Alan Schwartz's CNBC interview two days before his firm, Bear Stearns, was vaporized and absorbed into JP Morgan-Chase for a song? Would you agree he was doing what he had to, despite reality?

Then, tell me. How is Ben Bernanke's talk of near-certain "recovery" rightly seen in the face of more negative news than one can shake a stick at? With tax revenues collapsing in the face of exploding federal liabilities backing a bankrupt financial system, what else would Mr. Bernanke say?

Anyway...

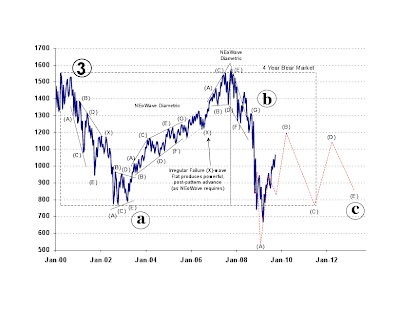
I received something interesting today, originating from the desk of Glenn Neely at NEoWave (thanks again for forwarding this, Bernie)...
In January 2008, I warned customers and the public that a massive, new bear market was underway. That bear market unfolded almost exactly as originally predicted on both a price and time basis. It seemed almost impossible, at the time, the U.S. stock market would experience a 50%+ decline in less than a year, but that was what NEoWave theory told me and that is what occurred.

As I have said many times in the past, as a market moves toward the center of a large, complex corrective formation, predictability becomes more and more difficult. It usually reaches the point where you can;t predict what will occur next, confusion is high, inaccurate forecasts are common, everyone is looking for answers (when few are possible) and a level of public agitation or irritation is obvious.

That point of confusion is exactly where the S&P is right now. After a year of extremely accurate market forecasts (I was in Timer Digest's Top 10 repeatedly the last 12 months), the S&P is now in the dead center of a 15-20 year, complex correction that began September 2000. Until the S&P moves far from this part of its structure, I will (at best) be able to predict general market direction, but not specific day-to-day behavior. This same phenomenon occurred from 2004 to 2006 when I knew a "bull market" was underway, but I could not predict, with wave theory, exactly how it would unfold.

The continuing rally in the S&P has forced me to reconsider the design of the bear market from January 2008. Initially, I thought it would be a complex correction that pushed to new lows at least once more before the lowest point of this 20 year bear market was reached. But, recent action brings into question that assumption and raises new possibilities. For that reason, I went back to my S&P archives and looked up the various scenarios I originally created for the 4+ year bear market starting January 2008. Attached is one of those scenarios that still explains the past, fits current evidence and explains the magnitude of the rally off 2009's low. If correct, the 2008 to 2012+ time frame is a contracting Triangle that will eventually end much higher than 2009's low. It also means 2009's low will not be broken for the next 50 years!

This feels eerily like my call in 1988, just 8 months after the 1987 crash low, when I was the only wave analyst in the world predicting 1987's low would never be broken for the rest of my life. The count attached to this email is not yet my "official" wave count, but it is quickly becoming a serious choice. Over the next few weeks it should become more obvious the path this phase of the 20-year bear market will follow.

Enjoy,
Glenn Neely
NEoWave, Inc.

Here's Neely's attachment...


NEoWave

I know nothing about NEoWave. Yet I do have a certain, rational reaction to Neely's remarks.

I similarly perceive how the S&P 500 is at a point where it seems things other than what have long been projected here might develop. However, I am not yet even close to fearing an alternate Elliott Wave count might soon become necessary. To my way of viewing the stock market's present technical condition, everything one might expect seeing line up prior to collapse is being evidenced. That the advance off March bottom is being extended to its ultimate maximum only alerts me all the more to the greater possibility of spectacular collapse.

Indeed, that a long-time bear like Glenn Neely is suddenly more reserved might best be seen a contrary indicator. I wouldn't say he is throwing in the towel, but he is possibly setting himself up for missing some substantial part of the coming collapse. Things right now in fact might be so precarious that a "perfect storm" seemingly developing out of nowhere could crop up and virtually overnight precipitate an historic gap lower in major stock indexes. Let me put it this way. The odds of London being leveled probably are better than the odds of Bernanke's "recovery."

And learning that Neely, a long-time bear, believes the 1987 lows will not be taken out in his lifetime alerts me to the possibility the 1974 lows might be the levels to which major indexes are about to fall over the next few years ... if not weeks.

Like I said, I know nothing about NEoWave, so I am not qualified to deliver critical commentary on the methodology by which Neely comes to his conclusions. However, I do know the Elliott Wave Principle. And though nothing ever is set in stone, even given finite possibilities, it is easy enough to develop a forecast and over time continuously assess its probability.

So, having been there and done that, there's absolutely no reason to tone down my fear of collapse. Not one thing changed today.

If in fact equity is dead money as I claim, then it stands to reason some time would be necessary for strong hands to trim their exposure. It also stands to reason these same strong hands will be careful not to upset the applecart. Indeed, this would go a long way toward explaining a rather glaring disparity resulting from the recent crisis...


Fast Money
* * * * *

© The Risk Averse Alert — Advocating a patient, disciplined approach to stock market investing. Overriding objective is limiting financial risk. Minimizing investment capital loss is a priority.

Analysis centers on the stock market's path of least resistance. Long-term, this drives a simple strategy for safely investing a 401(k) for maximum profit. Intermediate-term, investing with stock index tracking-ETFs (both their long and short varieties) is advanced. Short-term, stock index options occasionally offer extraordinary profit opportunities when the stock market is moving along its projected path.

Nothing is set in stone. Nor is the stock market's path of least resistance always known. More often than not, there are no stock index option positions recommended.


There's an easy way to boost your investment discipline...

Get Real-Time Trade Notification!

Tuesday, September 15, 2009

Draining Capital From a Dead Asset Class


Yesterday, one piece of the not-so-mysterious financial puzzle was presented in a picture showing seemingly boundless faith in the asset class called equity — this by the NASDAQ Composite's spectacular rally off March '09 bottom.

However, not shown yesterday was a review of the incredibly thin participation behind $COMPQ's advance...


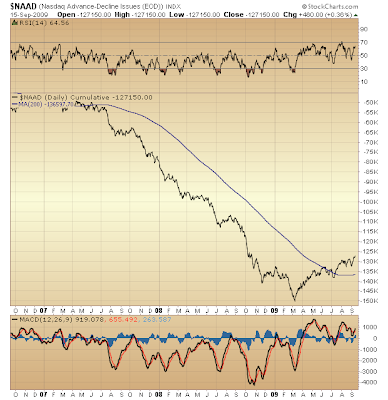
$NAAD cumulative

To my way of thinking NASDAQ's cumulative advance-decline line reveals most issues listed on NASDAQ remain in a death spiral. Therefore, that relatively few issues are behind $COMPQ's meteoric ascent again speaks for the post-March '09 advance being but a counter-trend rally, rather than the start of a new bull market. Indeed, the very lack of broad participation on NASDAQ is seen the kiss of death still coming.

The exchange I affectionately call the "Pump and Dump" continues earning this moniker, and you don't need to take my word for it. Just look what $COMPQ has done since March bottom and see what's backing this move.

Now, step back and think about the underlying psychology driving this. There's boundless belief in the asset class called equity as the still dead majority trading on NASDAQ are held in hope they too might join the freak show minority driving $COMPQ's advance off March bottom.


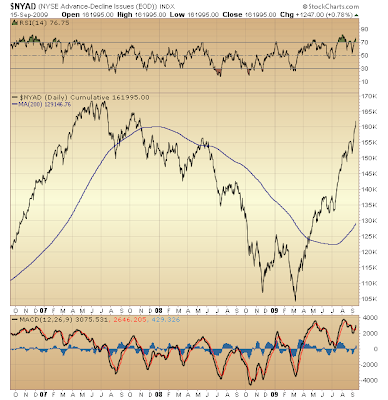
$NYAD cumulative

Now, judging by the cumulative advance-decline line of issues trading on the NYSE, $NYA might be thought trading north of where it stood in May '08! However, nothing could be further from the truth...


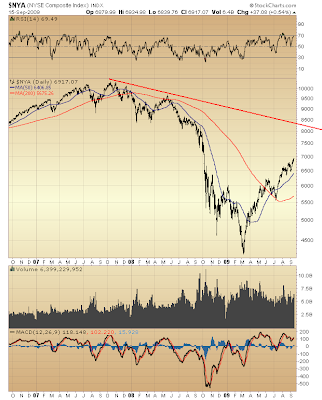
$NYA

Unlike $COMPQ, which has risen to and slightly through its downwardly sloping, intermediate-term trend line, $NYA remains far below its same trend line. This is rather odd, don't you think, given the seemingly broad participation of advancing issues on the NYSE?

No doubt, though, the NYSE cumulative advance-decline line reveals the character an Elliott Wave guy would associate with either a 2nd wave of 5 waves down (where underlying measures are performing better than they were before wave 1 of 5 down unfolded), or a B wave of 3 waves down (where the analyst might conclude "something's not right" with composite developments coincident with the bounce).

The ease with which smart money can fool the masses who fail to see in the big picture how capital is being drained from the stock market is the message to be gained here. Were this not so, then, given underlying participation, one might think $NYA would be trading much higher. But there it is, significantly lagging the much more narrowly supported NASDAQ Composite Index ($COMPQ). This performance disparity is substantively not unlike July-August 2008 before Wall Street came unglued.


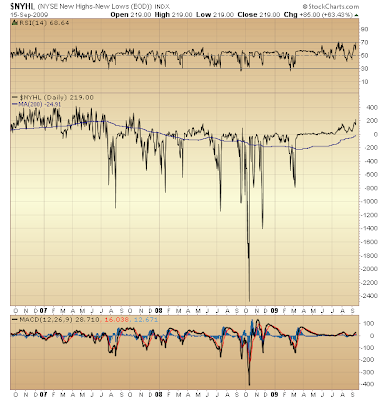
$NYHL

And that relative conditions still look a lot like May '08 is no small consolation to this unrequited bear...


Fast Money
* * * * *

© The Risk Averse Alert — Advocating a patient, disciplined approach to stock market investing. Overriding objective is limiting financial risk. Minimizing investment capital loss is a priority.

Analysis centers on the stock market's path of least resistance. Long-term, this drives a simple strategy for safely investing a 401(k) for maximum profit. Intermediate-term, investing with stock index tracking-ETFs (both their long and short varieties) is advanced. Short-term, stock index options occasionally offer extraordinary profit opportunities when the stock market is moving along its projected path.

Nothing is set in stone. Nor is the stock market's path of least resistance always known. More often than not, there are no stock index option positions recommended.


There's an easy way to boost your investment discipline...
Get Real-Time Trade Notification!

Monday, September 14, 2009

Holding On For Dear Death


Evidence demonstrating how pigs in the stock market willfully choose to be slaughtered was put on display today. With overwhelming reason to consider locking in gains off March '09 bottom ... today's hard smack at the open instead inspired money manager "talent" to bid on the trickle of supply that followed, rather than offer up supply of their own. What a pack of stupid lemmings.

Actually, though, it is good to see this. Forecasting collapse would be foolhardy were fear born of sensitivity to historical precedent instead widely evident. That "talent" persistently holds ever-tighter its equity position as indexes march higher off bottom reveals one of two things about its present operating psychology (and neither is good): fearlessness or desperation. My sneaking suspicion is the latter is rather more widespread after last year's slaughter. Still, a pig is a pig, whether it be squealing (like now) or not (like last year).


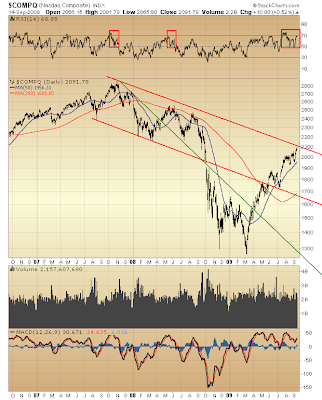
$COMPQ

You can dig into my past and discover analysis suggesting that, if past is prologue, then what might come of it is exactly what you see above.

So now the question is, if past is prologue, then how soon might $COMPQ trade down to the green line in a repeat of last year's June-July period? Looks to me that, if this move down were to begin pronto, then March bottom could be challenged by the end of the year. Indeed, if past is prologue, current divergences in both RSI and MACD suggest a sustained move down could begin at any moment. Furthermore, much as June-July '08 demonstrated, the market generally falls faster than it rises ... and it neither needs a "reason" for doing so (there wasn't one last June-July), nor must Shemp be ahead of the curve (he was bullish last summer, too).


Fast Money
* * * * *

© The Risk Averse Alert — Advocating a patient, disciplined approach to stock market investing. Overriding objective is limiting financial risk. Minimizing investment capital loss is a priority.

Analysis centers on the stock market's path of least resistance. Long-term, this drives a simple strategy for safely investing a 401(k) for maximum profit. Intermediate-term, investing with stock index tracking-ETFs (both their long and short varieties) is advanced. Short-term, stock index options occasionally offer extraordinary profit opportunities when the stock market is moving along its projected path.

Nothing is set in stone. Nor is the stock market's path of least resistance always known. More often than not, there are no stock index option positions recommended.


There's an easy way to boost your investment discipline...

Get Real-Time Trade Notification!

Sunday, September 13, 2009

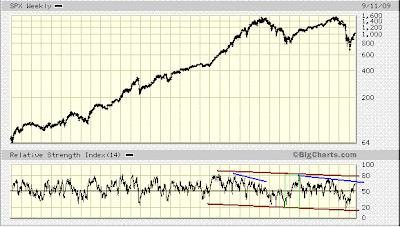
Long-Term RSI Analysis on the S&P 500


Here is a long view likewise supporting the case made Friday that, although the bear market beginning October 2007 is likely to lead major indexes much lower sometime over the next year or three, the present period might see major indexes stubbornly hold up as the current counter-trend rally phase completes...


SPX weekly

Thirteen years a sideways trading S&P 500 is seeing its relative strength deteriorate. Thus, risk of the S&P 500's eventual collapse gains further substantiation. Nothing demonstrating stabilization (indicating a base forming as the index trades sideways) is being evidenced in the price-RSI relationship.

Add the fact that no well-defined RSI bottoming process preceded the S&P 500's rally off March '09 bottom (unlike July '02 - March '03) and odds are increased the ongoing advance is but a bounce in a yet completed bear market.

Further, relative strength coincident with the S&P 500's bounce off March '09 bottom presently has RSI pressing the upper end of its [declining] trend since 2004. Thus, it is reasonable that, near-term, underlying weakness could begin to materialize (negatively affecting RSI), and persist over some time preceding the S&P 500's collapse.

Finally, that witting suckers for dead equity presently appear evident makes the similarity RSI currently shares with its behavior off '03 bottom mildly compelling ... this by the fact that, once then-dying equity (as opposed to today's dead equity) could no longer be levitated by a massive expansion of mortgage debt targeting the riskiest of borrowers the stock market, whose relative strength had been deteriorating for a few years, collapsed.

Thus, expecting underlying weakness to develop while the S&P 500 completes its wave C (off March '09 bottom) over some indeterminate weeks ahead appears entirely reasonable given price-RSI behavior subsequent to the late-2003 RSI peak. Alternatively (and, possibly, additionally), the first leg of the stock market's projected, pending collapse might, instead, come to pass and then be followed by another prolonged period featuring suckers taking their last gasp of hope that, the status quo over the past several decades might be restored.

Either way, look for RSI to present a clear picture of underlying technical deterioration prior to any earth shattering stock market collapse. Indeed, there's a case to be made this clear picture already is before our very eyes...

* * * * *

© The Risk Averse Alert — Advocating a patient, disciplined approach to stock market investing. Overriding objective is limiting financial risk. Minimizing investment capital loss is a priority.

Analysis centers on the stock market's path of least resistance. Long-term, this drives a simple strategy for safely investing a 401(k) for maximum profit. Intermediate-term, investing with stock index tracking-ETFs (both their long and short varieties) is advanced. Short-term, stock index options occasionally offer extraordinary profit opportunities when the stock market is moving along its projected path.

Nothing is set in stone. Nor is the stock market's path of least resistance always known. More often than not, there are no stock index option positions recommended.


There's an easy way to boost your investment discipline...

Get Real-Time Trade Notification!

Friday, September 11, 2009

Casino Turned Dairy Farm


Here is a picture tying together every little piece of this or that — both big and small — over the past I don't know how many weeks...


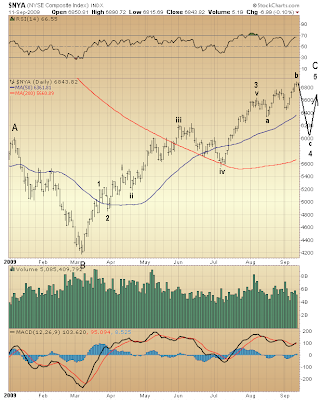
$NYA

The big picture is unchanged. Calamity awaits the end of wave C.

The near picture, too, gains focus. There's no denying there are witting suckers abounding, hankering to chase dead equity. And they will get their fill. There's time still. Or so it appears anyway.

A solid RSI and MACD case supports the above Elliott Wave count showing how $NYA's advance off March '09 bottom is yet to complete.

Likewise, with both RSI and MACD presently diverging from $NYA (relative to early-August) ... and volume conspicuously unimpressive ... the near-term outlook appears solid as well. So, coming right up could be selling that, last week, I thought might develop this week.

As pending weakness unfolds I would expect both RSI and MACD to dip below respective, early-July lows. This would add but more fuel to the fire confirming that, resumption of last year's negative trend is drawing near. Once wave C — the advance off March bottom — completes at some indeterminate moment many weeks from now, then the fireworks should begin.

I see exactly how I should play this, given my current position. I could make out just fine, I believe. Even better if the projected decline pending (shown above) has been under-estimated. NYA's 200-day moving average might be the more likely objective upcoming. (Yet one cannot throw out the possibility that, getting there might take more time than the picture above suggests.)


Fast Money
* * * * *

© The Risk Averse Alert — Advocating a patient, disciplined approach to stock market investing. Overriding objective is limiting financial risk. Minimizing investment capital loss is a priority.

Analysis centers on the stock market's path of least resistance. Long-term, this drives a simple strategy for safely investing a 401(k) for maximum profit. Intermediate-term, investing with stock index tracking-ETFs (both their long and short varieties) is advanced. Short-term, stock index options occasionally offer extraordinary profit opportunities when the stock market is moving along its projected path.

Nothing is set in stone. Nor is the stock market's path of least resistance always known. More often than not, there are no stock index option positions recommended.


There's an easy way to boost your investment discipline...
Get Real-Time Trade Notification!