Remember this chart?...

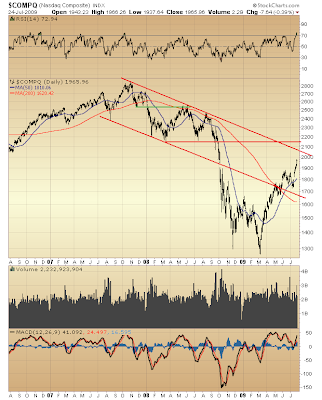
It was published on March 23, 2009 and was meant to show a "like from like" similarity in NASDAQ Composite behavior, comparing the green area with the red.
Prior to the past two weeks' trading I never would have thought to present this chart again. I never would have suggested while the market was turning over late-June through early-July that, simply because this view once was presented, the "like from like" possibility it highlighted must be the way forward.
If there is anything vexing about developing a stock market forecast, it is finding the right balance between conviction and flexibility. Although accurately projecting every twist and turn will forever be an exercise in futility, having some better sense of the big picture is by no means folly, as long as an appropriate measure of flexibility consistently guides one's view.
This is to say that, because nothing is set in stone, one's sense of the big picture should be subject to alteration, as conditions dictate. Such need could, indeed, develop in an instant!
And with this in mind, I am here to report that, not one thing to date challenges the extraordinarily negative outlook the above chart was intended to present.
Although my near-term outlook was quite positive at the time the above NASDAQ Composite chart was published, the big picture perspective presented then was intended to show that, much as the market's decline from October '07 - March '08 was a precursor to last autumn's disaster, the market's larger decline from October '07 - March '09 similarly stood as a precursor to an even bigger collapse.

I don't want to make too much of this "like from like" thing, but COMP's recovery, March - May '08, covered nearly .618 of what was lost from October '07 top. Were the current recovery off March '09 bottom to be "like" last year's, a further advance to the vicinity of 2200 could be in store. This likewise would result in nearly .618 of what was lost from October '07 being recovered.
Only a wack job would claim this further move higher is impossible, given the present environment!
Yet, too, only a wack job would claim a recovery that has moved this far, this fast, given the present environment, is anything but a short squeeze of historic dimensions! Only a wack job would call this a "new bull market."
RSI behavior speaks volumes on behalf of the current recovery being a massive short squeeze. Two profound relative strength surges in very short order since March '09 bottom form the very words.
And of momentum — MACD — what does it speak? Of a limited and waning (diverging!) drive to carry COMP higher.
Who knows what will happen over the next several days. I could develop reasons why a further, straight line rise is unlikely. But after these past two weeks? Why bother. Besides, it really is the big picture that counts here.
And troubling underlying disparities whose simple evidence is unmistakable speak volumes about a pending collapse equally as proportional to the whole of what transpired October '07 - March '09, much like last autumn's disaster similarly was proportional to the October '07 - March '08 decline.
My denial and complacency thesis is no minor consideration here. Their presence at this moment in time "fits" the big picture wherein I believe "the Dow Jones Industrials Average could fall to 3600 tomorrow and still remain in a long-term uptrend."
Indeed, this prevailing sentiment ... objectively identified ... seen in the context of an ongoing correction of a multi-decade advance (1974-2000) ... is custom made for those who wish the market to sound an alarm bell when there's trouble brewing.
The message is loud and clear. It provides a frightful backdrop to one technical reason why Dow 3600 might be too optimistic a target...

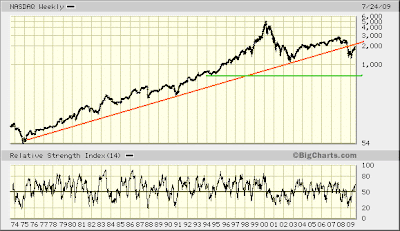
It was in the year 1994 when Dow 3600 was last seen. This corresponds with the green line drawn above on the long-term chart of the NASDAQ Composite Index.
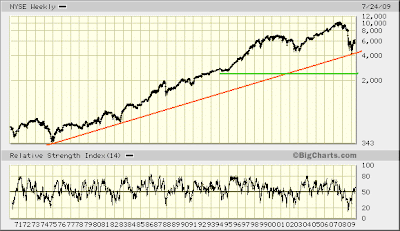
Now, just keep that line in the back of your mind and consider the fact that COMP has not yet fallen below its 2002 low, which is more than can be said for the NYSE Composite...

Nevermind for now the fact NASDAQ clearly is leading the NYSE lower. Substantiation is found both in price action since Y2k, and in the fact COMP has broken its long-term uptrend line, whereas NYA's remains intact.
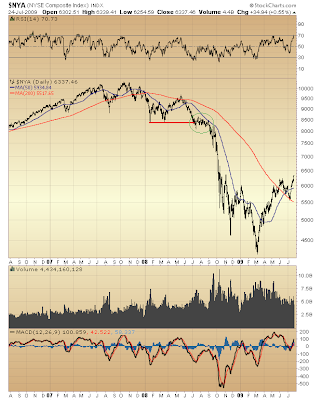
Instead, consider the fact that, unlike COMP, NYA recently broke below its 2002 low. Now, focus on recovery since March bottom. Note how COMP appears to be performing notably better, and ask yourself...
Where have we seen this before?
Why, it was just last year! Take a look...

NYA's decline, May - July '08, took the index below its low set earlier in the year.
Not so the NASDAQ Composite Index. It, contrarily, held above its March '08 bottom.
Then, following this move lower, COMP rallied like a champion, whereas NYA was comatose.
And look what came next...
Collapse.
Now, consider last year's performance disparity in the context of similar action relative to the 2002 low. And don't forget the bigger picture: how NASDAQ is leading the NYSE lower, as noted earlier.
What do you think might happen next?
If you believe this performance disparity is the face of denial and complacency (much as it proved to be last year), then I think you'll agree a terrible, terrible collapse could be right around the corner.
And levels last seen in 1994 might be no match for the looming danger...

* * * * *
© The Risk Averse Alert — Advocating a patient, disciplined approach to stock market investing. Overriding objective is limiting financial risk. Minimizing investment capital loss is a priority.
Analysis centers on the stock market's path of least resistance. Long-term, this drives a simple strategy for safely investing a 401(k) for maximum profit. Intermediate-term, investing with stock index tracking-ETFs (both their long and short varieties) is advanced. Short-term, stock index options occasionally offer extraordinary profit opportunities when the stock market is moving along its projected path.
Nothing is set in stone. Nor is the stock market's path of least resistance always known. More often than not, there are no stock index option positions recommended.
 There's an easy way to boost your investment discipline...
Get Real-Time Trade Notification!


