First thing worth noting is OEX options open interest with the August contract now expired. 91k Calls v. 78k Puts. So, we're back to the same starting square. And, in fact, there simply is nothing bullish about this (although equities might still remain levitated for a time).
Some of those calls are hedging short equity positions. Some are sold covered, thus putting a ceiling on the writers' long equity positions.
Some of those puts are hedging long equity positions ... some new, some old. Per the latter, it sure would be nice to know the extent to which this group is selling calls against the long positions it likewise is hedging with puts. These would be strong hands with power to keep prices levitated. Yet this bit of intell I am not privy to.
However the risk of prices remaining levitated is my wonder tonight.
I have been reading Doug Noland's "Credit Bubble Bulletin" for many years now. I can count on one hand the number of times when his outlook from a credit market perspective did not largely match my highest probability expectation toward the stock market. This week's installment (The Depressed U.S. Consumer and Global Reflation) came close to being disagreeable. Stepping back, though, and considering how the stock market's levitation might take form, Noland's more sanguine near-term outlook becomes rather agreeable.
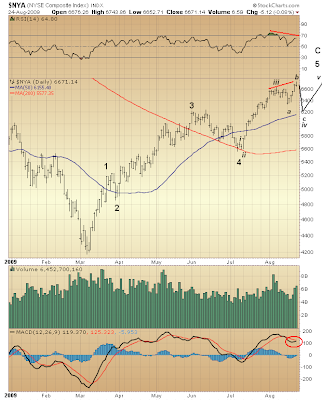
You will recall on Friday a year-to-date, $NYA chart detailing five waves up from March '09 bottom. The 5th wave, unfolding since early July, showed waves i, ii and iii labeled. Wave iv of 5 was not labeled. That's because wave iv might have ended last Monday (8.17.09), or it might still be forming right now. It's impossible to say. Yet this won't forever remain a mystery.

In a picture that's the view of an extended levitation: something to seemingly defy the Stock Market Top Appears Nigh thesis, and in so doing find considerable agreement as well.
Presently diverging RSI and MACD at a new 2009 $NYA high support the probability sketched above suggesting a bout of steep selling is in store over days straight ahead. So, too, the modest volume spike Friday and today. Like the previous two volume spikes noted on Friday this one also is occurring at the end of a third wave.
The question is whether it's coinciding with the end of wave c of b of iv of 5 of C? (which is what the above markup suggests) Or did wave 3 of v of 5 of C end today? (in which case top is but hours away)

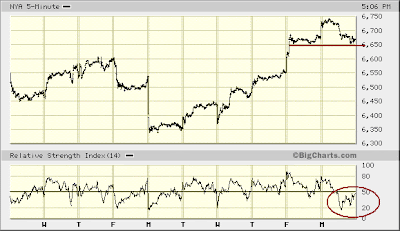
Alas, there's a new Maginot Line. Break below that and it's straight down to the bottom of this chart she probably goes. Judging by RSI — having severely broken down today ... and then more or less come into buy- and sell-side balance (i.e. in the vicinity of 50) — odds are the Maginot Line does not hold. And if that happens, then top is delayed ... although, still, not very far overhead.
I heard Terranova chirping about "the difficult months" of September and October (watch "Word on the Street" below).
But what if an "ending diagonal [triangle]" — an Elliott Wave construct "that occurs primarily in the fifth wave position at times when the preceding move has gone 'too far too fast' ... " — were to form wave v of 5 of C?
(Hard to find four words that better describe the market's advance since March '09: too far too fast.)
Assuming wave iv of 5 of C is, itself, not yet complete, then supposing a drawn out rising wedge could follow, one sees how the market could hold up through its "difficult months." Just imagine the Monetarist Monkey celebration!
"We made it through October!" ... with more than one observer making some snooty remark about the "sell in May and go away" thesis.
And from that moment on the trip turns south for the winter...

* * * * *
© The Risk Averse Alert — Advocating a patient, disciplined approach to stock market investing. Overriding objective is limiting financial risk. Minimizing investment capital loss is a priority.
Analysis centers on the stock market's path of least resistance. Long-term, this drives a simple strategy for safely investing a 401(k) for maximum profit. Intermediate-term, investing with stock index tracking-ETFs (both their long and short varieties) is advanced. Short-term, stock index options occasionally offer extraordinary profit opportunities when the stock market is moving along its projected path.
Nothing is set in stone. Nor is the stock market's path of least resistance always known. More often than not, there are no stock index option positions recommended.
 There's an easy way to boost your investment discipline...
Get Real-Time Trade Notification!


