Tuesday, March 31, 2009

A Hyperinflationary Trend Was The March Friend


Back in the day GM was a company likened to a dog wagging the tail of the U.S. economy. What was the saying? As goes GM, so goes the U.S. economy. Contrary to popular opinion this relationship remains on point.

Thirty years leveraging the diminishing physical capacity of an industry whose machine tool sector once was a productivity enriching engine of growth does not transform an economy in any positive sense of the word. Rather, it simply masks the reality of economic decline, postponing an inevitable day of reckoning.

This is reality barreling down upon us all. The auto industry's pending downsizing and auctioning of physical plant and equipment might generate enough capital to service a mountain of financial claims for another few months, but then what?

My point is this. Once physical capacity sustaining life as we know it no longer exists, there's no way to paper over economic vulnerability. Absent supply of physical capacity necessary for sustaining a certain level of economic activity, credit and money supply could, indeed, shrink and conditions still would be conducive to hyperinflation.

There has been much too little discussion in the mainstream about what the collapse of credit markets has done to dramatically shrink world trade. The prospect of increasing protectionism only further threatens the supply of physical goods necessary for sustaining economic activity. Hyperinflation, therefore, is demonstrated more a physical process than a monetary one. This threat looms large and I fear the President and his advisors just don't get it.

One is left to wonder, then, where will all the trillions of dollars being thrown at the problem (because the Fed has "learned its lesson" from the Great Depression, right?) go? Surely, sophisticated minds know best. Thus, the divide between the haves and have-nots might only further grow.

Do you begin to imagine how the disconnect between the stock market and the economy might become all the more profound? What I mean to suggest is the coming period could be one where the stock market rises spectacularly while at the same time the economy virtually collapses. Seeing shades of this dichotomy over the past month, one is left to wonder what more of it will result over the next ten years?


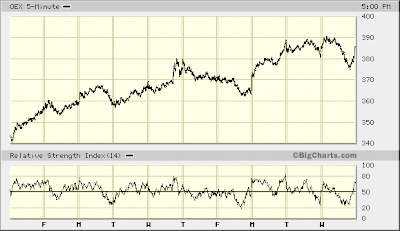
OEX 5-min

Last week I indicated that, even if the market pulled back in a fashion thought less likely at the time (which, unfortunately, has been the outcome), higher highs off March bottom would remain in the offing. This sense persists.

Even if selling developing during today's final hour continues during Wednesday's trading, the OEX should find support not much lower than was reached yesterday. Subsequently, look for the market to turn up ... and quite possibly with a great deal of conviction.

Just how much the market might imminently extend its gains off March bottom is a bit of a question right now. The next couple weeks could see trading unfold in a narrow range. Just as likely, though, indexes might be taken another 15-20% higher. I'm on the fence for the moment.

The better part of me believes the greater portion of gains projected to be made over coming months will register sooner rather than later. The thinking here defers back to the 1970-1973 period, or more recently, post-9/11...


Fast Money
* * * * *

© The Risk Averse Alert — Advocating a patient, disciplined approach to stock market investing. Overriding objective is limiting financial risk. Minimizing investment capital loss is a priority.

Analysis centers on the stock market's path of least resistance. Long-term, this drives a simple strategy for safely investing a 401(k) for maximum profit. Intermediate-term, investing with stock index tracking-ETFs (both their long and short varieties) is advanced. Short-term, stock index options occasionally offer extraordinary profit opportunities when the stock market is moving along its projected path.

Nothing is set in stone. Nor is the stock market's path of least resistance always known. More often than not, there are no stock index option positions recommended.


There's an easy way to boost your investment discipline...

Get Real-Time Trade Notification!
Monday, March 30, 2009

A Taller, Tanner Herbert Hoover and the Same Mr. Market


Yet again Nature's God demonstrates how little is the value of an Ivy League education...


That the President of the United States would stand against a domestic industry refusing to destroy itself as rapidly as has been legislatively mandated over the past thirty years is all the evidence one needs to counter Shemp's claim that the current extraordinary period is not a 1929 redux...


Herbert Hoover similarly turned his back on industry with the same old tired line about the American spirit, lauding its can do, comeback character. Still, unemployment grew.

Herbert Hoover similarly prostrated himself to Wall Street through the institution of the Reconstruction Finance Corporation, which was the TARP of his day. Still, the banking system collapsed.

Herbert Hoover similarly took his policy cues from London ... and for this he paid dearly.


I'm sorry, Cramer, but I beg to differ. We are facing a crisis of historic dimension when a President claiming to identify with Abraham Lincoln, FDR and JFK behaves like Herbert Hoover. Back in the day when London held its fascist financier political puppet show, FDR failed to make an appearance. He canceled. $550 says the President gets on his plane and does the Queen's bidding come Thursday.

(Now that Dylan's gone, someone's got to pick up the slack.)

Don't get me wrong. I entirely agree with Cramer's near-term view. In fact, I share his same confidence that no more than 5% lower is probable here. Yet given the course upon which the President has embarked, any serious student of history must side with that 85 year old geezer, LaRouche (the last, living founding father, as I affectionately call him). Come this fall, indeed, could come the fall of the U. S. of A. in hyperinflationary collapse brought on by an assorted array of monetarist monkeys, inept politicians and despicable TV personalities.


$SPX

Can you tell I'm a little worked up about today's low volume thud? So, reluctantly, I'll give this one to the crowd. But in no way has my view changed, not even the slightest.

This morning CNBC's Matt Nesto reported "no one" is pounding the table calling a bottom. Apparently, el Nesto is not a loyal reader. Then again, though, I have not been pounding the table. Well, I am now.

RSI is flattening out — already having firmly penetrated the buy-side, now bumping the point where buying and selling strength are in balance (i.e. 50) — hearkening that old Wall Street adage again ... the one that says the trend is your friend. Just look back a month ago when the trend then was lower. RSI likewise flattened out, only to set up the market's further fall. (And you might ask where was I? Well, I wish I could tell you! Apparently I was just a hankerin' for some humble pie. I'm all fulled up now, thank you...)


SPX 5-min

Take away Friday's and today's opening half hour and you have a market that's probably banking gains made this month. Thus, money managers will have something on which to hang a hat when their fund's performance during the first quarter is reported. I should have thought of this possible outcome. However, I simply did not want to miss what I am convinced will be the markets further push higher.

Let me just say that, despite Elliott Wave-related possibilities being finite at any given moment, my investment position [obviously] will not be performing perfectly at every instant. If I could call every twist and turn and be positioned accordingly, trust me, I would.

Still, here we are, right where finite Elliott Wave possibilities suggested was an alternative even back in November. At this point the market has much higher to go. The next several months should see indexes inexorably rising, albeit on a trajectory likely flattening over time.


Fast Money
* * * * *

© The Risk Averse Alert — Advocating a patient, disciplined approach to stock market investing. Overriding objective is limiting financial risk. Minimizing investment capital loss is a priority.

Analysis centers on the stock market's path of least resistance. Long-term, this drives a simple strategy for safely investing a 401(k) for maximum profit. Intermediate-term, investing with stock index tracking-ETFs (both their long and short varieties) is advanced. Short-term, stock index options occasionally offer extraordinary profit opportunities when the stock market is moving along its projected path.

Nothing is set in stone. Nor is the stock market's path of least resistance always known. More often than not, there are no stock index option positions recommended.


There's an easy way to boost your investment discipline...

Get Real-Time Trade Notification!

Friday, March 27, 2009

Market Showing How Suckers Sell Low and Buy High


The score as I see it remains Crowd 0, Me 0. The consensus continues expecting a further pullback. The market has risen "too far, too fast," they say.

Yet one only need go back to the September - October '08 period to find an instance when the market had fallen as much as it has risen since March 10th. Lo and behold no interim recovery was forthcoming then. The market continued its collapse. My, how soon we forget. Or is it the crowd simply is consumed by the fright of it?

I have said this before and I will say it again. In the framework of the Elliott Wave Principle third waves typically are the most dynamic. The market's decline last September - October was a third wave (wave 3 of c of an a-b-c that began October 2007). Likewise, the market's advance since March 10th is seen a third wave (wave c of an a-b-c that began November 21, 2008). Up next is wave 3 of five waves forming either wave (1) of c or wave c itself.

That's the foundation of my basis for suspecting a 10% move higher could unfold stat. Although this did not happen Friday as I thought it might, Monday is another day.

There is just no denying measures of the stock market's underlying technical condition are strong, and have room for further strengthening. Likewise, what few first signs of any building weakness exist, these are seen reflecting consensus belief ... being fed ... and set up for disappointment. Let me show you what I mean...


$NAAD

Seems to me increasing propensity to sell as NASDAQ moves higher (seen via the Composite's Advance-Decline Differential) reflects conditions defining Chicken Little's failed investment philosophy: sell low and buy high.

I believe weak hands are being set up. Why? Let's zero in on this week's trading at the Pump and Dump...


NASDAQ 5-min

Monday's (3.23.09) gap open higher went ... unfilled. And Thursday's (3.26.09) ... the same. Gains are being defended. This is the work of strong hands.

Consider RSI. Monday's closing surge to a buy-side extreme made forecasting a day or two of weakness a reasonable probability. Still, buy-side RSI extremes confirm an Elliott third wave up is forming. Rather than raising serious concern (as would typically be the case), their occurrence now quite stands to reason.

(We saw the flip side as the market fell throughout January and February '09, with 5-minute RSI registering sell-side extremes on a number of occasions. Again, an Elliott third wave [down] was forming.)

Now look how RSI tightened like a wound spring over the course of this week's trading ... and this, no less, while the market was rising. I contend this combination suggests underlying strength is building.

Where's the profit taking? It's AWOL. So far, suckers are selling this rally. See for yourself...


$COMPQ

Alas, the trend is your friend. Notably weaker volume on down days in a rising market is the trend. Your friend (if, like me, you are long) is that, likelihood the market will rise farther still finds substantiation in this trend.

We probably will know a top is near when volume markedly increases on a down day. This has yet to happen. Every instance of selling thus far since March 10th appears largely a function of buyers stepping aside.

One might suppose strong hands are testing the resolve of short interest. They must be satisfied. Shorts are not putting up the volume of shares necessary to drive the market lower in favor of their position. What little they sell, strong hands absorb. Chances are, then, the market will be driven still higher before any pullback of consequence materializes.

I like how RSI is flattening out, too, presenting a picture of balance between both sides of the trade. This suggests the trend higher is sustainable (much as was similarly demonstrated during declining periods over the past six months).


Fast Money
* * * * *

© The Risk Averse Alert — Advocating a patient, disciplined approach to stock market investing. Overriding objective is limiting financial risk. Minimizing investment capital loss is a priority.

Analysis centers on the stock market's path of least resistance. Long-term, this drives a simple strategy for safely investing a 401(k) for maximum profit. Intermediate-term, investing with stock index tracking-ETFs (both their long and short varieties) is advanced. Short-term, stock index options occasionally offer extraordinary profit opportunities when the stock market is moving along its projected path.

Nothing is set in stone. Nor is the stock market's path of least resistance always known. More often than not, there are no stock index option positions recommended.


There's an easy way to boost your investment discipline...

Get Real-Time Trade Notification!

Thursday, March 26, 2009

Investing Constantly Proves Misery Loves Company


I'm an analyst who in forming an outlook assesses the sentiment of the world around. Depending on an individual's or an institution's connection to the the stock market, expressed sentiment affects my view. I prefer little company because widespread consensus typically is wrong.

Prior to writing yesterday's commentary I found on the bound analysts who are in the pause camp. Their thinking is the market has come so far off bottom it is time for a break — a consolidation. This sentiment is something of a consensus right now. Late today, Fast Money trader Joe Terranova echoed this same view, indicating he is even selling Calls right now.

That is why I continue keeping an Eye Toward the Sky. This despite Cramer elaborating in substantive fashion my same view believing the bearish trade presently is on the ropes. Although we both suspect the market could rise much further from here, Cramer — like many other analysts — seems to believe there will be a pullback first, following which will arise an opportunity to go long the market ahead of shorts being forced to cover their positions.

Myself, I believe the greater bulk of what remains in the market's current charge higher could unfold over the next two days.


$SPX

Again, put on your Mr. Big hat. What better way to entice the fish you wish to feed than giving them the weekend to think about nothing else but their appetite for stocks, now that the market clearly has taken flight?

Now, if I am correct, it is possible the market could advance by upward of 10% on Friday. It's probably a good bet volume would be beefy were this to actually happen. That's the point of the volume analysis drawn above. As you can see during the market's February decline peak volume came nearer the bottom. During this month's advance peak volume might register during the next burst higher ... which could come as soon as tomorrow.

That is if both Cramer and I are correct in our view toward the short side of the trade. He agrees with me ... shorts are being squeezed.

The point where I diverge from Cramer rests on prospects for an imminent pullback. I believe shorts could be put in a vice on Friday. Given this week's squeeze ... following two weeks straight a rising market, and now week three ... how wise would they be remaining short the weekend, going into end of quarter whose third month has been a bloodbath for their position?

It could be a turkey shoot. If there's no one else you're reading who's suggesting this, you might choose this moment to raise an eyebrow.

Needless to say I presently suppose that even if this possibility does not come to pass — even if the market loses ground and makes the score: The Crowd 1; Me 0 — Mr. April OEX 390 Call remains safe and likely will find a still more profitable exit point within days.

RSI and MACD — measures of momentum — are seen reflecting a rising emotion appreciative of upside opportunity. It just so happens some not insignificant portion of this can be affected via a short squeeze.

There's something else to think about... The size of short interest. All reasonable considerations of its skewing aside (due to the trade in long-short ETFs), the larger part of short interest existing because of absence of an uptick rule makes for a larger avalanche of buying when the same herd runs to cover.

So, NYSE short interest — reported to have grown 11% in the two week period ending mid-March (and at the time reported here to have been well-hedged via OEX Call options) — is seen vulnerable to attack ... as it has been already. The question now is how much more? We should know better tomorrow.


Fast Money
* * * * *

© The Risk Averse Alert — Advocating a patient, disciplined approach to stock market investing. Overriding objective is limiting financial risk. Minimizing investment capital loss is a priority.

Analysis centers on the stock market's path of least resistance. Long-term, this drives a simple strategy for safely investing a 401(k) for maximum profit. Intermediate-term, investing with stock index tracking-ETFs (both their long and short varieties) is advanced. Short-term, stock index options occasionally offer extraordinary profit opportunities when the stock market is moving along its projected path.

Nothing is set in stone. Nor is the stock market's path of least resistance always known. More often than not, there are no stock index option positions recommended.


There's an easy way to boost your investment discipline...

Get Real-Time Trade Notification!
Wednesday, March 25, 2009

An Eye Toward the Sky


Well, yesterday's Eye Toward Transition has become today's Eye to the Sky...


OEX 5-min

The need to change perspective caught first sight in the opening minutes, when out of nowhere rapidly unfolded a rather unexpected 2% move higher. Where in pre-market futures did this come from? Why, it was hidden from view!

Odd, too, was the market's unusual display of strength coming on the back of the alarming fact that, during Monday's 7% surge there were approximately three times as many new, OEX Call contracts opened versus Put contracts. Normally, you'd expect Put open interest (hedging long equity positions) to swell with a gain like Monday's. Instead the opposite was true.

So, the real question is whether the position of OEX Call buyers is stronger than that of the contract writers. Are the buyers paving the way to maximizing their score prior to driving the market higher over days ahead?

Was today's strong lift out of the gate a warning shot? Likewise, was the final hour a coup de grace?

Well, here is what I know...

Yesterday, the market fell 2%, yet OEX Call open interest did not widen versus Put open interest. What does this reveal? That Monday's bump in Call open interest probably was less to do with short equity hedging than with speculative position building. If it were the former, then Call open interest would have swelled further during yesterday's decline as the market moved in favor of short equity positions.


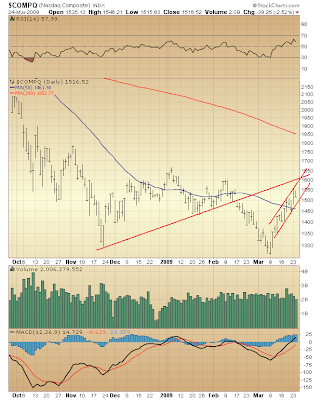
$OEX

Nothing alarming on the technical front. There's no sign of weakness at all. Rather, all indications suggest conditions are strengthening.

So, let's move our view into the explosion higher NOW camp. I wrote about this possibility not long ago. The thinking was the market could charge higher so fast that, most players would be left behind, still on the sidelines nursing wounds suffered over the past year ... afraid to pull the trigger on any new long position. Then, only after a huge move up would new money willingly enter. Subsequently, early adopters would have their witting flock to whom they could feed their shares.

Remember?

I also discussed the possibility daily RSI might ramp rapidly to the vicinity of a buy-side extreme (upward of 80) ... something like weekly RSI back in 1970. Here's why this might be the likely course...

Have you noticed the President and the Treasury Secretary are being very clear about the future of structured finance? Like Elvis it ODed. Like Elvis it is dead. You have to listen a little more carefully to Secretary Geithner. But the message is there.

So, now that lines are drawn with clarity toward a future whose intention is to be less dominated by wildcat finance ... and as soon as possible at that ... there's less hope the riskiest of financial assets — common stocks — and the mountain of debt that has supported their levitation for the past 20 years can be sustained in a fashion harmonious with the heretofore status quo. In other words, the gig is up. (No need to wonder any longer about what has been motivating the "Get Geithner" media drive.)

Let me ask you this, then. Imagine you're Mr. Big and you see the writing on the wall. Would you panic? Or would you scheme to maximize your power to improve your position? You're holding a beefy inventory now that the weakest hedge funds have been bled dry. You'd like to significantly lighten your equity stake, right?

So, wouldn't you be best off somehow driving the market higher as rapidly as possible, then moving to unload your inventory as slowly as possible afterward?

Technically — viewing this two-step dance from the perspective of RSI — you really should take another look at weekly RSI 1970-1973. You'll get a better sense of how things might proceed from here ... first convincingly up ... then holding gains for as long as possible ... and finally down to the neighborhood of Dow 3600.


Fast Money
* * * * *

© The Risk Averse Alert — Advocating a patient, disciplined approach to stock market investing. Overriding objective is limiting financial risk. Minimizing investment capital loss is a priority.

Analysis centers on the stock market's path of least resistance. Long-term, this drives a simple strategy for safely investing a 401(k) for maximum profit. Intermediate-term, investing with stock index tracking-ETFs (both their long and short varieties) is advanced. Short-term, stock index options occasionally offer extraordinary profit opportunities when the stock market is moving along its projected path.

Nothing is set in stone. Nor is the stock market's path of least resistance always known. More often than not, there are no stock index option positions recommended.


There's an easy way to boost your investment discipline...

Get Real-Time Trade Notification!
Tuesday, March 24, 2009

An Eye Toward Transition


NASDAQ ... rising less yesterday, and falling more today relative to the NYSE ... is a red flag signaling caution ahead. No panic. Just expect some weakness ... maybe lasting a couple weeks or more ... resulting in major indexes giving back 30-50% of gains made since March 10, 2009 bottom.

Expect this once the market's initial lift higher is completed. Quarter's end and all its accompanying, professional money manager positioning strikes me as a technically viable moment for transition ... from the present positive ... to profit taking in a Spring cleaning. Subsequently, look for position building in preparation of summer's scorching rally.


$NYA
$COMPQ

Hard not to like how the market held up today...

RSI ... solidly on the buy-side. MACD ... moving likewise. Nice. The predictive value these measures provide via established divergences (October/November '08 versus March '09) is blossoming.

So, it's onward higher to a point of transition where a larger pause that refreshes should commence ... setting the stage for a further rally still ... targeting NYA 6500-7000 and NASDAQ 2200.

As you can see via prospective price channeling drawn above, there is "room" for more pressure beyond what developed during the final half hour of trading today. However, I'm not sure whether we might see indexes move sideways another day or so...


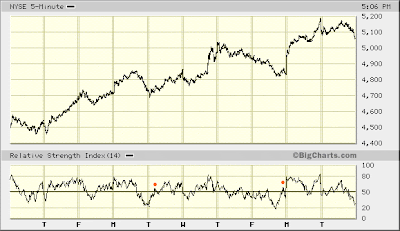
NYSE 5-min
NASDAQ 5-min

Today's was another 5-minute RSI sinking looking more symptomatic of a buyer's strike and profit-taking than any strong move to the exits ... much the same as we have seen over the past ten days. Look for a sharp move to buy- and sell-side balance (i.e. in the vicinity of 50) signaling the start of the next leg higher I am anticipating.

It should be considered a sign of underlying strength that only yesterday's final hour could be taken away today ... and this, only in the final half hour.


OEX 5-min

Today's slight rise above yesterday's high in the large-cap S&P 100 index also suggests there is still higher to go before this initial advance off bottom is completed.

It's possible that, from an Elliott Wave perspective the market's initial advance since March 10th is already over and a corrective wave has begun to unfold. Still, there's likely higher levels yet to be reached before any sustained pressure redevelops. Somewhere in the vicinity of 400-410 in the S&P 100 appears a reasonable objective.


Fast Money
* * * * *

© The Risk Averse Alert — Advocating a patient, disciplined approach to stock market investing. Overriding objective is limiting financial risk. Minimizing investment capital loss is a priority.

Analysis centers on the stock market's path of least resistance. Long-term, this drives a simple strategy for safely investing a 401(k) for maximum profit. Intermediate-term, investing with stock index tracking-ETFs (both their long and short varieties) is advanced. Short-term, stock index options occasionally offer extraordinary profit opportunities when the stock market is moving along its projected path.

Nothing is set in stone. Nor is the stock market's path of least resistance always known. More often than not, there are no stock index option positions recommended.


There's an easy way to boost your investment discipline...

Get Real-Time Trade Notification!

Monday, March 23, 2009

Trading Like a Company on the Verge of Ruin


Times like these, I wish I were a Texan. Then, I could say "Yee-haw" and you'd know how much I really mean it. Are you kidding, up 7% in a single day? The market trades like a company facing bankruptcy!

And there you have it. All my blathering about a grotesquely leveraged, securities-based financial system on track to reek more havoc over the next few years has been demonstrated a rational concern all in one day's time. Go figure.

First things first, however. What began on March 10th in all probability has a lot further to run...


$COMPQ

That's more drawing than usual, but if you click on the chart and get a full-screen view, you'll see a remarkable similarity comparing the larger red markup with the green. The conclusion is a counter-trend rally similar to that which unfolded March 17 - May 19, 2008 is seen beginning on March 10, 2009. The NASDAQ Composite's ultimate objective is in the vicinity of 2200.

All positive developments over the past ten days aside, today's subdued volume and continued strong relative strength (RSI) are a red flag. So, near-term, a pause might be in store, retracing 30-50% of gains made since March 10th.


NASDAQ 5-min

Crazy 5-minute RSI performance! Much as I mentioned last Wednesday, the appearance of a buy-side imbalance supports the likelihood a brief period of relatively mild weakness probably is to be expected.


NASDAQ 1-min

Come Tuesday there should be a bit more upside remaining, thus allowing an opportunity to profitably close out the April OEX 390 Call option I picked up Friday. The strong advance that began on March 10th and extended today likely will continue sometime soon enough ... following a consolidation lasting some days ahead. So, I'll look forward to another options play (and hopefully a repeat performance) in the very near future.

Per Ultra ETFs, I continue just holding. There's a ton of upside remaining between now and the end of summer. No need to worry about this long position for the moment...


Fast Money
* * * * *

© The Risk Averse Alert — Advocating a patient, disciplined approach to stock market investing. Overriding objective is limiting financial risk. Minimizing investment capital loss is a priority.

Analysis centers on the stock market's path of least resistance. Long-term, this drives a simple strategy for safely investing a 401(k) for maximum profit. Intermediate-term, investing with stock index tracking-ETFs (both their long and short varieties) is advanced. Short-term, stock index options occasionally offer extraordinary profit opportunities when the stock market is moving along its projected path.

Nothing is set in stone. Nor is the stock market's path of least resistance always known. More often than not, there are no stock index option positions recommended.


There's an easy way to boost your investment discipline...

Get Real-Time Trade Notification!

Saturday, March 21, 2009

GE Brings One Good Thing to Life


Occasionally in the course of developing my analysis I will look at charts of various widely-held companies, and refine my sense of broad market prospects from the framework of what appears a likely course for select, individual issues.

Before I published yesterday's commentary I took a gander at General Electric (NYSE:GE).


company chart (GE)

What a disaster. One's first reaction cannot help but see trouble ahead for GE (and by extension the broad market). But then again, GE is trading in the range where it stood in 1994 ... much like broad market indexes might over the next few years. It's possible GE is but leading the way, and not necessarily slated for further unraveling.

Another takeaway is GE, being a widely-held issue, might have been caught in the crossfire of a financial system starved for capital. In other words, a part of GE's recent troubles could originate with larger, systemic issues that (not coincidentally) find GE's Capital unit caught in the middle. Were institutions needing ready capital forced to sell highly liquid shares of GE out of necessity, rather than any profound loss of confidence in the company's future?

I could not say. I have no bead on GE's long-term fortune. Being our global, securities-based financial system technically is insolvent, with no hope of being bailed out or resuscitated, it's not impossible imaging GE remaining an industrial company, but its equity driven to zero by its Capital unit.

Be that as it may, GE's near-term prospects over weeks and months ahead might still be reasonably discerned. If history is any guide, the deeply oversold position to which GE's weekly RSI has descended at least indicates a bounce probably is in order.


company chart (GE)

And bounce it has ... much like last September and then again in November. The question now is whether GE already has seen the best of its present recovery. If so, what might this mean for a near-term outlook believing broad market indexes have another 15-20% higher to go before another bout of selling pressure develops?

Well, let's have a closer look at GE's performance off its November '08 bottom and contrast this with the broad market.

company chart (GE)

Take a look at Friday's post and contrast the NYSE Composite's performance with GE's from October '08 through early-January '09. GE led the broad market's advance into early December, then notably began to lag going into the New Year.

You'll see, too, GE once again is leading the broad market higher. Might another period of it lagging be in store before any broad bout of selling takes hold? This seems quite reasonable. Right now, though, there's reason to believe broad market indexes could advance another 15-20% because GE, despite its uncertain long-term outlook, has yet to show renewed, near-term distress. Pretty simple.

* * * * *

© The Risk Averse Alert — Advocating a patient, disciplined approach to stock market investing. Overriding objective is limiting financial risk. Minimizing investment capital loss is a priority.

Analysis centers on the stock market's path of least resistance. Long-term, this drives a simple strategy for safely investing a 401(k) for maximum profit. Intermediate-term, investing with stock index tracking-ETFs (both their long and short varieties) is advanced. Short-term, stock index options occasionally offer extraordinary profit opportunities when the stock market is moving along its projected path.

Nothing is set in stone. Nor is the stock market's path of least resistance always known. More often than not, there are no stock index option positions recommended.


There's an easy way to boost your investment discipline...

Get Real-Time Trade Notification!

Friday, March 20, 2009

Leaving No Stock Market Investor Behind the Curve


Let me begin by summarizing why a strong move higher in the stock market is likely to unfold sooner rather than later.

Quite simply, you could not ask for a nicer setup than exists right now...


NYSE 5-min
NASDAQ 5-min

As you can see, a price-RSI divergence of a different sort than I typically highlight has developed over the course of the market's advance these past ten days. Here, we see higher price lows coincident with lower RSI lows.

Look at this [remarkable] condition this way. If there were a great deal of excitement and widespread positive sentiment following the market's nearly 20% advance off bottom (something you would expect were the market near a top), do you suppose buying interest would more rapidly evaporate subsequent to each new surge into still higher ground? No! Of course, not. Rather, you would expect increased interest anticipating further advances resulting in greater balance between the buy-side and the sell-side.

Instead we are seeing precisely the opposite. Why?

Because belief in positive prospects remains thin. And this condition makes for witting converts who will be won to the bullish side of the trade only after the market moves still higher.


Investors Intelligence

Are you kidding me? Talk about "behind the curve!" Again, you could not ask for a nicer setup. The majority of investment newsletter writers remain bearish. There's no need to worry about who is left to "buy into" any further rally in the market. They pretty much all are.


$VIX

Oh my goodness. Such fear following Thursday's and Friday's tiny pullback in broad market indexes! This is mint. VIX behavior these past two days suggests, near-term, any further market advance will be met with considerable skepticism. Perfect.

Alrighty then. Let's have a look at reasonable upside prospects...


$NYA
$COMPQ

Expect another 15-20% higher before any serious resistance develops. My upside target in the NASDAQ Composite (in the vicinity of 1750) was detailed last Friday. Contrarily, the NYSE Composite might struggle to reach a new high for '09 during its anticipated, upcoming advance.

Hey, did you hear this week marked the first time since last May the market was positive two straight weeks? Hard to believe. It's little wonder, then, sentiment remains so negative.

Of course, presently constructive circumstances could change in an instant. Yet considering what appears a fine setup for a further, broad market advance, I decided on Friday to enter what I believe is a low-risk options speculation. This position (April 390 OEX Call) ventures to score a quick 200-500% ROI. Given presently elevated volatility, opportunity to exit the position with premium remaining relatively intact (should conditions unexpectedly deteriorate) makes for ability to set a relatively liberal stop-loss.


Fast Money
* * * * *

© The Risk Averse Alert — Advocating a patient, disciplined approach to stock market investing. Overriding objective is limiting financial risk. Minimizing investment capital loss is a priority.

Analysis centers on the stock market's path of least resistance. Long-term, this drives a simple strategy for safely investing a 401(k) for maximum profit. Intermediate-term, investing with stock index tracking-ETFs (both their long and short varieties) is advanced. Short-term, stock index options occasionally offer extraordinary profit opportunities when the stock market is moving along its projected path.

Nothing is set in stone. Nor is the stock market's path of least resistance always known. More often than not, there are no stock index option positions recommended.


There's an easy way to boost your investment discipline...

Get Real-Time Trade Notification!

Thursday, March 19, 2009

What Would You Know About Pressure?


Inasmuch as CNBC's Fast Money can be helpful in establishing one's analytical bearings, tonight's lead segment from Cramer's Mad Money was a gold nugget, too. His view certainly backs my sense of the big picture.

Today's so-called "pressure" speaks volumes, particularly where it was felt most. Speaking of volume ... did you happen to see how relatively beefy today's was on the NYSE?


$NYA

The usual suspects — financials — were beat up today (XLF -8%; BKX -9%). However, notably, the broad market did not quake. I must say, big-picture-wise, my projection for a big run-up ... right into a brick wall ... seems a reasonable, near-term view well-supported by today's trade.

One question you might ask looking at the above chart of the NYSE Composite is whether the market is at a point like early-November '08. Well, look at volume and RSI. Big difference. Underlying conditions are markedly more positive now. The market appears ripe for the driving higher.


NYSE 5-min
NASDAQ 5-min

Broad-based strength evidenced today (despite aftershocks in financials) lends a sense that, support lies not much lower.

Bottom line, further pressure lasting but a few more hours might be all that's left before the market throttles higher.


Fast Money
* * * * *

© The Risk Averse Alert — Advocating a patient, disciplined approach to stock market investing. Overriding objective is limiting financial risk. Minimizing investment capital loss is a priority.

Analysis centers on the stock market's path of least resistance. Long-term, this drives a simple strategy for safely investing a 401(k) for maximum profit. Intermediate-term, investing with stock index tracking-ETFs (both their long and short varieties) is advanced. Short-term, stock index options occasionally offer extraordinary profit opportunities when the stock market is moving along its projected path.

Nothing is set in stone. Nor is the stock market's path of least resistance always known. More often than not, there are no stock index option positions recommended.


There's an easy way to boost your investment discipline...

Get Real-Time Trade Notification!

Wednesday, March 18, 2009

Now Come the Pause That Refreshes


Well, what do you make of today's high-volume, upside burst — the most active day of trading since the market commenced its launch higher on March 10th?

Think back to yesterday's exercise in imagination...

Did you take advantage of today's good news (the sound of helicopters coming from the direction of the Monetarist Monkey Zoo) and unload some of your winning positions to apes (like Cramer) who have been waiting for this banana from the Federal Reserve for some time now? Of course you did! That's why volume surged.


$NYA
$COMPQ

So, here we are again in the vicinity of the 50-day moving average...

The position of each index in relation to this moving average bodes well for the near future. This time in the advance to the 50-day NASDAQ actually is leading (unlike mid-December '08 when, under similar lead-up circumstances, NASDAQ actually lagged ... a red flag I did not notice until this very night ... unfortunately).

Curiously, though, NASDAQ is well-short of its '09 downtrend line, whereas the NYSE Composite has risen to touch its same line. What is this saying? How about that, wild animal spirits have yet to bid the market higher, suggesting there's a lot of upside remaining.

Look at that solidly rising RSI firmly charging higher to the buy side of the balance. Sweet! First, it's confirming expectations (Elliott Wave-based) for a big move higher still. More immediately, though (much like MACD), it shows there is an open window for some healthy profit-taking over coming days. This is much the same message presented yesterday in the chart of the NYSE Bullish Percent Index (whose condition only improved today, further confirming positive expectations).


NYSE 5-min
NASDAQ 5-min

As you can see, whenever RSI registers a buy-side extreme pressure can be expected to develop subsequently. Early on in the market's present move higher — just following initial launch — selling pressure was of little consequence. Hours of choppy trading still had an upward bias. You might call this a picture of "pent-up demand," given what followed (isn't hindsight wonderful?).

So, what might we expect following today's ape-driven charge to another buy-side RSI extreme?

Well, RSI's steep dive this afternoon to buy-sell balance (i.e. in the vicinity of 50) was a bit more pronounced than was last week's. And how about that intra-day price gap lower (occurring this afternoon in both the NYSE and NASDAQ Composite indexes)? What might these subtleties be saying about immediate prospects?

They're saying, "Expect pressure."

Go over to StockCharts and take a look at the various underlying technical measures I typically present here. What are they saying?

First, all is well. There's genuine interest on the long side of the trade. Yet underlying conditions also suggest a healthy pullback — a consolidation of gains — might be in order.

So, near-term, expect pressure to develop in anticipation of "the pause that refreshes" just prior to the explosion higher I suspect is days from unfolding.


Fast Money
* * * * *

© The Risk Averse Alert — Advocating a patient, disciplined approach to stock market investing. Overriding objective is limiting financial risk. Minimizing investment capital loss is a priority.

Analysis centers on the stock market's path of least resistance. Long-term, this drives a simple strategy for safely investing a 401(k) for maximum profit. Intermediate-term, investing with stock index tracking-ETFs (both their long and short varieties) is advanced. Short-term, stock index options occasionally offer extraordinary profit opportunities when the stock market is moving along its projected path.

Nothing is set in stone. Nor is the stock market's path of least resistance always known. More often than not, there are no stock index option positions recommended.


There's an easy way to boost your investment discipline...

Get Real-Time Trade Notification!