Let me ask you something... Do you think that, if i knew this week's trading would develop as it has, I would have bailed out of my Put position last Friday? A double could have been a triple! So, no, I would not have bailed if only I had known.
But I didn't know. What I did know was that, as fast as the market turned lower on Friday (6.6.08), it could have rocketed higher in a last-gasp advance just prior to everything falling apart.
This possibility was the basis for the S&P 100 Elliott Wave Count I presented last Saturday. Obviously, that view was wrong. Still, in the grand scheme of things nothing changes. Such is the nature of flexibility the Elliott Wave Principle affords.
Stocks are south-bound. This week's trading, if nothing else, suggests the destination is Key Largo.
Before I serve up today's meat and potatoes, I would like to tie a lasso around that anxiety you're probably feeling. You might be thinking that, given how far things have fallen apart, we should be swimming in profits. Yet, there's only been one trade recommended...
I don't know if you noticed over to the left, but I added a link to some thoughts about options trading you might find worth reading. I titled the piece, "How to Trade Options Using Warren Buffett's Two Rules of Investing."
I touch upon trading options with some realistic degree of certainty. This is key to speculating with these highly volatile instruments. It's then making money becomes "easy." Likewise, you make it harder to give it all back.
Let me show you something...

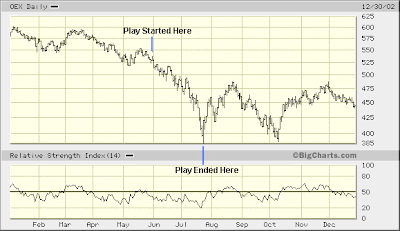
This is the period in 2002 when I took a tiny $500 stake and multiplied it to $20K. We're about to do the same thing during the stock market's imminent meltdown. This time, though, things will move a lot faster. Furthermore, once the market hits bottom, we'll be aggressively playing the first leg of the subsequent melt-up I am anticipating. That's when our 5-figure stake will become something over $100K.
The point I wanted to make simply is this: the S&P 100 was well into its decline before I made even my first trade back in '02. I wanted every bit of confirmation the stock market was about to crumble. I got this late April, 2002. Then, anticipating May's bounce, I waited until the market started turning over before I jumped in. Every step of the way following my entry was an exercise in prescience. It was an amazing play. And it was one of the easiest I have ever made.
So, if you are thinking, "Show me the money!," just relax. If you believe robbing an armored car is easy, then surely you're dreaming. You're forgetting ... "bulls make money, bears make money, and pigs get slaughtered."

A couple things I want to point out regarding where things presently stand...
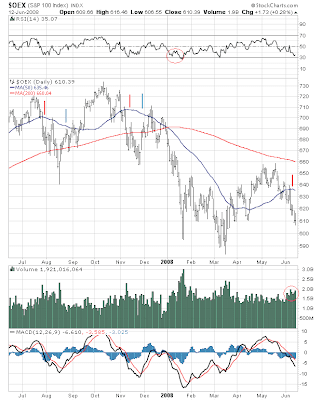
First, RSI ... It has reached a point where over the past year a bounce is to be expected.
Now, key in on this past January, 2008. This is a useful benchmark presently, because it demonstrates how things can fall apart subsequent to an RSI bounce from an oversold level.
Next, look at the S&P 100's behavior just after its 50-day moving average begins turning over. This you see marked by vertical red lines drawn on the above chart. Observe how the S&P 100 has had a tendency to bounce shortly after its 50-day moving average began moving lower.
Try not getting hung up on the specifics of what happened beyond the bounce during these prior periods. I just noticed this tendency with the 50-day moving average again turning over ... and I wanted to point it out because I believe the S&P 100 is about to bounce.
About the blue vertical lines you see... This should coincide with the first leg up in the stock market's pending melt-up. In other words, the market's pending collapse should largely be over in a matter of days.
One last thing I wanted to point out. Volume has been picking up relative to the post-3.17.08 advance. The urgency to sell high-capitalization stocks making up the S&P 100 index has been increasing. This confirms my outlook for a pending bloodbath.
Now, I could go into every technical detail I look at and show you how each reveals there is plenty of selling yet to come. However, this next chart will do...

It's a long way home... It's a long way home.
Last night on CNBC's Fast Money, Pete Najarian mentioned how the VIX has been holding above its 200-day moving average ... and pointed out how this has been a prelude to increased market volatility. Well, what do you know! This is exactly what I am expecting.

Could the stock market soon make back most of this week's loss? Could it happen on Friday?
That's what I think might be about to happen...
* * * * *
© The Risk Averse Alert — Advocating a patient, disciplined approach to stock market investing. Overriding objective is limiting financial risk. Minimizing investment capital loss is a priority.
Analysis centers on the stock market's path of least resistance. Long-term, this drives a simple strategy for safely investing a 401(k) for maximum profit. Intermediate-term, investing with stock index tracking-ETFs (both their long and short varieties) is advanced. Short-term, stock index options occasionally offer extraordinary profit opportunities when the stock market is moving along its projected path.
Nothing is set in stone. Nor is the stock market's path of least resistance always known. More often than not, there are no stock index option positions recommended.
 There's an easy way to boost your investment discipline...
Get Real-Time Trade Notification!


