Hey... Remember that Dukes of Hazard thing I did yesterday ... screeching the brakes on a crash event, doing a couple donuts and pealing off in the opposite direction?
Well, Yee haw! Let's do it again...
We have here today an Elliott Wave view whose love for a handful of July OEX 520 Puts is as deep as these slightly tarnished gems are out of the money.
Before I elaborate, let me just say I am truly delighted to have these jewels in my possession right now. Even if I am wrong about their worth astronomically exploding over the next several days, the odds they will ever become an albatross are about as near zero as can possibly be. This market is going lower. You can quote me on that.
Though still true that, "Lovers, Not Market Forecasts, Are For Marrying," there is every reason to believe the stock market did not hit bottom today. In fact, it did nothing but add further weight to all the evidence I have presented these past many weeks suggesting a giant thud is in store.
Now, once this meltdown finally comes to pass — be it now (as I am thinking today, knowing tomorrow to be sure is but another day), or some weeks away — an even bigger melt-up will in all probability follow. Let's not forget that.
Indeed, already my wheels are turning. What kind of cute headlines will I come up with when the market launches on its moon shot?
"Wall Street and Luskin Agree: Auto Industry Shutdown Good For America"
"$10 a Gallon Drained from Main Street Fuels Wall Street into Orbit"
"Dow Up 3 As Middle Class Wealth Pours into Market Celebrating Obama Landslide"
Alright, let's get back to the current act in the big show (or as Maria Bartoromo would say, giving it her best Ed Sullivan, "really big shew")...

If you have been following my Mr. Market Twitter, you might recall a certain anticipation I've had toward OEX RSI at 5-minute intervals. I've been expecting it to rise above its peak set last Thursday (6.19.08). Well, the wait is over.
Not that it happened today ... because, in fact, it didn't. Today's advance in the S&P 100 failed to carry RSI higher than last Thursday.
Rather, up until today I have been taking a slightly different view of the S&P 100's decline since last Tuesday's open (6.17.08). Now I consider the area marked in red on the above chart and see price-RSI performance that fits to a tee what an Elliott Wave Guy would expect.
Except for one thing... Last Friday (6.20.08) RSI registered a new, post-6.17.08 low. Normally, RSI would have come in above its low set on Wednesday, 6.18.08.
So, what did Friday's new RSI low suggest? The S&P 100 would sink lower still. And this it did.
Then today, too, the S&P 100 sunk even further ... doing so prior to RSI ever rising above its peak set last Thursday. This suggests the S&P 100 has still lower to go ... despite today's recovery.

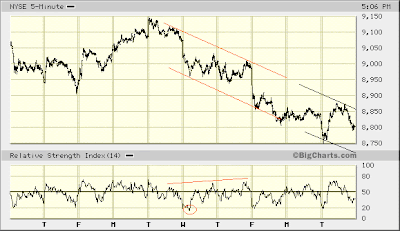
Contrast the NYSE Composite's performance following its peak last Tuesday (6.17.08) with that of the S&P 100. NYSE price-RSI performance is typical. RSI troughed at the moment I would expect and diverged as the NYSE Composite sunk lower.
Today's extension of the NYSE Composite's move lower ... prior to RSI ever rising above its peak set last Thursday ... likewise suggests the index will fall further still, despite today's recovery ... and despite RSI at the same time finally extending beyond its high last Thursday.

Earlier this month I presented my S&P 100 Elliott Wave count up to the May 19, 2008 peak. The above chart carries this forward.
Should this view be correct — should the S&P 100 be on the verge of collapsing to the area of 520 — its decline will unfold in five waves. The first two of these already have been completed.
The second wave you see — if my interpretation, indeed, is correct — is a very bearish formation. Seeing this just prior to what typically is the most powerful wave of five waves in either direction (i.e. the third wave) is like peanut butter jelly time. It says, "Look out below!"
If this view is correct, disregard the channel lines I drew on the same chart yesterday.
Last Friday's volume bump (or as Clouseau would say ... bimp) supports the likelihood the S&P 100 has further to fall.
So too does the fact no price-RSI or MACD divergence has even begun to form as the S&P 100 continues it fall from its May 19, 2008 peak.

Tom Petty sings... I'm free ... free fallin'.

Free fallin' ... free fallin'

As the movers and shakers of volatility do their best Kevin Bacon in Animal House, saying, "Remain calm ... All is WELL!"
Did you read my comments to the article titled, "Volatility 101" at optionMONSTER?
My initial thoughts are most definitely worth considering here.
If the stock market holds up for a while on Wednesday, I may just go all in.
I need to sleep on it, though...
* * * * *
© The Risk Averse Alert — Advocating a patient, disciplined approach to stock market investing. Overriding objective is limiting financial risk. Minimizing investment capital loss is a priority.
Analysis centers on the stock market's path of least resistance. Long-term, this drives a simple strategy for safely investing a 401(k) for maximum profit. Intermediate-term, investing with stock index tracking-ETFs (both their long and short varieties) is advanced. Short-term, stock index options occasionally offer extraordinary profit opportunities when the stock market is moving along its projected path.
Nothing is set in stone. Nor is the stock market's path of least resistance always known. More often than not, there are no stock index option positions recommended.
 There's an easy way to boost your investment discipline...
Get Real-Time Trade Notification!


