As those of you who are on my real-time trade notification list know, I sent out a heads-up late this afternoon indicating my interest in closing out my OEX Put position. Let me explain why.
Despite calling NASDAQ the stock exchange favored by boiler rooms all across America — fertile ground for executing Wall Street's tried and true pump and dump schemes — some things about trading on this electronic exchange are nevertheless useful to my analysis. Specifically — and we saw this quite graphically from October 1998 through March 2000 — NASDAQ offers a fine way of measuring irrational exuberance.
What is irrational exuberance? Well, if I could put it quite simply, I believe it is a tendency to risk investment capital while remaining oblivious to any danger of losing significant sums of money.
There was a lot of irrational exuberance when the calendar rolled over to the year 2000. At the time I was making a considerable effort trying to convince anyone who would listen why I believed the period from 2000-2002 was shaping up to be a rough one in the stock market.
What I discovered was that, not even the simplest historical facts were persuasive to most people who took in my message.
For example, never before in the stock market's history had the averages risen 20% or more for three years straight, let alone five, such as happened from 1995-1999. People simply thought the stock market's incredible moon-shot would go on forever. You would have thought by suggesting extreme caution I was instead asking they lay on a bed of hot coals!
Irrational exuberance was dominating their expectations, making them prime candidates, indeed, for the beating the stock market subsequently delivered. Too bad.
So, what's this got to do with the present moment?
Well, you might recall on May 15, 2008 I presented "Another Not-So-Kudlow-esque Chart Fest," wherein I pondered the NASDAQ's "leadership conundrum." I sought to qualify just how NASDAQ leads the stock market in both directions. At the time it was plainly leading the stock market higher ... and yet, I was convinced this was not about to evolve into a melt-up.
Instead, I believed trading on NASDAQ was reflecting the sort of irrational exuberance we have seen before — even recently — just prior to the stock market topping.
So, I presented a contrast of the NASDAQ Composite and the NYSE Composite leading to last October's top.
You should go back and review my analysis, because I suspect we are witnessing a repeat performance.
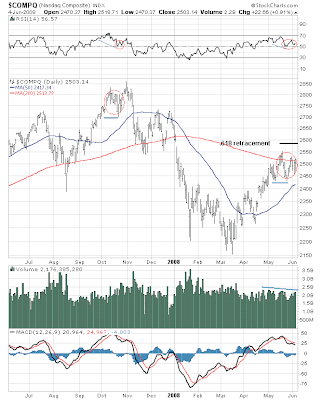
Truth is the NASDAQ Composite has been behaving more constructively than the NYSE Composite since the May 19, 2008 top ... just as it had been in the run-up to this recent peak. Until today I was supposing NASDAQ simply was taking its sweet old time catching up with the NYSE ... thinking it would do so sooner rather than later. Now, however, I am not so sanguine. I think some days will pass before the stock market collapses. This is why I want to take profits on my OEX Put position.
Let's look at an up-to-date view contrasting recent action on the NYSE versus NASDAQ...

The blue horizontal lines I've drawn are only to show the depth to which the NYSE Composite initially fell after topping last October '07 and again on May 19, 2008. You see just how much of the prior advance the index gave back.
Now, contrast the NYSE Composite's performance — both last October and at present — with the NASDAQ Composite.

First, neither last October '07, nor at present did the NASDAQ Composite retrace as much of its prior advance as did the NYSE.
You also see a similar pattern forming in both NASDAQ's price action and RSI comparing the present period to last October. This suggests the index might still rise to a new, post-3.17.08 high (say, to 2583).
Contrarily, the NYSE Composite should fail reaching a new, post-3.17.08 high ... that is if last October's performance is any indication.

Just like last October, the large-capitalization S&P 100 index has been conspicuously under-performing the broader market.
So, in the spirit of thinking "the trend is your friend" the similarity of the present period with last October suggests the stock market should find some "legs" before turning over with a vengeance.

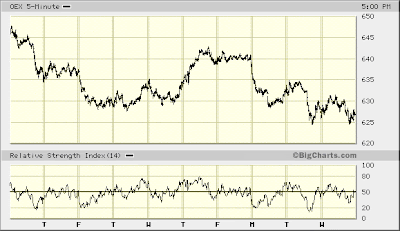
I am inclined to believe the S&P 100 will sink lower than it has thus far reached this week before turning higher in a last ditch attempt to forestall the inevitable. This probably will be when I bail out of my OEX Put position.
Just how and when this short-term bottom might be reached I cannot say. If the S&P 100 should rise from here before turning lower, it should not advance much beyond 635. And once the S&P 100 does turn lower (and I'm confident it will), look for the index to sink below 620 ... possibly even falling to as low as 610 (wouldn't that be sweet).
Keep your eyes open for an e-mail from me. I will send you notification when I am ready to close out my position...
* * * * *
© The Risk Averse Alert — Advocating a patient, disciplined approach to stock market investing. Overriding objective is limiting financial risk. Minimizing investment capital loss is a priority.
Analysis centers on the stock market's path of least resistance. Long-term, this drives a simple strategy for safely investing a 401(k) for maximum profit. Intermediate-term, investing with stock index tracking-ETFs (both their long and short varieties) is advanced. Short-term, stock index options occasionally offer extraordinary profit opportunities when the stock market is moving along its projected path.
Nothing is set in stone. Nor is the stock market's path of least resistance always known. More often than not, there are no stock index option positions recommended.
 There's an easy way to boost your investment discipline...
Get Real-Time Trade Notification!


