Let me guess... You're wondering whether the stock market is "oversold." You're concerned there seems to be a great deal of negative sentiment in the mainstream ... the kind of thing typically coinciding with a market bottom.
You're thinking that, because Herr Kudlow polled his twelve disciples on Friday asking whether "the stock market is doomed," this could mean the market is imminently poised to reverse and bolt higher. Yes, there was the fact that, four of the Kudlow twelve answered in the affirmative. That's contrary indication enough it would seem. Yet, that this question was even publicly aired should be considered a buy signal, no?
Indeed, one of Kudlow's guests on Friday suggested so much! And I am rather glad he did. Do you know why? Well, how about I give you three guesses, and let's just say for the fun of it the first two don't count.
Alright, I'll make this easy for you...
What was revealed by relatively low volume of shares traded during the market's advance from March 17, 2008 through May 19, 2008? What was the reason shares were not increasingly being offered up for sale as the market rose during this period?
Remember ... the so-called "wall of worry" is not demonstrated by idle chatter on CNBC coming from analysts who wouldn't know "oversold" from "over-hyped." Rather, it is revealed by increasing volume of shares traded as the market rises.
And since precisely the opposite occurred as the market rose from March 17th through May 19th, what conclusion can be made about the market's underlying tenor?
Owners of trillions of dollars of equity evidently were not worried. What, then, was driving their behavior opting to hold rather than sell?
It was the same psychological disposition demonstrated by that one member of the Kudlow crew who reflexively assumed the market must be at or near bottom simply because scary Larry asked whether "the stock market is doomed."
This commentator's knee-jerk reaction plainly is further evidence of an embedded attitude one should find rather peculiar at a time when tensions on several fronts are increasing. The word I use to describe this is complacency.
Oh, just you forget about that $3.5 trillion sitting on the sidelines in money market accounts. It's there because investors are having the hardest time deciding which smoking sector of the stock market is worth risking life and limb, right? With so many "sure thing" opportunities, the owners of all that cash just don't know where to begin, right?
WRONG.
Remember this demonstration of how complacency is persisting even at this late hour. Over days straight ahead you are likely going to see it evaporate. The gnashing of teeth will in all probability become deafening.
Watch Maria go from her usual squeaky, "hot for action," hype torrent ... to a downbeat Prozac poster child moaning about relentless selling she worries might never end. That's when bottom will be in sight.
As of Friday's close, the stock market is by no means oversold. Rather, it is perfectly poised to come unglued and bring some really nice bank to those who are long July OEX Put options.

If one company representing 20% of all U.S. retail sales (Wal Mart) is considered a relevant benchmark of how the consumer is doing, then one stock index consisting of only 30 stocks representing 30-40% of the U.S. stock market's total capitalization also is a relevant indicator of how one of the riskiest financial assets is faring on the slippery slope where greed and fear intermingle in constant pursuit of capital appreciation.
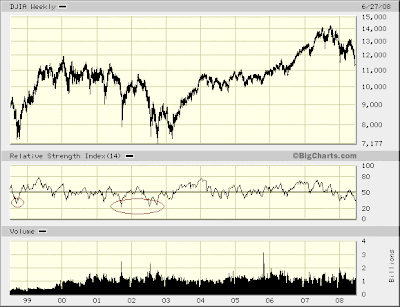
Weeks ago I argued the similarity of the present period to 2001 and 2002 ... with regard to what weekly RSI performance one could reasonably anticipate in the then-yet-to-unfold capitulation.
As projected, weekly RSI lifted to the area of balance between buy-side and sell-side strength (i.e. 50). And now, as forecast, the lug nuts are coming off the market's wheels. The Dow Industrials have broken to a new, post-summer '07 low with weekly RSI about as close as can be to confirming the move lower.
However, our concern right now is whether the stock market is oversold. What answer is given by RSI registered in 2001 and 2002 (let alone 1998)?
That's right... It's a resounding, "Look out below!"

Now you see why I presented the chart of the Dow Jones Industrials first. Simply by adding another 70 shares to come up with the S&P 100 index, the picture might not seem quite as conclusive.
However, considering the stark similarity of [weakening] RSI performance leading to the top in 2000, and then again in 2007 ... with sell-side strength subsequently becoming well-established then, as now ... eventually leading to an RSI bounce to a position of balance (i.e. 50) then, and now (coinciding with the S&P 100's May 19, 2008 peak) ... and, finally, a turn lower in the index taking RSI to a relative sell-side extreme then, and now still to come...
Possibilities presently before us are amply projected by what occurred in 2001 and 2002.
Bottom line... The S&P 100 is nowhere near an oversold extreme.

Broadening our view of the entire stock market, we see much the same picture looking at the NYSE Composite ... from the formation of its top last year ... to its subsequently establishing sell-side strength ... to its recent bounce taking RSI to a point of buy-side and sell-side balance ... and now to its resumption of weakness.
Again we see the NYSE Composite also has yet to register a weekly RSI reading one could call an "oversold" extreme.
But what should we make of the fact the NYSE Composite has yet to sink below its January/March '08 low?
Is this significant? Or is the fact broad-based selling has yet to sweep across the stock market simply indicative of underlying complacency?
Before I answer this as definitively as the wider array of underlying technical measures allows, let's broaden our view to include all issues traded at the Pump and Dump...

It's pretty much the same story as we saw with the NYSE Composite.
So, what do we make of the fact broad measures of "the stock market" such the NYSE and NASDAQ Composite have yet to break to new low ground for the year, where as large-cap indexes have?
Is a base possibly forming from which the market will resume its advance, carrying indexes beyond last year's peak? Are price-RSI divergences signaling a bottom, much as happened late '02, early '03?
Well, first of all, price-RSI divergences presently are tentative and not yet as well-established as they were during the late '02, early '03 period.
Second, index declines back in '02 had resulted in RSI falling to extreme levels reflective of a capitulation, where one could claim stocks were oversold. This has yet to happen in the present period.
And third, in the process of forming price-RSI divergences none of the above indexes were setting new lows early in '03. Contrarily, the Dow Industrials and S&P 100 just this past week fell to new lows, subsequent their '07 peaks.
So, my view of things taking a longer-term perspective is that all indications of complacency persisting are finding indexes with plenty of room to crush whatever hope is breeding fearlessness in the face of deteriorating technical underpinnings reflected by RSI performance.
Now let's move the view in a bit...


Nice pick-up in the volume of shares traded Friday. In other words, selling interest in the current period is accelerating. NASDAQ, particularly, showed a great deal of weakness despite only falling a quarter percent.
Do you see any technical divergences in RSI or MACD? Me neither.
Do you know what that means?
The trend is your friend.

CBOE Put/Call Ratio ... Perfect. By no means is there any indication bearish sentiment is extended.

VIX ... Excellent. Holding above its 200-day moving average. Recall Pete Najarian noting this condition typically signals a period of heightened volatility. Coincidence? I think not. Again, we see no indication bearish sentiment is extended.

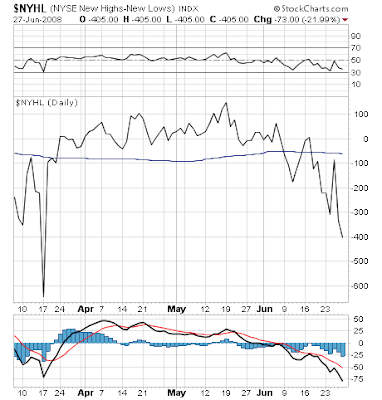
NYSE New 52 Week Highs-Lows ... Outstanding. Slowly ratcheting lower ... accelerating its descent each step of the way ... confirming the move lower in the index.

Ditto NASDAQ New 52 Week Highs-Lows.
Both NYSE and NASDAQ still have further to fall before New 52 Week Highs-Lows challenge negative levels reached over the past year. We might realistically expect some bullish divergence to develop, if the current period is setting up the stock market for a melt-up — all forthcoming negative conditions reflective of capitulation notwithstanding.
Onward...
NYSE McClellan Oscillator ... Oh! Nice. Recovery barely discernible despite Friday's seeming resistance to continuing Thursday's smash.
What about the oscillator's developing divergence over the past two weeks while NYSE has continued declining?
Uhhh... What date has the oscillator been diverging from? That's right: June 6, 2008 ... the day the Dow was crushed for 400 points.
And was the market's decline on June 6th nearer the beginning or the end of its present move lower? That's right: it was nearer the beginning.
So what does this mean? It means the worst is yet to come. In fact, I believe it is right at the doorstep.
NASDAQ McClellan Oscillator ... Beautiful. It too barely budged on Friday, despite mistaken appearances the NASDAQ Composite might be trying to bottom.
I suspect both the NYSE and NASDAQ McClellan Oscillators are perfectly poised to exhibit that fuller measure of capitulation I have been forecasting for some weeks now. By all appearances, the various measures you see on the McClellan charts provided by DecisionPoint are near to registering new low readings over the period since last summer when the market's current consolidation began. Such would demonstrate capitulation.
Granted, the Summation Index has some way to go. However, so too do the NYSE and NASDAQ Composite indexes. Both are vulnerable to continued selling, with the period marking the worst underlying technical tone since last summer quite likely imminent.

I would LOVE to see the downwardly sloping channel containing price action following Thursday morning's thud continue holding up. Such a configuration would set up quite nicely for a couple days of relentless selling.
Are you ready dear Maria?
I told you this was going to be a turkey shoot! But no, you just couldn't stop listening to all your big shot broker friends, could you? Pity.
I can barely believe how perfectly everything continues falling into place. Still, I haven't forgotten anything can happen. Nothing is set in stone.
All due humility notwithstanding, though, the Elliott Wave Guy's July OEX Puts are looking rock solid...
* * * * *
© The Risk Averse Alert — Advocating a patient, disciplined approach to stock market investing. Overriding objective is limiting financial risk. Minimizing investment capital loss is a priority.
Analysis centers on the stock market's path of least resistance. Long-term, this drives a simple strategy for safely investing a 401(k) for maximum profit. Intermediate-term, investing with stock index tracking-ETFs (both their long and short varieties) is advanced. Short-term, stock index options occasionally offer extraordinary profit opportunities when the stock market is moving along its projected path.
Nothing is set in stone. Nor is the stock market's path of least resistance always known. More often than not, there are no stock index option positions recommended.
 There's an easy way to boost your investment discipline...
Get Real-Time Trade Notification!


