Now, it's not that the market's current technical state glaringly suggests such an outcome could be imminent, although it might be. No doubt, a deep shock occurring sooner than most imagine is a probability technically well-established to be sure. Yet at present appears decided technical weakness with no sign of abating. The question is could selling evidently in store sink indexes in a way challenging—invalidating—recent Elliott wave views?
I rather suspect this could happen. Like I said, a "rising wedge" forming off early-October 2011 bottom is but one, valid Elliott wave possibility. There are others.
Still, should any imminent decline force the issue, what revised wave count then would become necessary might be usefully anticipated simply making a slight alteration to specific, prevailing assumptions in the post-Y2k period. Here, too, there is supporting evidence substantiating this particular wave count's probability.
The simple change here finds a "double three" corrective wave forming in the S&P 500 since Y2k. Nothing is stretched in the least to make this a valid Elliott wave count. Like I just said, too, there is additional evidence raising this perspective's probability.
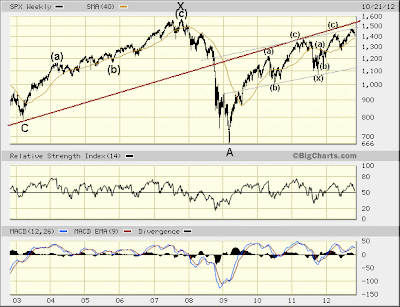
Per the S&P 500's "double three"—a so-called "complex" Elliott corrective wave—forming since Y2k, the first a-b-c [down] unfolded from 2000-2003. This took the form of a 3-3-5 "flat." The connecting "x" wave unfolded from 2003-2007. Since then the second a-b-c has been forming.
The Elliott Wave Principle's "alternation guideline" suggests the second a-b-c is likely to form a 5-3-5 "zig-zag" down (alternating from the 3-3-5 "flat" forming the first a-b-c). The zig-zag's first 5 waves down unfolded from October 2007 - March 2009 to form wave A. Unfolding off March '09 bottom, then, is the zig-zag's "b" wave.
Now, the above view detailing the prospective component waves forming the zig-zag's "b" wave is not "new." A "double zig-zag" forming into March 2012 top was one of the more recent Elliott wave count possibilities among several considered here over the past few years. As it stands, too, this "double zig-zag" now appears destined to extend into a "triple zig-zag." Indeed, it's even possible this extension already has occurred, ending at the S&P 500's September 2012 peak. Yet, as there are technical disparities arguing against this, let's assume the third and final zig-zag [higher] forming wave B could lie in wait.
Admittedly, the above view on the S&P 500's advance off March '09 bottom is tentative. Yet certain are a couple things. First is the dynamic line of support/resistance whose significance in relation to the S&P 500's evolution since the 1970s remains formidable. Second is the fact the S&P 500's October 2007 peak will not be exceeded if a "zig-zag," indeed, is forming off it. At the very least this latter consideration thus raises prospect wave B up from March '09 bottom in fact is nearing its end.
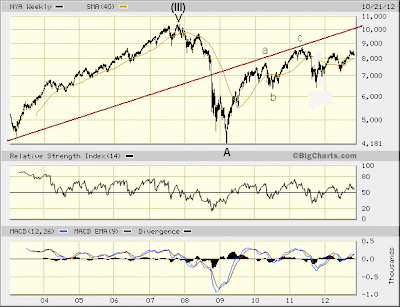
As I said, there is additional evidence supporting this view. The NYSE Composite Index—long displaying relative weakness itself—finds the moment's decidedly weak technical state shedding a more troubling light on its otherwise notable disparity versus the S&P 500's performance, particularly given its new found resiliency in the face of softness sinking the market's recent leaders. Weak hands holding on for dear life in the midst of fading cover (i.e. sinking leaders) portends near-term fortunes possibly turning sour. Long a laggard and, quite possibly, imminently the more, circumstance inexorably pointing the market toward its broad-based decimation could be significantly furthered over the immediate period.
Of foremost significance is the fact that, in 2007 the NYSE Composite Index is seen completing a 5-wave advance from its 1974 bottom. The line drawn above approximates the lower boundary of the Elliott channel containing this advance. As you can see, too, much like the S&P 500's dynamic line of support/resistance, this former dynamic line of support in the NYSE Composite Index likewise has proven formidable resistance ever since it gave out in 2008. Whether resistance again might be tested, indeed, is in doubt. The broad market's noteworthy lag, this notwithstanding a whole lot of love, in fact could prove entirely problematic should the market's already thin leadership decidedly lose its luster, as has been occurring of late.
Now, just because the NYSE Composite Index strongly suggests its 2007 peak will not be exceeded before its March 2009 low is taken out, this does not infer the same outcome per the S&P 500. Indeed, we could see the overall market more or less holding up over the next several years, and this to the effect finding the S&P 500 contained by its overhead, dynamic resistance in a slow, upward march to new all-time highs, while the NYSE Composite remains a decided laggard, failing to rise above its October 2007 peak. As the past couple years have been a lesson in political determination to sustain the resiliency of markets, prospect this could continue for some years longer before finally succumbing rightly should be regarded a legitimate possibility.
Yet succumb, eventually, the market quite likely will. Physical reality forged in hyperinflationary breakdown—an "inexplicable" phenomenon behind continuing corporate retrenchment—only will accelerate movement toward political reform whose call for restructuring is sure to unmask an emperor with no clothes. Obviously, Europe is on the front line. Seems to me even the mere appearance of credible resistance to the hyperinflationary bailout/austerity regime could blow the lid off the trans-Atlantic banking system and send financial markets reeling.
Truth is even at this very moment something quite nasty could promptly develop, all reservations to the contrary aside. The market's current technical state certainly appears foreboding, and with plenty of negative evidence accumulating over the past few years providing more than enough reason, really, to fear the worst, the above Elliott wave count possibility presents a perspective wherein disaster could be just around the corner. Forewarned is forearmed.

* * * * *
© The Risk Averse Alert — Advocating a patient, disciplined approach to stock market investing. Overriding objective is limiting financial risk. Minimizing investment capital loss is a priority.Analysis centers on the stock market's path of least resistance. Long-term, this drives a simple strategy for safely investing a 401(k) for maximum profit. Intermediate-term, investing with stock index tracking-ETFs (both their long and short varieties) is advanced. Short-term, stock index options occasionally offer extraordinary profit opportunities when the stock market is moving along its projected path.
Nothing is set in stone. Nor is the stock market's path of least resistance always known. More often than not, there are no stock index option positions recommended.
 There's an easy way to boost your investment discipline...
Get Real-Time Trade Notification!


