Let me tie together two thoughts presented this week. I'd like to answer the question, if the NASDAQ Composite were to fall to levels last seen in 1987 sometime over the next 1-3 years, what objective might the Dow Industrials reach (and similarly the S&P 500)?
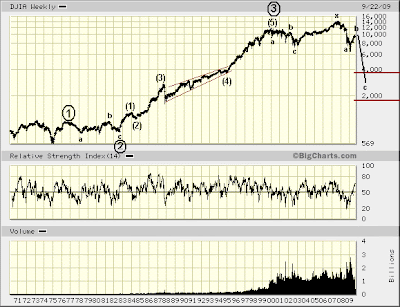
My reason for asking is because yesterday's shocking NASDAQ forecast might appear out of line with Tuesday's Dow Jones Industrials' long-term RSI analysis. This seeming disparity, though, is easily resolved simply applying an alternate Elliott wave count to the Dow Industrials.

Rather than supposing wave 4 of five waves down from October '07 has been forming since November '08, wave B of an A-B-C down from October '07 is seen instead.
Due up next, then, is wave C, whose pending decline — rather, more likely, collapse — would fit both current NASDAQ forecast prospects, as well as Elliott Wave Principle guidelines.
Were the Dow Industrials since topping January 2000 seen forming a 4th wave [of 5 waves up since 1974], then the EWP suggests the target for this 4th wave is the range of the fourth wave of one lesser degree. This projects a price level for the Dow 30 somewhere between where it traded from 1987-1994. That's ballpark 1700-3600. A rather wide range, no doubt. Yet much lower than presently either way.
The Dow's currently forming 4th wave alternates in complexity with its 2nd wave (1975-1982), thus satisfying the Elliott Wave Principle's "rule of alternation."
And considering the very long-term Dow Jones Industrials trend ... over the next couple years the Dow could fall well below 3600 yet still remain solidly in an uptrend.
Were a collapse forthcoming, it is likely NASDAQ's trend leadership role would continue. In other words, the NASDAQ Composite probably will be drained far more deeply than the Dow 30 once ultimate bottom to the present, negative, intermediate-term trend (starting October '07) is reached. So, although levels last seen following the 1987 stock market crash could be $COMPQ's fortune, $INDU could fare considerably better. How much so, practically speaking, probably will amount to only a slightly lighter shade of despair for most investors, however.
Finally, there is nothing saying the stock market's collapse is imminent. In fact, there's a better case to be made that, a period during which underlying weakness builds likely will first develop before rightful expectations for imminent collapse are reasonably entertained. Wasn't this one lesson of 2008?
Thus, we return to the important, psychological matter of defending March '09 bottom, because a failure of this bottom implies a failure of the lender of last resort in stabilizing a broke down Ponzi scheme. So, it seems most reasonable, then, that near-term support be expected at March '09 lows.
With this in mind we are wise to be on the lookout for price action extending the formation of what I labeled above as wave B, unfolding since November '08. There's nothing saying major indexes cannot trade sideways (in a very wide range, percentage-wise) for another year or more before finally collapsing.
No doubt, major indexes have bounced about as far as was thought possible many months ago. Nevertheless inquiring minds want to know: is top to this move in? Maybe yes, maybe no. Maybe underlying technical weakness must grow further before one can confidently claim top has been reached, though.
Still, no matter, wave B's completion might further await 3-waves down, testing March '09 support (or possibly smashing right through it), followed by 5-waves up ... or some other Elliott corrective wave variation.
Similarly, there's nothing saying that, following NASDAQ's reaction back up to its head-and-shoulders neckline, its subsequent decline to its minimal objective likely will occur with haste. Indeed, there is every reason to anticipate resistance toward this inevitable trend lower, allowing as many suckers as possible to be put in position for ultimate abuse once the lug nuts finally come off. So, here too, we have reason to look forward to collapse without supposing it is imminent.
By the way ... being that levels last seen in 1987 are the objective portended by NASDAQ's head-and-shoulders top ... this targets the vicinity of 300 in $COMPQ.
Preposterous you say?
No, preposterous is believing a mountain of unproductive debt built up over decades while physical economy was allowed to shrivel away can possibly be sustained indefinitely.

* * * * *
© The Risk Averse Alert — Advocating a patient, disciplined approach to stock market investing. Overriding objective is limiting financial risk. Minimizing investment capital loss is a priority.
Analysis centers on the stock market's path of least resistance. Long-term, this drives a simple strategy for safely investing a 401(k) for maximum profit. Intermediate-term, investing with stock index tracking-ETFs (both their long and short varieties) is advanced. Short-term, stock index options occasionally offer extraordinary profit opportunities when the stock market is moving along its projected path.
Nothing is set in stone. Nor is the stock market's path of least resistance always known. More often than not, there are no stock index option positions recommended.
 There's an easy way to boost your investment discipline...
Get Real-Time Trade Notification!


