Over at the DecisionPoint website is Carl Swenlin's Chart Spotlight, where one can find Carl's weekly read of that solid dose of technical information he compiles and publishes daily. Great site. Excellent "big picture" stuff for an Elliott Wave guy.
A couple months have passed since I last read Carl's stock market outlook. I am fascinated to learn he is bullish. He sees the S&P 500 going to 1200. However I disagree with his basis for presently switching to a positive outlook.
Following is my bearish perspective borrowing from his Very Bullish Indicator (August 7, 2009) ...

First, the inverse head-and-shoulders bottom Carl reports is cast into doubt by the fact that, 1). the right shoulder lacks symmetry with the left and 2). no breakout volume upon upside neckline penetration was registered late-July. These (at least according to the gospel of Edwards and McGee ... chapters 6-7) are prerequisite. So, that's my head-and-shoulders think. The claim doesn't have a leg to stand on.
Now, per Carl's noting a technical similarity presently with mid-year 2003 ... why then? Might not better similarity be found at the peak of the post-9/11 bounce? From my Elliott Wave perspective this is rather the case.
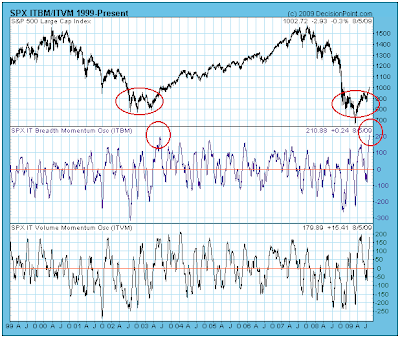
Presently ... much like the post-9/11 period ... breadth and volume momentum similarly are signaling another wave down.
Observe how positive breadth and volume momentum readings exceed all prior, respective readings during each period's preceding decline. Thus, we see the very same momentum setup now as a result of the post-March '09 bounce (relative to best momentum readings during the prior, post-October '07 throttling) as was the case late-2001 (near the top of the bounce following the post-Y2k, Chip Diller love fest).
Fact: the S&P 500's recent collapse was more brutal, and price-wise, more damaging, than was the 2000-2001 decline. Still, respective breadth and volume momentum held up better in the more recent period. Plainly, though, both measures can produce, and have produced worse readings. So, we have fair warning, then.
Likewise, given the magnitude of last year's stock market collapse, as well as the last six months' recovery, such an incredible rebound in breadth and volume momentum smacks of irrational exuberance born of prior bull market thinking.
Thus, technically demonstrated presently is a similar market psychology as existed late-'01, early-'02.
The spectacular momentum resurrection from deeply oversold to steeply overbought readings coinciding with a meager bounce in the S&P 500, relatively speaking, is another common thread, post-March '09 and post-9/11.
Indeed, the S&P 500's present recovery, relatively speaking, is notably more meager than the post-9/11 rebound. So, upon observing that both momentum measures, in fact, have before produced readings worse than anything yet registered since October '07 (specifically, back in '01 and '02) there's but one word needed to summarize the highly probable outcome presently being telegraphed...
Yikes.

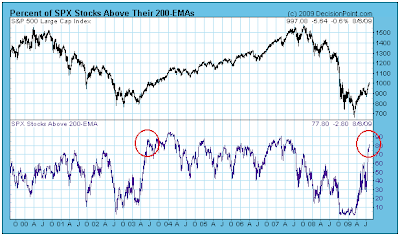
Here's why I question the above similarity in technical condition Carl indicated via red circles...
July '02 - March '03 clearly demonstrated the technical stuff of a bottoming process, this via the improving percentage of S&P 500 stocks trading above their respective, 200-day, exponential moving average. Subsequent to this bottoming process ... it was liftoff for the S&P 500 index.
Contrast this with underlying conditions going into March '09 bottom, however. Little of anything indicating technical improvement. Rather, everything remained as it had been for months: flat on its back.
And subsequently?
Much like the post-9/11 bounce ... there's a technical air of "Save Our Ship."
* * * * *
© The Risk Averse Alert — Advocating a patient, disciplined approach to stock market investing. Overriding objective is limiting financial risk. Minimizing investment capital loss is a priority.
Analysis centers on the stock market's path of least resistance. Long-term, this drives a simple strategy for safely investing a 401(k) for maximum profit. Intermediate-term, investing with stock index tracking-ETFs (both their long and short varieties) is advanced. Short-term, stock index options occasionally offer extraordinary profit opportunities when the stock market is moving along its projected path.
Nothing is set in stone. Nor is the stock market's path of least resistance always known. More often than not, there are no stock index option positions recommended.
 There's an easy way to boost your investment discipline...
Get Real-Time Trade Notification!


