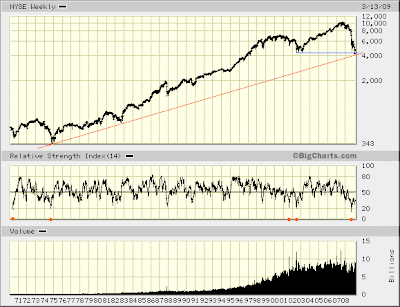
This is a good time to revisit the big picture. Despite the stock market's decent bounce this week, the consensus doubts upside possibilities. Most everyone considers this week's turnaround "a bear market rally," with the typical projection calling for a 20-25% gain.
I, on the other hand, suspect any bear market rally could be three times better than what consensus thinks. Likewise, there is plenty of reason to believe this week's trading kicked off this anticipated move higher.
Taking a cursory look at the big picture — seeing the past two years' decline in relation to the uptrend unfolding over the prior thirty — you see the case for an intermediate-term bottom being at hand, as well as gather upside prospects over the months ahead.

The long-term uptrend in the NYSE Composite very much remains intact. Likewise, the threat finding the index presently at a critical juncture in its long-term uptrend largely is disarmed in light of RSI.
Note how whenever RSI reached a deep, sell-side extreme (20 or below) a rally of considerable dimension soon followed. This was true even in 1970 ... in the midst of what essentially became a sideways trading market lasting many years ... whose worst was yet to come (much as is presently considered likely).
Another positive supportive of bottom is the present price-RSI divergence registered relative to November '08. This condition suggests underlying strength is building. That this is occurring at the very point where the NYSE Composite is meeting its long-term uptrend line is significant, if only for the fact I could not possibly be the only vested interest who recognizes opportunity in this technical development.

Tying a ribbon on the bull case is the NASDAQ Composite's failure to break below its October 2002 low. Although this is a double-edge sword, its significance for the time being positively affirms the existence of animal spirits necessary to sustain a bull run.
How is this a double-edge sword you wonder? Well, start with the simple fact NASDAQ's long-term uptrend has been broken. NASDAQ, being seen a trend leader, is, longer-term, pointing down. Further compounding this negative longer-term likelihood is the simple fact NASDAQ's performance divergence relative to NYSE — now versus October 2002 — reveals a measure of fearlessness not typically rewarded.
This same circumstance was observed last July. Then, the NYSE Composite fell to a new, post-October 2007 peak, low ... whereas the NASDAQ Composite failed to do so. Subsequently, the market caught a bid ... after which, however, everything came unglued.
By the fact NASDAQ presently is holding up relative to the Big Board — now versus October 2002 — the same outcome is thought likely. At present the market should find a bid. Only later, after rallying more than most presently are anticipating, is it likely to experience a further unraveling.

The three lines drawn above are strictly curiosities. The red line I find most interesting. Its upside penetration via a gap higher might be the near-term trend that's your friend.
This might seem crazy, but could unfolding price form in a stock index, like NASDAQ, resulting from the implosion of structured finance bear some natural similarity to the manner in which gas is distributed by the implosion of a star? Is the dispersion along the center line (i.e. the red line) about to widen, first to the upside, then to the down?
If NASDAQ gaps above the red line and rises to the blue line, might it likely react back to the red line? (Seems probable, given past performance.)
And following such a reaction, might any resumed move higher result in NASDAQ gapping above the blue line? (By this time NASDAQ's 200-day moving average should lie in the vicinity ... and any gap above this widely-followed moving average would likely bring in more suckers than you can shake a stick at ... perfectly setting the stage for the unraveling projected to follow.)
Now, here's the kicker. NASDAQ's advance to the green line could be a done deal before summer is out. And look where an advance of this magnitude would carry the index: right back to the rising trend line it broke below last October.
With markedly improved underlying technical conditions making a strong case for bottom, the projected bid bringing to fruition the prospective view presented here obviously has only but begun to materialize. NASDAQ's gap above the red line could be imminent. Indeed, the well-hedged, short equities trade remains ripe for the squeezing...

If the squeeze is not applied during upcoming March options (and futures) expiration week, then it likely will come sometime shortly thereafter.
Now, others read the CBOE Put/Call Ratio as indicating excessive bullishness here. I, on the other hand, see short equity position hedging that's ripe for the squeezing. Time will tell. And I believe in no time at all we will know for sure...


* * * * *
© The Risk Averse Alert — Advocating a patient, disciplined approach to stock market investing. Overriding objective is limiting financial risk. Minimizing investment capital loss is a priority.
Analysis centers on the stock market's path of least resistance. Long-term, this drives a simple strategy for safely investing a 401(k) for maximum profit. Intermediate-term, investing with stock index tracking-ETFs (both their long and short varieties) is advanced. Short-term, stock index options occasionally offer extraordinary profit opportunities when the stock market is moving along its projected path.
Nothing is set in stone. Nor is the stock market's path of least resistance always known. More often than not, there are no stock index option positions recommended.
 There's an easy way to boost your investment discipline...
Get Real-Time Trade Notification!


