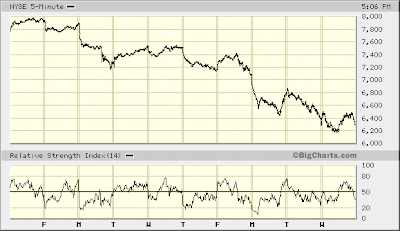
A couple of interesting developments today...

First, volume picked up. Given the relatively narrower range of trading today, this raises an eyebrow. I would initially have expected volume to contract. But it all makes sense now.
Following the closing bell, Bob Pisani reported a pick-up today in the bid for stocks ... something that has been absent of late.
Now, you might think, "Big deal, the market still finished down again." Yet I think you might be overlooking the significance.

This morning seems like a million years ago, but you might recall the monetarist monkey freak show prior to today's opening bell. Pre-market futures went on a wild ride, settling near the morning's lows.
Ding, ding, ding ... the market opened for business ... and not unexpectedly it sold off. Yet the carnage was not nearly as bad as pre-market futures were indicating. Indeed, within five minutes stocks were being bid up, taking indexes into positive ground. Joy! The first sign of a serious bid.
Of course, the buying contingent could count on nervous Nellys offering up more shares, so the market subsequently drifted lower. Then, bam!, the second round of buying came in.
Not to get carried away, buyers stepped aside again and let the Nellys have it their way going into the close.
So, volume picking up today indicates buying interest appears serious. That's a good sign for anyone sniffing for a bottom. However, something else happened today. And this serves to temper the urgency of establishing long positions...

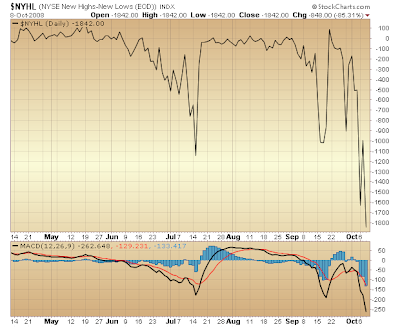
You've heard of "throwing out the baby with the bath water?" Well, here's the picture of what this looks like. This is but one among many current technical profiles of "capitulation."
What's more here ... this past Monday's (10.6.08) steep widening of the differential between new 52-week highs and lows gave strong indication the market's bottoming could turn out being a "process" ... taking some time ... while various technical divergences develop. Today's further widening of the high-low differential goes some way toward confirming this probability.
Again, the surprising development today on this technical front simply is that the high-low differential widened on a relatively milder day of selling on the NYSE ... one that took the Composite Index only modestly lower.
The one thing really worth noting is how today's widening of the high-low differential reflects an altered complexion of the market's underlying sentiment. Prior to this week, how many times did the NYSE Composite sink lower and yet the high-low differential diverged? This was, indeed, the rule, rather than the exception! Yet today the NYSE barely reached new low ground and the high-low differential widened. Why?
Because nervous Nellys were throwing out the baby with the bath water! That's capitulation.
But, again, this raises the probability the market's bottoming will be a process. In other words, bottom will take some time to form — some days ... maybe up to a few weeks. So, don't get all excited if a nice bounce should soon develop. Whatever gain is made probably will be given back ... possibly sinking indexes a little lower than they already have fallen thus far ... and resulting in technical divergences galore.
(Any pending bounce probably will take the NYSE Composite to the vicinity of 6800-ish, which is where it closed on Monday, 10.6.08. The same relative area would be where other major indexes could bounce, as well. Again, following this, expect a re-test of the lows from which this bounce begins. Might these lows be today's? Maybe so, maybe not ... no matter ... because they're not far away.)

Yet another picture of the baby being thrown out with the bath water...
Regarding the NYSE Bullish Percent Index gapping lower these past couple weeks... this sure do confirm the Elliott Wave count I presented yesterday ("c" waves, being third waves, typically are the most dynamic). Yes sir, this measure shows a dynamic bout of selling was sweeping across the market these past couple weeks.
Boy, was I reading the Bullish Percent Index wrong on September 19th. In fact, this misread coincides with something else I was seeing at the time via the NYSE McClellan Oscillator, yet I chose not to mention it. Pending tomorrow's developments, I may elaborate.
Suffice it for now that, had I given serious consideration to a certain [technical] view of things, I could have been ahead of the curve prior to the market's recent swoon. I know, this is all water under the bridge. However, I would go through the exercise just to demonstrate how easy it is to discount possibilities, thinking some other (less dire) outcome were more likely. To wit, I locked myself into supposing the intra-day low set on Thursday, September 18, 2008 marked a significant bottom from which the market would bounce up toward its May '08 peak.
I continue to believe this bounce, indeed, will develop. It should be the largest advance we've seen in over a year and get under way sometime shortly ... once bottom to the market's present decline is in place (at a level not much lower from here). Observing the NYSE Bullish Percent Index from its January '08 bottom to its March '08 bottom, you can see the sort of divergence to expect once bottom in the NYSE Composite Index finally is in.
Had I anticipated the market's present decline, I certainly would not have sold my holdings of Ultra Short Index Tracking ETFs at the close on September 17th. Nevertheless, I am not complaining. Despite selling early and missing an even fatter score, I still took away a nice haul. And it goes without saying, this sure beats a sharp stick in the eye...

* * * * *
© The Risk Averse Alert — Advocating a patient, disciplined approach to stock market investing. Overriding objective is limiting financial risk. Minimizing investment capital loss is a priority.
Analysis centers on the stock market's path of least resistance. Long-term, this drives a simple strategy for safely investing a 401(k) for maximum profit. Intermediate-term, investing with stock index tracking-ETFs (both their long and short varieties) is advanced. Short-term, stock index options occasionally offer extraordinary profit opportunities when the stock market is moving along its projected path.
Nothing is set in stone. Nor is the stock market's path of least resistance always known. More often than not, there are no stock index option positions recommended.
 There's an easy way to boost your investment discipline...
Get Real-Time Trade Notification!


