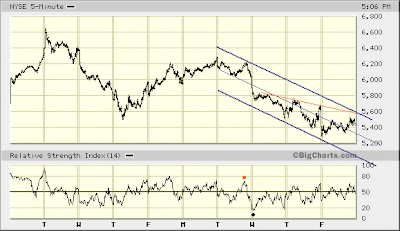
So, what does one make of a sideways trading stock market whose measured volatility — already extraordinarily elevated — continues growing as indexes merely retest their respective October 10, 2008 intra-day lows?
It might just mean the market will sooner bounce than fall apart in a big way. Today's trade seems to support this thesis.

Rising volatility is all well and good while it coincides with a decidedly declining market. However, volatility's continued increase (as indexes stabilize, relatively speaking) might better be seen from a contrarian's viewpoint. As such, then, a bounce should be expected.
Volatility's recent rise to an extreme level certainly goes toward confirming an Elliott Wave view now bringing me to label the market's decline since September a "third wave of a third wave" (more on this over the weekend). Thus, taking perspective from volatility, then, one is left to ask how much worse can the market's decline get? In other words, is the worst probably over? I believe it is.

(A word of caution... Whenever you see me draw lines on index charts projecting near-term possibilities ... it is entirely for the sake of indicating direction and magnitude, rather than suggesting the Elliott Wave structure and its timing.)
The market's pending bounce should lift respective indexes to the upper end of trading ranges established over the past couple weeks. Don't be surprised, though, if the trip higher is choppy rather than decisive. The late-January through late-February period might offer perspective.
More critically, the effect on RSI should be similar to what developed then. In fact, whether a choppy or a decisive advance develops, the desired effect on RSI is what matters here. A break in RSI's downtrend since May would indicate growing, underlying buying support and raise the probability the market is in the process of bottoming.
Then, following this projected bounce we should expect a retest of present lows (possibly exceeding them) whose net effect on RSI, the VIX and other technical measures would be similar to what occurred at the March bottom. Thus, expect technical divergences relative to extremes registered thus far in the market's decline. These will confirm the likelihood bottom is in. Bear in mind this probably will take some weeks to develop and could even extend into early next year.

(The channel I have drawn on the chart above is tentative.)
About today's Chip Diller vindication... Keep the "remain calm" advice in mind. There might be a bit more downside pressure over the days ahead before any meaningful bounce develops.
Assuming this week's turn lower is not yet over, here's what to look for before the market's anticipated bounce gets under way...
First, some added measure of buoyant price action (much as entered the market after today's opening drop) should result in 5-minute RSI rising above the red dot. This would indicate underlying buying support is strengthening. Subsequently, a decline to a new low should result in 5-minute RSI bottoming above the black dot. Thus, a positive price-RSI divergence would be established and set the stage for a technically constructive bounce.
The very fact today's extraordinarily negative pre-market indications did not precipitate a full blown collapse is significant. It demonstrates the existence of a determined buying interest willing to step in at currently depressed levels, no matter what degree of fear and uncertainty remains pervasive. This is precisely what Chip expected. Still, it's rather evident the rally off today's opening thud is not likely the start of the market's anticipated bounce. So, again, remain calm.
The market's bottoming process appears to have a good bit more to go before any sustainable advance lasting some months gets under way. Yet once it does, it's possible the market's charge higher could carry some [large-cap] indexes to new all-time record levels.
Now, I am not so sure how likely this possibility is. However, no matter how high the market might rise, its advance will occur within the context of a larger bear market that began last October (2007). This bear market's tentative objective is in the vicinity of index levels last seen in 1994. It is slated to end sometime over the next few years. I'll further develop this outlook over the weekend...

* * * * *
© The Risk Averse Alert — Advocating a patient, disciplined approach to stock market investing. Overriding objective is limiting financial risk. Minimizing investment capital loss is a priority.
Analysis centers on the stock market's path of least resistance. Long-term, this drives a simple strategy for safely investing a 401(k) for maximum profit. Intermediate-term, investing with stock index tracking-ETFs (both their long and short varieties) is advanced. Short-term, stock index options occasionally offer extraordinary profit opportunities when the stock market is moving along its projected path.
Nothing is set in stone. Nor is the stock market's path of least resistance always known. More often than not, there are no stock index option positions recommended.
 There's an easy way to boost your investment discipline...
Get Real-Time Trade Notification!


