Do yourself a favor. Open up the NYSE Composite's McClellan Oscillator in a new window.
Let's analyze the present period compared to a relevant period last year. Look at the stock market's decline starting in July, bottoming in August '07, and then its subsequent reaction higher, extending into October '07.
There's one difference worth noting in the McClellan Oscillator's performance, then versus now ... and this casts some suspicion on whether a strong advance is in order here, such as I wrote about yesterday.
How's that for flip-flopping, Pantangele?
Here's the deal. The McClellan Oscillator's performance during the NYSE Composite's rise from its March 17, 2008 bottom has not been quite as convincing as its performance last August through September '07.
Then the McClellan Oscillator leaped to a significantly higher level ... even higher than it registered prior to the NYSE Composite peaking in July '07. This demonstrated underlying buy-side strength ... the kind of thing to keep the NYSE Composite buoyant ... even as McClellan Oscillator divergences increased right up to the NYSE Composite's early October '07 peak.
Oddly enough, you see the same kind of pattern beginning at the NYSE Composite's January '08 bottom and moving forward to its top late in February. Subsequently, the NYSE Composite declined into its March 17, 2008 bottom.
Now fast forward to the present period since the March 17, 2008 low. The NYSE McClellan Oscillator, though in positive territory (thus, demonstrating buy-side strength), did not launch higher quite so markedly, such as it did off the bottom last August '07. Furthermore, the oscillator already is starting to diverge from the NYSE Composite Index.
The first divergence was at the recent low, about a week and a half ago... Although the NYSE Composite bottomed higher than where it stood in late-March, the oscillator registered a reading lower than where it stood at the same time. This did not happen once from late August through early October '07.
Price-oscillator divergence continued even as the NYSE Composite reached a higher high (post-March 17, 2008) last Friday (4.18.08). You see this all the more when you look at the NASDAQ Composite McClellan Oscillator. The price-oscillator divergence in the present period is stark.
What should I make of this, then? I ask particularly in light of how yesterday I noted there are no RSI or MACD divergences suggesting the S&P 100 was about to turn lower.

Is the McClellan Oscillator (both NYSE and NASDAQ) suggesting RSI and MACD might soon turn over?
Let's look again at the CBOE Put/Call Ratio...

The MACD on the Put/Call Ratio is behaving a lot like last September '07. It also is in a position coincident (particularly since last July '07) with turns lower in the stock market.
A little better perspective on the similarity now to last September '07 (and prospects the stock market will continue rising from here) might be gained looking again at the S&P 100's Bullish Percentage...

As you can see, the S&P 100's Bullish Percentage has recovered to a level above its 200 day moving average ... much like it last did late-September through early-October '07 ... just before the stock market turned over.
But...

Today's advance above last Friday's high (4.18.08) suggests the stock market might have further to rise.

Although the NYSE Composite did not follow suit, it bounced where you'd expect it to.

Appearances the stock market wants to go higher are difficult to ignore.
So, then, given the evidence I've presented thus far, how much higher the market might rise really is the question, I think. Maybe the S&P 100 will peak well-short of its 200 day moving average.
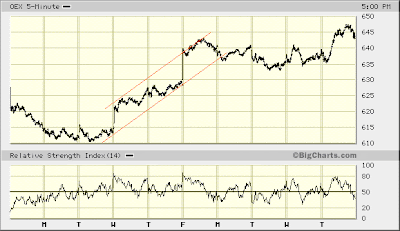
I drew two lines on the 1 year chart of the OEX above. They contain the highs and lows since the March 17, 2008 bottom. Completely meaningless! However, if the S&P 100 rises to the top line, then falls toward the bottom line, RSI and MACD divergences probably would form. Then, some re-test of the March 17th bottom might subsequently be in order.
So, there you have it once again ... another day knowing today's not when to say when ... courteous of Frank Pantangele.
* * * * *
© The Risk Averse Alert — Advocating a patient, disciplined approach to stock market investing. Overriding objective is limiting financial risk. Minimizing investment capital loss is a priority.
Analysis centers on the stock market's path of least resistance. Long-term, this drives a simple strategy for safely investing a 401(k) for maximum profit. Intermediate-term, investing with stock index tracking-ETFs (both their long and short varieties) is advanced. Short-term, stock index options occasionally offer extraordinary profit opportunities when the stock market is moving along its projected path.
Nothing is set in stone. Nor is the stock market's path of least resistance always known. More often than not, there are no stock index option positions recommended.
 There's an easy way to boost your investment discipline...
Get Real-Time Trade Notification!


