Technical confirmations and divergences are one thing the Elliott Wave Guy uses to get his bearings on the stock market. Today I present one reason why the March 17, 2008 low probably will be re-tested and show how a base for a subsequent stock market melt-up should form.
First, though, on Friday I revealed, "I am afraid a bout of selling worse than I have thus far considered ... could be in store," and said, "I will write about this over the weekend." But then I decided not to. Let me explain...
There have been certain technical non-confirmations that, along with volume concerns and price-RSI considerations, have caught my attention. These don't just indicate a re-test of March 17th's low, at the very least, is probable. They suggest something much worse might be in store.
Now, I don't wish to downplay this possibility. However, it might just turn out these non-confirmations represent added [positive] divergences supporting my view for a pending stock market melt-up. Time will tell.
I could share the details highlighting my concern, but I don't want to bore you any more than I must already. So, I am going to stay on point and keep my sight set on indications the stock market's multi-month decline is yet to complete (again, I don't think March 17th marks bottom). Should a projected re-test of March 17th's low occur as anticipated, then we simply will have added substantive basis for looking forward to a pleasantly surprising stock market melt-up.

(click here for more information about the NYSE Bullish Percent Index)
The above chart presents a view I read as follows...
First, the January '08 swoon brought "the stock market" to a point where it was washed out ... "oversold." Only 15.92% of all stocks in the NYSE Composite had "bullish" chart configurations at the time the index bottomed.
Being the NYSE Composite fell lower in January than it did last August, the impact of January's sell-off was, therefore, "confirmed." The negative effect on the composite of stocks making up the NYSE Composite index broadened. January's lower Bullish Percent Index demonstrates this.
The market's re-test of its January low on March 17th coincided with a divergence in the NYSE Bullish Percent Index (26.04%). Hence, we might conclude additional underlying buying support than existed in January had developed going into the March 17th low. Thus, there existed some added interest to "defend" January's bottom.
Fast forward to today. Although the NYSE Composite is no higher than it was in late February, the Bullish Percent Index has exceeded the peak it reached in February (43.63). This suggests underlying buying support continues to grow. It bolsters the technical case suggesting a bottom is forming in the stock market's multi-month decline.
Now consider the Bullish Percent Index's present position. Being nearer the upper end of the range it has trading within over these many months, the time for the stock market to turn lower once again might be at hand.
Should the NYSE re-test its March 17, 2008 low, expect the Bullish Percent Index to bottom above its low set in March (26.04). Contrarily, if the NYSE should exceed its March 17, 2008 low, then expect the Bullish Percent Index to bottom above the low it set in January (15.92).

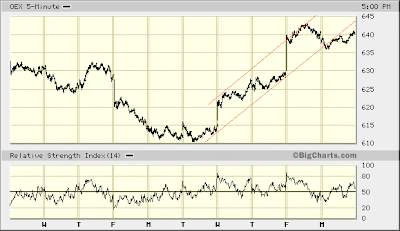
Today's break of last week's advancing trend suggests the re-test of the March 17, 2008 low might have begun.
Per the lack of any RSI divergence during last week's advance, this is circumstance that "fits" Elliott Wave analysis. Ditto the similar lack of RSI divergence during the S&P 100's decline prior to last week's advance. Indeed, both instances might be further evidence supporting both my case for a re-test of March 17th's low and a subsequent melt-up...
* * * * *
© The Risk Averse Alert — Advocating a patient, disciplined approach to stock market investing. Overriding objective is limiting financial risk. Minimizing investment capital loss is a priority.
Analysis centers on the stock market's path of least resistance. Long-term, this drives a simple strategy for safely investing a 401(k) for maximum profit. Intermediate-term, investing with stock index tracking-ETFs (both their long and short varieties) is advanced. Short-term, stock index options occasionally offer extraordinary profit opportunities when the stock market is moving along its projected path.
Nothing is set in stone. Nor is the stock market's path of least resistance always known. More often than not, there are no stock index option positions recommended.
 There's an easy way to boost your investment discipline...
Get Real-Time Trade Notification!


