Yikes. The Irving Fisher clones are coming out of the woodwork...
Says Mr. Rose on the right: It was "only" finance that brought recession! With that problem "solved" now we're on the road to recovery!
Only finance?
HOW ABOUT THE GREATEST PONZI SCHEME IN THE HISTORY OF THE PLANET!
Physical assets were levered up and sold off — destroyed. With revenue streams cannibalized, the need to maintain cash flows in order to satisfy current obligations (born of short-sighted will to grossly lever a shrinking physical asset base) required floating new securities (leveraging assets all the more): a game made possible via OTC derivatives — the Spanish Fly Wall Street used to seduce credit securities ratings agencies.
CLASSIC PONZI SCHEME
... now unwinding, and quite evidently soon to accelerate on its course to inevitable demise. In the process the "big govment" groupies like Mr. Angrisani will be forced to concede the make work "industries" built up on both the private and public side of the ledger were in truth fed table scraps enough to keep their tails wagging in a decades-long operation levering up a post-industrial economy that no longer can spare even a crumb to sustain its false promise (as evidenced by today's jobs report).
Pity neither side of the ideological divide has the slightest clue about the dynamic both in their own disjointed way played a part in unleashing.

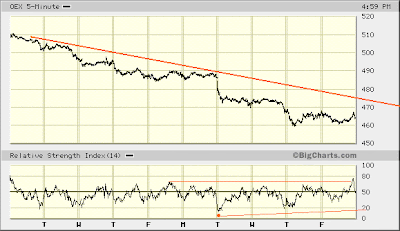
By the hair of my chinny, chin, chin recovery today brought such RSI improvement that, yesterday was thought likely. Still, a final move lower producing a relative strength divergence versus Tuesday's worst very much remains in the cards. This further decline is seen completing five waves down from June 21st's peak.

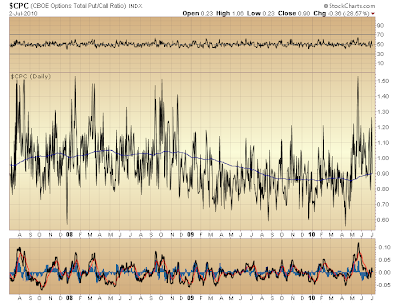
Recall observations on the CBOE Put/Call Ratio put forward in April suggesting that, upcoming selling likely would abate only when long equity positions venturing to effect a bounce were being hedged to a greater degree than ever occurred in the 2008-2009 period.
In that prior period only wave (A) down had unfolded (from October 2007 top). Now, however, wave (C) down is seen developing. The urgency of selling in this present leg lower (lasting for as far as the eye can see right now) should be markedly more profound than was the case during 2008-2009. Therefore, one can expect any determined bid venturing to put a floor under the market rightly will be hedged (via put options) to some greater degree than was evidenced during that prior period.
Indeed, this is precisely what happened [ever so slightly] in late-May at the conclusion of wave (1) of (C).
So, look now. Here major indexes are trading at lower lows, and yet to materialize is that elevated measure of hedged, long equity positions one might suppose necessary to effect some greater degree of sustained support.
This condition suggests the market remains vulnerable to a good deal more selling. This might likely persist, too, even following any upcoming decline completing five waves down from June 21st.
Subsequently, as well, there is sure to be insufficient long equity hedging during any prospective, upcoming bounce whose effect largely is projected to stabilize downward momentum of major indexes (as mentioned yesterday).

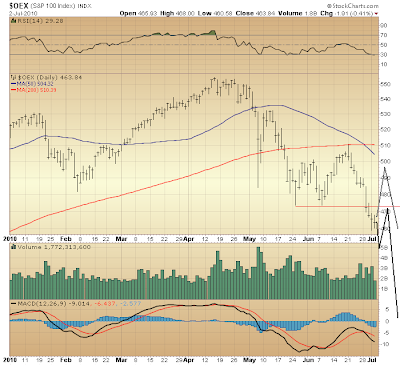
Honestly remaining in the realm of possibility, though, is an a-b-c "zig-zag" down from June 21st top completing yesterday morning. This, forming wave (b) of (2), suggests wave (c) of (2) presently is unfolding (projection shown via gray line above).
Although thought somewhat less likely — rather five waves down from June 21st are my preferred view here, with the final wave lower upcoming — daily RSI's "oversold" condition, as well as positively diverging momentum (MACD) versus late-May, leave open the possibility that, wave (c) of (2) began unfolding yesterday, thus poising major indexes for a move higher over coming days.
The prospective a-b-c "zig-zag" down from June 21st (already forming wave (b) of (2)) is made noteworthy by the fact the Elliott Wave Principle's "rule of alternation" is served in two ways.
First, the form this prospective wave (b) of (2) takes (again, a "zig-zag") alternates from wave (a) of (2), which having unfolded from late-May to June 21st formed a "flat."
Wave (b) of (2) also is seen alternating in complexity, being "simpler" than wave (a) of (2).
Finally, waves (a), (b) and (c) of (2) would be seen forming in a "complex-to-simple" manner. Contrarily (or in light of Elliott alternation), wave (a) of (2), itself taking a complex ("flat") form, unfolded in a "simple-to-complex" manner. Thus the manner of unfolding of the part (i.e. wave (a) of (2)) alternates from that of the whole (i.e. wave (2)).
* * *
Next week we should know with certainty whether five waves down or three unfolded from June 21st top.
Per possibility five waves down from June 21st are unfolding, these might form wave a of (b) of (2) — the initial leg of a larger a-b-c "zig-zag" down from June 21st (drawn above in black).
Contrarily, five waves down from June 21st might form wave 1 of (3) (of five waves down from late-April peak slated to carry market indexes back to levels last seen in the 1980s). Thus, in this view wave (2) is complete. This possibility naturally raises the question, too: could wave 2 of (3) — a more or less sideways, range-bound affair — consume trading throughout the remainder of July and much of August?
Being that 200-day moving averages on some major indexes only have begun turning down, whereas on others the 200-day continues rising, a technical rally like that in June might prove more likely here.
* * *
Volume accompanying any upcoming bounce holds a key. Should volume be considerably constrained, then those holding long positions would be demonstrating greater selling restraint and raising the likelihood collapse will be delayed some days and weeks.
However, were volume to be become somewhat elevated over the course of any upcoming rally, then look out below. Some strong, yet rightly fearful element would be seen taking advantage of technical circumstances driving the bid higher and selling long positions into strength.
One valuable point of reference here is the market's rally late in the week of September 15, 2008, following the Lehman Brothers bankruptcy. Not recognized at the time — unfortunately — elevated volume accompanying the market's rally September 17 -19, 2008 was a vivid demonstration of a rightly fearful element bailing out, selling into strength right before the lug nuts came off. Expect something much the same developing over weeks ahead, probably following the collapse of some major European bank.
Finally, any rallies on yet again weak volume followed by declines to new lows, post-April peak should only demonstrate the magnitude of weakness underlying the market ... such that when a technical rally on elevated volume at last occurs (as seems likely), sounding the market's death knell, the stunning collapse sure to follow will have been more than adequately forewarned.
All things considered, a volatile period resulting in major indexes invariably grinding lower likely will mark the next couple months' trading. Precisely how this develops — the extent of volatility — depends on Elliott wave-related possibilities mentioned above, all of which presently possess near equal probability in their likelihood.
No matter. The very fact today is but an early moment in a collapse forecast to be one for the ages ought temper any premature anticipation supposing the market's demise might be imminent. Well enough is present opportunity one has for preparing to make an absolute killing when panic enters stage right...

* * * * *
© The Risk Averse Alert — Advocating a patient, disciplined approach to stock market investing. Overriding objective is limiting financial risk. Minimizing investment capital loss is a priority.
Analysis centers on the stock market's path of least resistance. Long-term, this drives a simple strategy for safely investing a 401(k) for maximum profit. Intermediate-term, investing with stock index tracking-ETFs (both their long and short varieties) is advanced. Short-term, stock index options occasionally offer extraordinary profit opportunities when the stock market is moving along its projected path.
Nothing is set in stone. Nor is the stock market's path of least resistance always known. More often than not, there are no stock index option positions recommended.
 There's an easy way to boost your investment discipline...
Get Real-Time Trade Notification!


