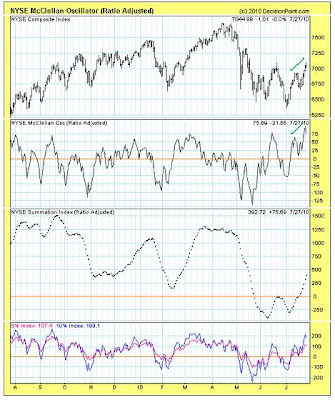
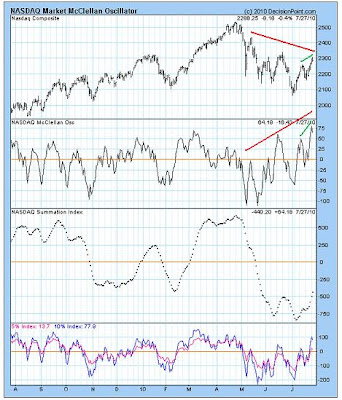
The prospective a-b-c-x-a-b-c complex corrective wave from late-May is back on the table. This corrective wave until yesterday was thought forming wave (2) of (C), but now is seen more likely tracing wave (b) of B of (B).
A healthy mix of improved technical measures (some with further room for improvement) suggest something other than five waves up from June 29th bottom are unfolding. For example, both the NYSE and NASDAQ McClellan Oscillators are confirming the past week's further move higher off June 29th bottom. Were a fifth wave unfolding and finishing wave c (of an a-b-c corrective wave since late-May), then both Oscillators should be well along in fading. Quite the contrary is the case, however...


Of course, it's possible something along lines occurring last month at the peak of the first a-b-c corrective wave from late-May bottom (forming an "irregular flat") is developing and the market soon will turn lower on a dime once again. Yet conditions are, in fact, relatively more improved here (with positive divergences registered at June 29th bottom adding weight to this), so further gains in the market appear likely over days ahead.
Sometime over the past couple weeks I put forward a view showing that, current conditions resemble those during late-February, and so a more prolonged move higher might develop. Given this apparently increasing probability, then, how much higher might major indexes rise? The answer now is the same as then: respective reaction highs, post-flash crash, mark the vicinity of the upper end to which the present advance might extend.
So, an a-b-c "zig-zag" is seen unfolding off June 29th bottom (with wave c presently forming). This follows an a-b-c "irregular flat" forming from late-May to mid-June. Thus, an a-b-c-x-a-b-c complex corrective wave is seen forming what now is thought wave (b) of B of (B).
Per wave (c) of B of (B) upcoming, we see how the various McClellan measures are raising the probability something nasty could develop. Summation indexes, as well as 5% and 10% indexes, have been decidedly trending lower over the past year as the market has begun turning over. Yet despite this both NYSE and NASDAQ McClellan Oscillators presently reveal a measure of fearlessness, as though underlying technical strength were believed building, rather than deteriorating as clearly has been the case.
Such is the face of a fine technical setup for a giant letdown...

* * * * *
© The Risk Averse Alert — Advocating a patient, disciplined approach to stock market investing. Overriding objective is limiting financial risk. Minimizing investment capital loss is a priority.
Analysis centers on the stock market's path of least resistance. Long-term, this drives a simple strategy for safely investing a 401(k) for maximum profit. Intermediate-term, investing with stock index tracking-ETFs (both their long and short varieties) is advanced. Short-term, stock index options occasionally offer extraordinary profit opportunities when the stock market is moving along its projected path.
Nothing is set in stone. Nor is the stock market's path of least resistance always known. More often than not, there are no stock index option positions recommended.
 There's an easy way to boost your investment discipline...
Get Real-Time Trade Notification!


