(Mouse over charts)
Maybe the stock market has topped...

Maybe it has not...

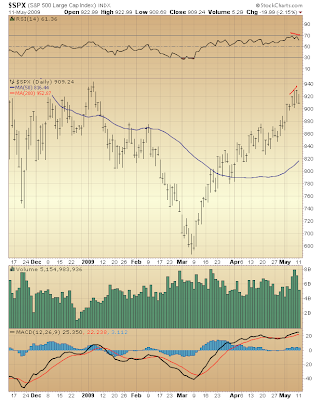
But judging by this weakening measure of bullish, upside momentum, top certainly appears near...

Prior periods highlighted above were noted early last month in The Cramer Bull Trap. Following each, the McClellan Oscillator spiked during what were less than spectacular rallies. If something like this awaits, might it occur after the market's initial break, following its top?
The reason I ask only is to suggest there's no hurry betting Friday's outlook, expecting a rapid reversal of fortunes once top is in. Indeed, even if the noted similarity of trading so far this year to the same point last year continues, it's possible upcoming selling might not convincingly challenge bear market lows (as was the case last year going into July '08 bottom).
All I really know with any degree of certainty is that major indexes are trading at the top end of their respective ranges over the past seven months, while underlying technical conditions (revealed in the context of an assumed bear market — a safe assumption) appear stretched and beg the question: how much better can things get?
Thus, a turn lower appears near. How this might fit in the grand scheme of things remains to be seen. I have spoken of present levels possibly being the vicinity of the best the stock market sees for another five years or so. I also have suggested a late summer rally could carry the NASDAQ Composite upward to 2200 (from its present 1700ish).
Either way the market's apparent pending turn lower is a fitting Elliott Wave possibility.
And if I might more completely humble myself here, let me just say the manner in which the NYSE Composite has "caught up" with the NASDAQ Composite, relative to each index's respective 200-day moving average, does not go unnoticed. Indeed, this brings me to wonder... Could there be some undercurrent that's poised to send the market on a melt-up, precipitating a gap breakout above the 200-day moving average?
Uh, yeah, that's definitely possible. But time is running short it seems. Could still positively poised momentum measures (like the McClellan Oscillator) spike coincident with a melt-up? Could other technical measures, very stretched in both absolute and relative terms, become even further stretched? Nothing is set in stone...

* * * * *
© The Risk Averse Alert — Advocating a patient, disciplined approach to stock market investing. Overriding objective is limiting financial risk. Minimizing investment capital loss is a priority.
Analysis centers on the stock market's path of least resistance. Long-term, this drives a simple strategy for safely investing a 401(k) for maximum profit. Intermediate-term, investing with stock index tracking-ETFs (both their long and short varieties) is advanced. Short-term, stock index options occasionally offer extraordinary profit opportunities when the stock market is moving along its projected path.
Nothing is set in stone. Nor is the stock market's path of least resistance always known. More often than not, there are no stock index option positions recommended.
 There's an easy way to boost your investment discipline...
Get Real-Time Trade Notification!


