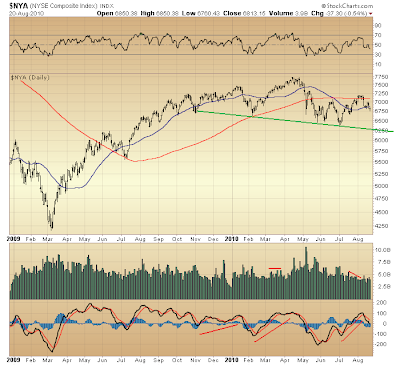
It looks like a head-and-shoulders top is just about to complete its formation on the NYSE Composite index...

The volume configuration is key. A head-and-shoulders top is a distribution pattern — marking a transfer of shares from strong hands to weak — so, you want to see volume diminishing during formation of the right shoulder.
This requirement ties into the adage, "Prices can fall of their own weight, but it takes buying to put them up." Strong hands (possessing power to drive prices ever higher) naturally will be increasing their purchases following a markdown. When they're not, you can assume their positions have been distributed (in the case of a head and shoulders top during formation of the left shoulder and head). Without the backing of strong hands (which condition is revealed by muted volume during formation of the right shoulder), prices are vulnerable to falling of their own weight.
Momentum's configuration (MACD - bottom panel) appears to be confirming distribution as well. Weak hands — either hanging on for dear life (probably a widespread phenomenon these days) or possessing misplaced optimism — are adding no selling pressure. Nor are strong hands. These have been distributing shares, not adding to their position. So, accelerating momentum during advancing phases of a head and shoulders top's formation might naturally become increasingly evident, much as we see in this case.

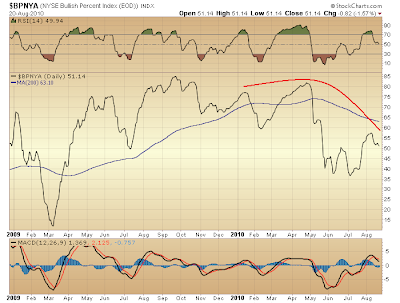
Added confirmation of increasing underlying weakness such as one might expect during formation of a head and shoulders top is presented via the Bullish Percent Index. Lovely.

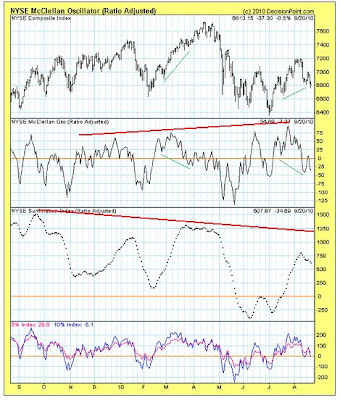
Ditto the McClellan Oscillator and Summation Index. Per the Oscillator, the deceleration of selling pressure is leading to its successive increase from left shoulder to right shoulder.
Now the question is how soon will come the neckline's downside penetration? With the McClellan Oscillator diverging this week versus last ... the Summation Index remaining on the positive side of its range ... and 5 and 10% Indexes likewise positive and diverging ... it appears a decent bounce could develop before a strong turn lower leading to downside penetration of the head and shoulders' neckline follows.

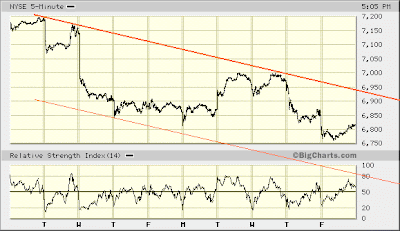
Sticking with the NYSE Composite index, it is not at all certain that, five waves down from August 9th top have unfolded. If, however, these five waves down ended today, then with failure to channel to the third wave's parallel, a measure of underlying support might, in fact, exist here and lead to a fairly strong push higher over coming days — this in keeping with yesterday's point of view (seen via the OEX).
Given a solid case strong hands are done distributing shares, and the appearance of an ominous head and shoulders top — technically well-substantiated — the hour draws near for the first serious retest of March 2009 bottom.

* * * * *
© The Risk Averse Alert — Advocating a patient, disciplined approach to stock market investing. Overriding objective is limiting financial risk. Minimizing investment capital loss is a priority.
Analysis centers on the stock market's path of least resistance. Long-term, this drives a simple strategy for safely investing a 401(k) for maximum profit. Intermediate-term, investing with stock index tracking-ETFs (both their long and short varieties) is advanced. Short-term, stock index options occasionally offer extraordinary profit opportunities when the stock market is moving along its projected path.
Nothing is set in stone. Nor is the stock market's path of least resistance always known. More often than not, there are no stock index option positions recommended.
 There's an easy way to boost your investment discipline...
Get Real-Time Trade Notification!


