This seems a timely moment to consider the impact on the stock market of that flood of credit created over the past few decades via OTC derivatives, and the prospect that, continuance of this arrangement is more gravely threatened now than ever before...

Increasing leverage largely facilitated the stock market's spectacular ascent following the crash of October 1987. It was the Age of Greenspan ... who became Fed chairman earlier that year (raising the question: was the crash but some manufactured crisis created so some desired change might be gamed ... this one involving an intellectual skilled in oratory needed to rationalize a securities arrangement whose theoretical power facilitated risk mitigation of credit created to finance anything under the sun, even unbridled speculation?).
Yet since Y2k the power of increasing leverage has been escaping the global financial system — and this despite the lender of last resort moving to become "all in."
Last week's euro-fun demonstrated this truth once again ... let alone the fact that, risk of runs on liquid capital markets has by no means dissipated. Indeed, everything built up using OTC derivatives appears to be crashing down, everywhere — even China.
So, the recently accelerating regulatory rampage attacking all things fraud, everywhere — the likes of which OTC derivatives largely facilitated (and this, no less, to the shock of Herr Maestro) — has got to be one big wake up call. One rather suspects the stock market is made all the more vulnerable to destructive runs venturing to raise capital no longer available in credit markets threatened to become even more dysfunctional with [much needed] regulatory reform. A throttling back to levels last seen at the dawn of the Age of Greenspan seems almost a best case scenario.
Furthermore, a collapsing credit system is the kind of thing that can strike a wide swath of highly liquid asset classes, including gold and commodities in general ... as 2008 amply demonstrated.
Speaking of gold... Bob Prechter, co-author of the Elliott Wave Principle, today revealed an interesting tidbit about current investor sentiment toward that prized asset...
Everyone being "all in" gold jives with the growing probability that, the present political season again will feature a mad dash for capital available in liquid assets, be they metal or paper.
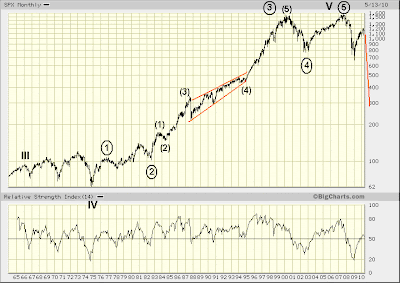
Now, let me draw your attention to the Elliott wave count on the chart above, covering the S&P 500 over the past forty-five years. In case you are wondering wave V (ending October 2007) completes five waves up from 1932. This fifth wave offers an interesting study in the so-called "rule of alternation" put forward in the Elliott Wave Principle.
Note how alternation takes form in second and fourth waves throughout the formation of wave V. You might recall this is very much like what developed during formation of five waves off March '09 bottom.
Of particular interest here, though, is how the fourth wave of wave V (2000-2002) markedly weakened the S&P 500's advance since 1974 — this by its downwardly-biased, alternating form, as well as its greater negative impact on RSI, both seen in relation to the second wave of wave V (1976-1982). Added confirmation of increasing weakness is seen via coincident RSI registered following 2002 bottom ... first, as the fifth and final wave from 1974 unfolded (failing to best RSI registered during formation of the third wave of wave V), and then since top (moving strongly to the negative, and now to buy- and sell-side balance following a short squeeze for the ages off March '09 bottom).
So, this longer view offers a suitable backdrop, then, to recent musings suggesting an imminent decline challenging March '09 lows appears in the offing. As you can see, a far worse fate could be awaiting the stock market, as the viability of what Warren Buffett once called financial weapons of mass destruction meets its greatest challenge ever in the U.S. Senate.
This does not mean March '09 lows will be taken out precisely as indicated above, though. What is intended here simply is a view of the path of least resistance over the next few months extending through the next couple years.
Nevertheless, a near-term, catastrophic collapse ought not be ruled out, particularly considering last Thursday's shocking turn of events. Revealed was just how extraordinarily frail are markets of all sorts. The possibility is very real we might soon witness a period wherein circuit breakers prevent most from exiting trades, leading to a relentless, cascading tumble, turning today's trusting souls with no inkling of the past decade's distribution into tomorrow's tragic losers.
So, let's consider the technical situation at the present moment...

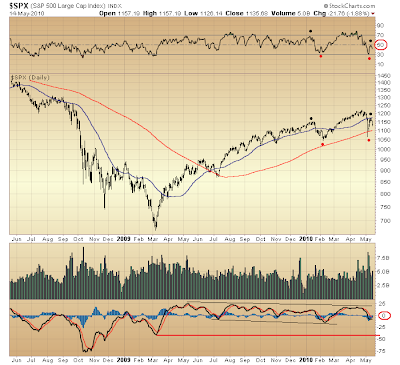
Relative strength measured on a daily basis is in a much weakened position. Presently registering firmly on the sell-side of its range, RSI suggests the market is vulnerable to further selling.
Is this threat more like late-January ... when the S&P 500 was but poising to finish a five wave move lower?
Or, instead, will selling more greatly resemble periods prior to March '09 bottom?
I strongly suspect the latter. Thus, were it likely that, a third wave down from April top began unfolding today, then it seems equally likely that, momentum (MACD) is slated to fall below its trough set at March '09 bottom (and in the process increase the probability of that larger market decline presented above, wherein a return to levels last seen in the 1980s is projected).

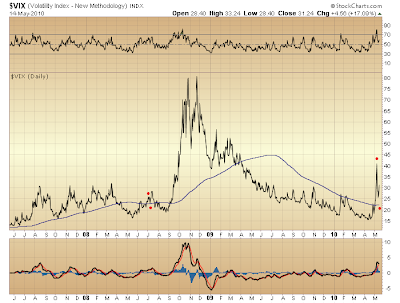
The market's counter-trend rally off March '09 bottom has been likened to that previous counter-trend rally from March-May 2008. Indeed, given the uncanny similarity price action off March '09 bottom has with that off March '08 bottom (that is in relation to respective declines preceding each rally), one wonders if, as a consequence of the present, initial resumption of a larger projected decline, volatility might behave similarly, relative to its range established during the market's preceding decline.
As you can see, the market's decline from May-July 2008 — a sell-off taking the S&P 500 below its March '08 low (and representing but initial resumption of a larger decline) — resulted in the Volatility Index rising to a level near its highest reading set during the market's decline into March '08 bottom.
Might the same occur now, as the initial decline of a larger projected sell-off unfolds over days immediately ahead, resulting in the VIX being carried back up to the attic?

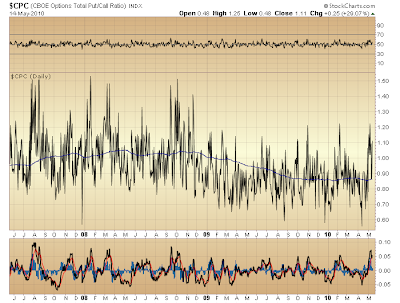
As noted recently, one might expect a marked burst in put options purchases hedging long equity positions were buying support necessary for initiating a counter-trend rally (within the context of a larger, unfolding decline) thought in place.
Yet relative to intermittent lows from which a counter-trend rally developed during the 2007-2008 period, the present level of put options hedging is not yet in the ballpark where one might expect buying support. So, here too, is added evidence suggesting a good deal more selling might be in store over days straight ahead.

* * * * *
© The Risk Averse Alert — Advocating a patient, disciplined approach to stock market investing. Overriding objective is limiting financial risk. Minimizing investment capital loss is a priority.
Analysis centers on the stock market's path of least resistance. Long-term, this drives a simple strategy for safely investing a 401(k) for maximum profit. Intermediate-term, investing with stock index tracking-ETFs (both their long and short varieties) is advanced. Short-term, stock index options occasionally offer extraordinary profit opportunities when the stock market is moving along its projected path.
Nothing is set in stone. Nor is the stock market's path of least resistance always known. More often than not, there are no stock index option positions recommended.
 There's an easy way to boost your investment discipline...
Get Real-Time Trade Notification!


