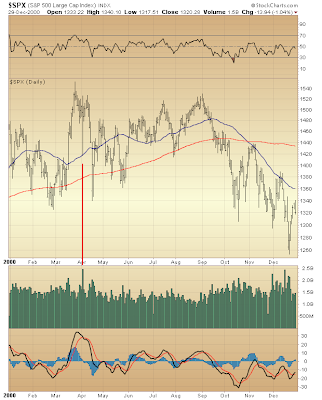
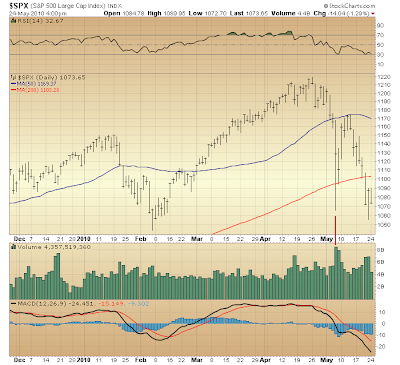
Let's take a closer look at May 6th's collapse and intra-day recovery, and similarities with the collapse and intra-day recovery of April 4, 2000. So far in May 6th's aftermath these similarities remain noteworthy. Yet, too, there are distinct differences, now versus then, whose significance is fitting the moment. These likely will result in the market turning decisively lower sooner than occurred back in 2000.
First, the S&P 500 during Y2k...

And now, the S&P 500 over the past six months...

Both collapses witnessed a notable spike in volume and both saw losses entirely recovered over successive days following. Likewise, during subsequent recoveries volume persistently contracted as the S&P 500 moved back up to its pre-collapse levels.
Following these recoveries the S&P 500 reversed course and took out intra-day lows set on the day of collapse. In both instances accompanying volume never exceeding volume registered on that day (thereby indicating a short-term bottom — i.e. selling exhaustion).
In both instances, too, a [rising] 50-day moving average was positioned above a [rising] 200-day moving average. Of course, this sort of configuration typically is associated with an upwardly trending market. Yet despite this, the collapse of April 4, 2000 eventually was to be seen part and parcel of an evolving trend reversal whose confirmation did not arrive for another 6-7 months.
Now, the collapse of May 6, 2010 likely will not require nearly as much time before 50-day and 200-day moving averages fall in line and confirm that day's ominous dislocation. That's because, presently, continuation of a [large] corrective wave that began in October 2007 is thought to have commenced in late-April 2010, whereas in 2000 a [smaller] corrective wave was just in its very beginning, and this following a five year advance unrivaled in market history.
Supporting this conclusion are differences the May 6, 2010 collapse reveals in contrast to that of April 4, 2000.
For example, on April 4, 2000 the S&P 500 found support at its 50-day moving average, whereas on May 6, 2010 the S&P 500 decisively fell below its 50-day moving average and did not find support until reaching its 200-day moving average.
Then, in 2000 the S&P 500's 200-day moving average was the area in which support developed once selling had become exhausted in late-April. Presently, however, the 200-day moving average — having been penetrated to the downside last week — is setting up to offer resistance. So, should similarity to 2000's post-dislocation performance persist, then following demonstration of selling exhaustion a correction of losses thus far suffered probably would put the S&P 500's 200-day moving average in the cross hairs.
Per the possibility selling presently is becoming exhausted (as recent days' volume relative to May 6th suggests) ... let's consider the prospect of an upcoming bounce in the context of the dire outlook discussed Friday ... wherein an imminent decline to the area of March '09 lows was thought in store — a prospect finding considerable technical substantiation with precedent seen in the weeks following the collapse of Lehman Brothers (September 15, 2008)...
Simply stated, a first and second wave (of five waves down from late-April top) are thought to have completed on May 13th. Since then, a third wave down appears to have begun unfolding. This third wave, itself, will subdivide into five waves. Of these, the first appears to be nearing completion. Formation of the second wave of wave 3 could bring the S&P 500 back up to its 200-day moving average, and might even see the index trading above it (if that's what it takes to draw in the last sucker). So, a seeming demonstration of selling exhaustion at present (evidenced via contracting volume relative to May 6th's) might only lead to a rather short-lived bounce. Subsequently, a rapid fall toward March '09 lows might then commence.
There's one glaring technical difference, now versus April 2000, setting up the possibility of but a brief recovery in the S&P 500 (in contrast to its more prolonged recovery in 2000) despite there now being evidence of selling exhaustion similar to that witnessed in April 2000.
Observe how May 6th's collapse weighed on both RSI and MACD to the effect of sinking both measures to the sell-side of their respective ranges. Contrast this to the April 4, 2000 collapse. At the end of the day both measures remained on the buy-side of their respective ranges. Indeed, not until the S&P 500 later took out its intra-day low of April 4, 2000 did both measures finally sink to the sell-side of their respective ranges. The difference these two measures present, now versus April 2000, reflects on the market's underlying condition whose relative weakness, currently, should have an impact on any near-term recovery, both its duration and its strength.

Among Fast Money traders there was unanimous consensus at the conclusion of today's trading believing this afternoon's weakness was foreboding, and could be signaling a good deal of selling ahead.
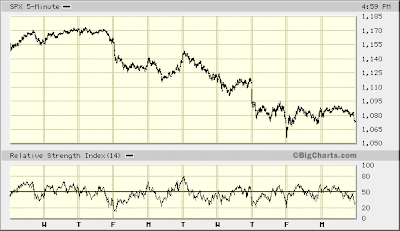
No doubt, there has not been much of any relative strength improvement over the past week when the S&P 500 briefly bounced, so the case calling for further weakness finds technical substantiation on this count, as it does by the fact that, each new low in the S&P 500 over the past week likewise has been confirmed by still weaker relative strength readings.
Yet over the past week, too, relative strength has not once exceeded its low set on Friday, May 14th, when the S&P 500's present move lower (following completion of wave 2 the day before) was just beginning. This is causing some confusion as to where in the formation of wave 3 down the S&P 500 presently stands.
Notwithstanding this, evidence of selling exhaustion (as mentioned above) and tonight's negative consensus among Fast Money traders leads me to believe a floor might be put under the market at levels not much lower than has been seen thus far. Still, that a third wave down presently is thought to be forming, further evidence of [momentary] selling exhaustion might yet be demonstrated while in the process [hopefully] bringing clarity as to where in the formation of wave 3 down the S&P 500 presently stands. A bounce leading RSI to exceed its best last Tuesday (at the open) would be a welcome development indicating the first wave of wave 3 down is nearing its end. As of now, though, there is no indication suggesting the decline of the past seven days is nearing completion.
So, although I expect further weakness before any prospective rally toward the S&P 500's 200-day moving average, just how this might develop is unclear.

* * * * *
© The Risk Averse Alert — Advocating a patient, disciplined approach to stock market investing. Overriding objective is limiting financial risk. Minimizing investment capital loss is a priority.
Analysis centers on the stock market's path of least resistance. Long-term, this drives a simple strategy for safely investing a 401(k) for maximum profit. Intermediate-term, investing with stock index tracking-ETFs (both their long and short varieties) is advanced. Short-term, stock index options occasionally offer extraordinary profit opportunities when the stock market is moving along its projected path.
Nothing is set in stone. Nor is the stock market's path of least resistance always known. More often than not, there are no stock index option positions recommended.
 There's an easy way to boost your investment discipline...
Get Real-Time Trade Notification!


