Hearing Jim Cramer tonight say that, NASDAQ's rally off March '09 bottom could be "one of the most important bull market explosions in the history of equities," and then question whether this is "a regular bull market or a super bull market" ... well, rest assured I am not about to "shut up," much as he disdainfully implores those who, like myself, are bearish.
Indeed, being of sound mind and possessing analytical skill well beyond the mere capacity to hype large percentage moves that do more to lead incredulous souls to salivate with greed than elucidate a fearsome reality, you will find my response to Cramer's analysis well-summarized by the graphic appearing at the end of this post linking to tonight's Mad Money opening segment.
(Fast Money's Word on the Street was unavailable.)
Back in 1929, just prior to the late-October Crash, widely-respected economist Irving Fisher predicted...
"Stock prices have reached what looks like a permanently high plateau."
Then, in the days leading up to the Crash Mr. Fisher claimed the market was "only shaking out the lunatic fringe." Just one day before everything began rapidly unraveling Fisher announced in a banker’s meeting "security values in most instances were not inflated." And for months after the Crash, he continued to assure investors that a recovery was just around the corner.
Contrast this with our boy Shemp, who tonight said this about NASDAQ's rally off March bottom...
"There is no possibility this is anything other than a bull market."
Raheeheealy!

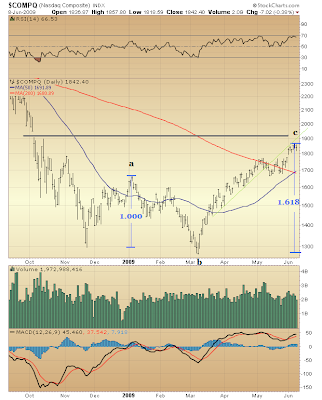
Just how much (or, more appropriately, how little) upside remains in the NASDAQ Composite is amply spoken by the markup appearing on the above chart. The Fibonacci relationship of wave c to wave a is standard-fare Elliott Wave Principle. Overhead resistance at last October's gap lower more or less is intuitive.
RSI and MACD since March bottom definitively confirm the wave count indicated above. That both have decidedly held to the buy-side during the formation of wave c ... with each registering their best readings since October 2007 ... plainly reveals the manner in which third waves typically are the most dynamic of Elliott waves.
Recall too recent observations on the CBOE Put/Call Ratio. All the more is wave c confirmed by the pronounced degree to which Call volume has been exceeding Put volume since March bottom.
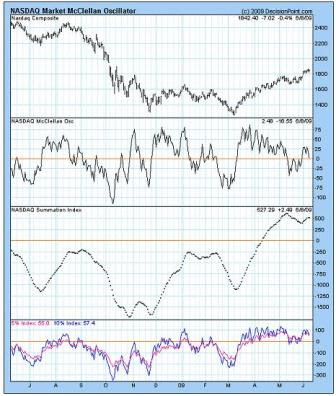
As per the likelihood NASDAQ is approaching the precipice of its present advance...

Yikes! Despite NASDAQ's resilient advance since late-March, momentum (as measured by the McClellan Oscillator) persistently has been fading.
There really is only one thing left to say here...
Congratulations, Shemp! Your timing is impeccable...

* * * * *
© The Risk Averse Alert — Advocating a patient, disciplined approach to stock market investing. Overriding objective is limiting financial risk. Minimizing investment capital loss is a priority.
Analysis centers on the stock market's path of least resistance. Long-term, this drives a simple strategy for safely investing a 401(k) for maximum profit. Intermediate-term, investing with stock index tracking-ETFs (both their long and short varieties) is advanced. Short-term, stock index options occasionally offer extraordinary profit opportunities when the stock market is moving along its projected path.
Nothing is set in stone. Nor is the stock market's path of least resistance always known. More often than not, there are no stock index option positions recommended.
 There's an easy way to boost your investment discipline...
Get Real-Time Trade Notification!


