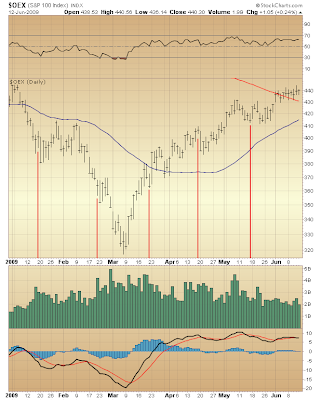
With five days remaining until options expiration let's take a closer look at June OEX open interest distribution among Call and Put contracts, both above and below the market. Some better sense of the probable path of least resistance over the coming week is revealed by financial exposure presented therein...

Above the market at the 445 strike are 3,467 Call contracts versus 566 Put contracts open. A rather wide disparity given how near the market the 445 strike lies.
At the 450 strike are a whopping 8,892 Call contracts open versus only 354 Put contracts.
Further up the options chain the 455 strike finds 4,238 Call contracts and a meager 54 Put contracts open. At the 460 strike are 3,589 Call contracts versus just 44 Put contracts open.
Plainly, there is a vested interest with reason to pound the market should any attempt to bid it higher be made.
Those writers of Call contracts above the market — happy to pad returns collecting premium — are at risk of being held to account. Going into expiration, their exposure presents cause to put a lid on any advance.
Indeed, one might assume the past two weeks' trading largely has been driven by this very same exercise, because even "at the market" we see a similar disparity between June OEX Call and Put open interest....
440: 4,909 Call contracts versus 2,266 Put contracts open.
Now, OEX strikes immediately below the market find considerable more balance between Call and Put open interest. So, one naturally looks for the level at which wide disparity (2x or more) exists between both sides, thus indicating where a floor likely is to be found...
435: 2,239 Call contracts vs. 3,631 Put contracts.
430: 2,926 Call contracts vs. 4,343 Put contracts.
425: 2,012 Call contracts vs. 3,053 Put contracts.
420: 3,850 Call contracts vs. 3,537 Put contracts.
415: 1,302 Call contracts vs. 3,194 Put contracts.
410: 380 Call contracts vs. 3,332 Put contracts.
405: 416 Call contracts vs. 2,575 Put contracts.
400: 711 Call contracts vs. 4,892 Put contracts.
A floor clearly lies somewhere above 415. However, this by no means portends an expiration week throttling. Indeed, there has been plenty of opportunity for this over the past two months, and yet not once has any significant challenge been made to the market's continuing advance.
Why not?
Because stocks are being distributed from strong hands to weak and, apparently, anything potentially upsetting the applecart is being delayed for as long as possible.
How do we know this is true?
In a word ... volume. Shares are not increasingly being offered up for sale as prices extend upward. Rather, they are being held ... likely in hope of higher prices still. Given last year's spectacular collapse this is little surprise on two counts.
First, and most obviously intuitive, is simply the matter of resignation, and the paralyzing effect last year's financial whipping had on the long side of the trade. Now that recovery has begun, why not hold out?
Such thinking, indeed, dovetails into the second reason to hold: namely, increasing belief that the March '09 bottom marks the start of a new bull market. By the very magnitude of last year's decline this is not at all an unreasonable assumption. However, the tenor of the market's advance since March belies its likelihood.
The problem with the present rationale for holding long positions simply lies in the manner in which it defies the fact that, the market climbs a wall of worry.
Talk is cheap. "Worry" in the stock market is measured in dollars and cents, and registered via selling that neither hesitates to lock in profits, nor shudders to cut losses.
The stock market's wall of worry is laid bare for all to see with increasing volume of shares exchanged while prices advance. If worry is not made abundantly apparent in the volume of shares offered up for sale, then it ought be through the increasing purchase of Put options hedging long positions.
On both counts the market's advance off March '09 bottom is proving a miserable failure.
What's more, there are players who recognize this, too. Although their voices can be heard citing diminishing volume, their expressed sense of danger still seems rather muted. Among this group the consensus appears convinced that, although a correction is due, bottom nevertheless is in.
Could there be a more telling backdrop to the prospect for a dizzying capitulation?
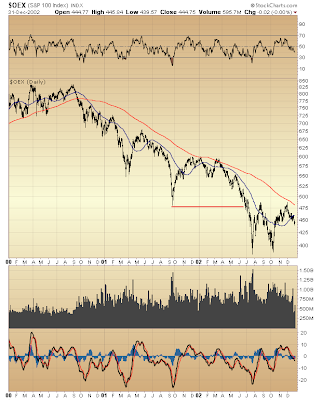
You can be fairly certain that, once the March '09 low is violated an avalanche of shares likely will hit the market, because the promise of better days will then be broken. There simply will be no good reason to continue holding long positions were hope resting on the bear market's end made baseless.

This was true in the summer of 2002 and it likely will be true again if March '09 bottom is taken out.
Whether this, indeed, comes to pass appears less a question of "if," but rather of "when." Everything both fundamentally and technically continues building toward this end...

* * * * *
© The Risk Averse Alert — Advocating a patient, disciplined approach to stock market investing. Overriding objective is limiting financial risk. Minimizing investment capital loss is a priority.
Analysis centers on the stock market's path of least resistance. Long-term, this drives a simple strategy for safely investing a 401(k) for maximum profit. Intermediate-term, investing with stock index tracking-ETFs (both their long and short varieties) is advanced. Short-term, stock index options occasionally offer extraordinary profit opportunities when the stock market is moving along its projected path.
Nothing is set in stone. Nor is the stock market's path of least resistance always known. More often than not, there are no stock index option positions recommended.
 There's an easy way to boost your investment discipline...
Get Real-Time Trade Notification!


