Whether or not the stock market's bottom is in (right now, I believe it probably is), there's little doubt the path of least resistance over months ahead points higher.
So, allow me to present a brief view substantiating this outlook. And in the process let's get a better sense of where the market's projected turn higher is poised to meet serious resistance ... at least for a time.

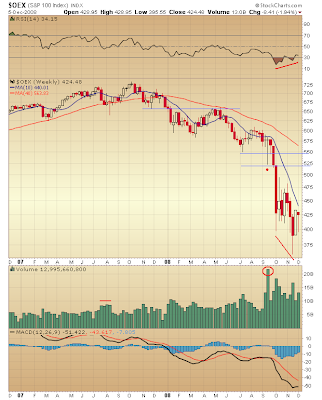
First, there simply can be no disputing the market's deeply oversold condition. RSI and MACD testify to this. Furthermore, the price-RSI divergence that developed as the S&P 100 sank to a new low in November '08 supports the case bottom is at hand. MACD's turn higher also does the same.
So, where now?
What really stands out is the volume of shares traded during the week in mid-September '08 when Lehman Brothers failed. Well over 20 billion shares changed hands. It's a good bet a vast majority are underwater. Many who bought stocks that week are showing big losses.
As you can imagine, then, more than a few longs probably are quite nervous about financial conditions remaining extraordinarily tenuous. Surely, many holders will be happy to get out even. In fact, this probably is the safest bet in history!
Thus, the S&P 100 could see significant resistance as it rises toward the range of 520-550.
That said, though, we should not assume any upcoming counter-trend rally will unfold just like during the January - May '08 period. Indeed, the Elliott Wave Principle's "Rule of Alternation" advises against this. So, consider the markup drawn on the above chart identifying resistance levels as a way of isolating price action in the prior period so as to show what not to look for in the current period.
Now, initially the market's counter-trend rally might develop in a manner similar to the January - May '08 period. Resistance — selling pressure — in the vicinity where the market's steep slide took flight (OEX 520-550) is likely for the reason just mentioned. Beyond this, however, we should expect something entirely different to subsequently unfold.
Over the months ahead an advance substantially recovering losses sustained this year should take shape. Could price form be like what followed the July-August '07 sell-off? Obviously, it is impossible to say. For the time being let's just defer to the S&P 100 chart published on October 9th for some sense about where the market's path of least resistance might lead.
Fundamentally Speaking
One simply should not ignore the determined effort the nation's Monetarist Monkey twins, Paulson and Bernanke, are making in concert with their European counterparts in the hope of preventing the global financial system from spiraling into oblivion.
(Forget about ample historical evidence suggesting we are willfully inviting a hyperinflationary blowout. So, then, in principal the global financial system already is dead.)
The investment question simply is whether some competitive financial advantage can be gained in the current environment. Lord knows stock prices have been beaten down and, relatively speaking, find extraordinary opportunities waiting to be exploited.
 One indication of just how much relative value presently is locked up in the stock market recently was brought to my attention in a four page report published by PIMCO's Bill Gross. In it he mentions the "q Ratio," which measures the value of the stock market relative to the replacement cost of net assets.
I had forgotten about "Q" ... or, more accurately, I haven't looked at it for several years. I was first introduced to this measure of the stock market's relative value back in 2000 when I read the book, "Valuing Wall Street — Protecting Wealth in Turbulent Markets."
Indeed, the q Ratio was one reason why I was so bearish back in 2000. On page 2 of Bill Gross' "Dow 5,000 Redux" report you can see why. It really was a classic "no brainer."
Right now, "Q" is challenging levels last seen in the late-'80s. As you can imagine, money managers like Bill Gross are licking their chops (albeit cautiously).
So, fundamentally speaking, given a wall of money and a stock market possessing a good deal of relative value, it appears the risk-averse investor is well-advised to regard fearsome circumstances with cautious trepidation and, instead, take the road less traveled in recognition of potential opportunity on the long side of the trade...
* * * * *
© The Risk Averse Alert — Advocating a patient, disciplined approach to stock market investing. Overriding objective is limiting financial risk. Minimizing investment capital loss is a priority.
Analysis centers on the stock market's path of least resistance. Long-term, this drives a simple strategy for safely investing a 401(k) for maximum profit. Intermediate-term, investing with stock index tracking-ETFs (both their long and short varieties) is advanced. Short-term, stock index options occasionally offer extraordinary profit opportunities when the stock market is moving along its projected path.
Nothing is set in stone. Nor is the stock market's path of least resistance always known. More often than not, there are no stock index option positions recommended.
 There's an easy way to boost your investment discipline...
Get Real-Time Trade Notification!


