My last Mr. Market Twitter today read, "If the market is near to a sharp bounce, 555-560 appears a probable OEX objective. Looks like it'll be Monday."
The following S&P 100 chart shows how I came up with that objective.
You also see a framework for comparing the S&P 100's current decline to its late-December 07 through mid-January '08 decline. It stands to reason all waves down thus far since the May 19, 2008 peak are larger than those that unfolded in that prior period. It's an Elliott Wave thing.
Updated S&P 100 Elliott Wave Count

About the possibility the market might be about to bounce sharply higher...
I noted in my "Sanity Check" how the slow descent of the S&P 100's daily RSI might appear similar to late-2005. There is one critical difference I failed to mention, though. Previously, the market was in the midst of advancing. Now, it is in the midst of a prolonged decline.
So, whatever similarity there might be now to late-2005 probably is more likely to resolve in a way fitting with present circumstances. In other words, maybe any upcoming bounce portends wave 4 (not shown) of the S&P 100's present move lower from its May 19, 2008 peak.
Much as I indicated above, we should expect this yet-to-unfold wave 4 to be of larger magnitude than the corresponding wave 4 that unfolded early-January '08. This might be all any bounce amounts to ... and as happened late-2005 the market will continue moving lower (this time, though, tracing out wave 5 ... and rivaling January's?).
First, though, the S&P 100 is set to complete wave 3. This should be done once the index sinks to the 555-560 area. I will be significantly reducing my July OEX Put position then.
NYSE Advances-Declines

There's a reason for the S&P 100 Elliott Wave count you saw above. It is fitting an extreme in NYSE stocks declining versus advancing should occur during "the third wave of a third wave." Wave iii of 3 largely unfolded on Thursday, June 26, 2008, the day the widest differential was registered between advancing and declining issues traded on the NYSE.

Here's a closer view of the same, declining S&P 100 channel targeting the area of 555-560.
You should note in the S&P 100's daily chart above I did not yet label wave iv of 3. It's possible we could see one more push higher — something like Wednesday, June 25, 2008 — before wave iv of 3 is complete.
This might slightly impact the target for wave v of 3. Wave 3's target might then be raised to the 560-565 range.
Obviously, I would prefer this did not happen. We should know early enough on Monday when and where wave 3 should be completed.
S&P 100 Bullish Consensus

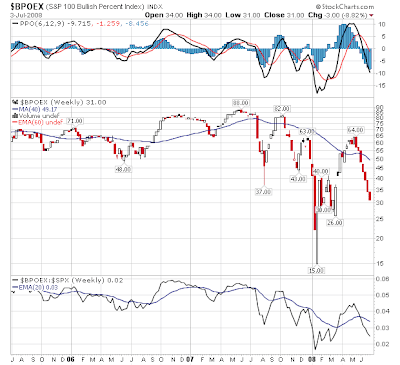
I find it interesting the S&P 100's Bullish Consensus remains above levels set at the March 17, 2008 low, particularly since the S&P 100 is presently trading below that low.
I do not consider this circumstance as representing some meaningful, bullish divergence. Rather, it suggests there's lower to go, much as my Elliott Wave count indicates.
Still, some bullish divergence might occur here just prior to the market embarking on its melt-up some weeks from now.
By the way, I would have to say the ultimate, 520, downside target in the S&P 100 still remains very much alive. The big question in my mind is whether this target largely could be reached prior to July expiration (7.18.08).
Much of January's crushing decline occurred during options expiration week. I'm just pointing this out, and not suggesting history is about to repeat. But it could.
Nevertheless, the possibility 520 could be reached prior to July expiration does not change my outlook toward the July OEX Put positions I presently hold. Once wave 3 ends I want out. I'll deal with waves 4 and 5 later...
* * * * *
© The Risk Averse Alert — Advocating a patient, disciplined approach to stock market investing. Overriding objective is limiting financial risk. Minimizing investment capital loss is a priority.
Analysis centers on the stock market's path of least resistance. Long-term, this drives a simple strategy for safely investing a 401(k) for maximum profit. Intermediate-term, investing with stock index tracking-ETFs (both their long and short varieties) is advanced. Short-term, stock index options occasionally offer extraordinary profit opportunities when the stock market is moving along its projected path.
Nothing is set in stone. Nor is the stock market's path of least resistance always known. More often than not, there are no stock index option positions recommended.
 There's an easy way to boost your investment discipline...
Get Real-Time Trade Notification!


