I do believe we little ones are about to collect big on our tiny wager betting on a seeming long-shot ... that is, once someone asking, "Where's my money," bloodies that smart aleck dog, Wall Street.
Might some real-life "Stewie" be the British Bankers' Association, which on Friday releases its initial report reviewing the LIBOR system? Could this raise suspicions of financial fraud within the banking industry to frightening proportions?
I got the search warrant out looking for anything suggesting whether today's [anticipated] advance presented a problem. I might as well have been looking for a mango grove on Antarctica.
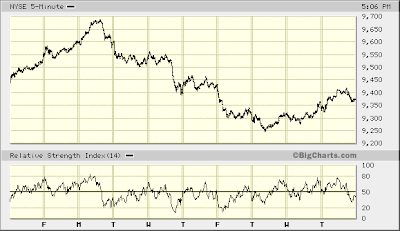
On Tuesday I suggested index price targets that, "would work for me ... with or without some sort of RSI divergence signaling a completion of the presently unfolding, counter-trend rally."
We hit those targets today...

For the NYSE Composite I indicated the area of 9400-9450 ... and Bingo was his name-o.

And for the NASDAQ Composite I said 2505-2520 would work for me...
"For assuredly, I say to you, whoever says to this mountain, ‘Be removed and be cast into the sea,’ and does not doubt in his heart, but believes that those things he says will be done, he will have whatever he says."
(And I have neither once cursed a fig tree nor a money tree!)

As you can see, the chart of the S&P 100 to which I applied an Elliott wave count yesterday did not unfold as I had suggested it might. Now you should understand why I choose not to glaze over your eyes covering this stuff. The Elliott Wave Principle simply is far too flexible an analytical tool — extremely useful as it is — to go into all the details highlighting [finite] possibilities.
Besides, it's a lot easier quoting Christian Scriptures.
That said, though, I highly recommend you learn the Elliott Wave Principle. You could, for example, not only better analyze "the stock market," but also look at a chart of, say, Microsoft and see why it probably is about to fall from $28 to somewhere in the mid-teens.
(My apologies to the cast of CNBC's Fast Money. They've been persistently pumping the creator of the Vista operating system ... and, not only am I an unhappy user, I see with my own eyes MSFT might just be perfectly poised to break lower than it has traded in the past ten years.)
Getting back to the S&P 100 ... take a look at price-RSI action on the chart above from late Monday, 5.19.08 (the day the index topped and turned over, beginning what I believe will be its much anticipated meltdown) through mid-day Wednesday, 5.21.08.
Note how RSI generally remained biased to the sell-side (i.e. below 50) and was seemingly improving — appearing to diverge — while the S&P 100 continued moving lower. Then came Wednesday's (5.21.08) afternoon thud.
Now, take a look at this...

It's the chart of the S&P 100 over the past ten days plotted at one-minute intervals (the prior chart is plotted at five-minute intervals).
You see a similar price-RSI performance late this afternoon after the index topped and turned over going into the close. This could mean the bounce off last week's decline is over. The S&P 100 appears poised to move lower on Friday.
Also notice how near today's top RSI reached a buy-side extreme not seen since the S&P 100 peaked on Monday, 5.19.08. This fine display of irrational exuberance is a fitting prelude to the market meltdown I believe is at hand.
Those on my list were notified of a trade I initiated today. CLICK HERE for instructions on how to receive real-time OEX trade notification, so you can follow along.
(Presented before the U.S. Senate Committee on Homeland Security and Governmental Affairs, May 20, 2008 ... If nothing else, read the first paragraph on page 4)
* * * * *
© The Risk Averse Alert — Advocating a patient, disciplined approach to stock market investing. Overriding objective is limiting financial risk. Minimizing investment capital loss is a priority.
Analysis centers on the stock market's path of least resistance. Long-term, this drives a simple strategy for safely investing a 401(k) for maximum profit. Intermediate-term, investing with stock index tracking-ETFs (both their long and short varieties) is advanced. Short-term, stock index options occasionally offer extraordinary profit opportunities when the stock market is moving along its projected path.
Nothing is set in stone. Nor is the stock market's path of least resistance always known. More often than not, there are no stock index option positions recommended.
 There's an easy way to boost your investment discipline...
Get Real-Time Trade Notification!


