Sometimes, you might try reading my commentary backwards, because given my remarks yesterday this is precisely how today's trading developed.
I thought trading today might begin with a sharp decline, and be followed by a retracement. Of course, this view largely was presented out of fear the NASDAQ Composite's position threatened my imminent stock market meltdown thesis.
Now, "imminent" is the operative word here. Up until today I suspected the stock market was within hours of seriously breaking down. I no longer think this is likely. However, have no fear. "Imminent" has been extended only by some days.
Today's trading in no way alters my forecast for a pending mini-collapse decidedly taking out the March 17, 2008 low.
Furthermore, the stock market is not very likely to run away to the upside from here either ... before it falls apart like Senator Geary at Fredo's house of ill repute. Let me elaborate...

You can see how the CBOE Put/Call Ratio is positioned similarly to where it stood near the stock market's top last October '07. So, add this to the view showing the NYSE and NASDAQ McClellan Oscillators likewise positioned similarly.
All things point to the stock market being very near an important top.
Look ... what we have here is a classic case of the way the stock market extends its move in a given direction ... almost as if it were purposely defying a growing wealth of evidence plainly showing it is at risk of reversing course. This is just the way the game goes. It is one of the most well-known facts about investing in the stock market. It also is a truth most frequently overlooked.
Let's zero in on some points of interest in light of the stock market's advance this week. Then, we'll take a longer view and try developing some better sense of what we might expect before all Hades breaks loose...

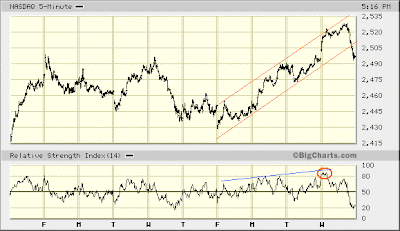
The thing I find interesting about the NASDAQ Composite's advance since last Friday (5.9.08) is how RSI confirmed the index's rise every step of the way, right through today. You don't usually see that. Typically during an index's third and final leg up within a discrete advance (here, unfolding yesterday and today) RSI will fall short of the level it reached during the second leg up (which unfolded Monday, 5.12.08).
So, what is this atypical RSI performance suggesting?
Well, the NASDAQ, the preferred market for boiler rooms all across America (I love saying that), apparently possesses a noteworthy measure of underlying buy-side strength. RSI probably is signaling the NASDAQ Composite has farther to rise.
Thus, there's more still to unfold in the stock market's drawn out advance off the March 17, 2008 low ... before the bottom falls out.

You see a little different picture here. In fact, the NYSE Composite is in a position a lot like the NASDAQ Composite on Monday — poised to rise, it appears, to a new, post-3.17.08 high. Today's burst resulted in the NYSE Composite's RSI registering its highest reading since last Friday's (5.9.08) bottom. Just like I indicated above, this suggests the NYSE Composite, too, has farther to rise.
So be it. I am not at all concerned. Chances I am wrong and the stock market's melt-up is, instead, at hand are very, very slim. I am not even remotely compelled to entertain this possibility.

Looks like the May OEX contract open interest analysis I presented yesterday was spot on. But to be honest, I am not up to repeating the exercise today. With just two days until the May OEX contract goes off the board, I am not sure anything of value will come of it.
That said, though, here is something to chew on...
I want to entertain the possibility of initiating a "quick hit" position offering an opportunity to double an initial $500 stake.
What I am suggesting is, despite believing "the" ultimate top is some days away, we might take stock in the delay, wrap our brains around a possible scenario leading to that top, and find an occasion to make a quick $500 (or more). Thus, when it comes time for playing the stock market's mini-meltdown we can use the house's money right from the get-go.
Before I dive into a brief commentary on what might unfold over the days ahead, I should just let you know the methodology at the foundation of my analysis — the Elliott Wave Principle — affords the necessary measure of flexibility to know "when to say when" and when to say, "I'm not quite sure."
I am purposely trying not to tie you up in the details of this. I hope it will suffice that what passing reference I have made in the past to a "rising wedge" and an "irregular flat" forming since the March 17, 2008 low are the essence of what leads me to say right now, "I'm not quite sure; time will tell."
When I wrote, "Holy Sammy Davis," I put forward my sense an "irregular flat" had formed off the March 17, 2008 low in the S&P 100. This, I stated, canceled my previous view a "rising wedge" was taking shape — something that would require several more days of trading to complete.
Trading this week advises I return to this initial view. Although the NASDAQ Composite is the only index to reach new, post-3.17.08 high ground, it seems most prudent to suppose the boys and girls on Wall Street are going to continue milking this thing despite all appearances their effort will prove futile.
(Who knows. Maybe something good will come of it. Larry Kudlow could pop a vein in his head while pounding the table about, "Goldilocks," and drop dead on the CNBC set.)

Since this post is getting a bit long, I will briefly direct your attention to the area I circled above within the NYSE Composite's RSI. Quite simply, in the course of things to come over the next few days (give or take) RSI probably will fall below this circled reading (registered on Friday, April 11, 2008). In fact, I think we should expect this.
It is in the course of this move we might find an opportunity to execute a "quick hit" trade and double (or more) an initial $500 stake.
An RSI breakdown below the area I've circled, followed by a last-gasp, stock market advance that fails to carry RSI above its high registered on Tuesday, May 6, 2008 would represent the kind of technical divergence we should, indeed, expect at "the" top we have been patiently anticipating.
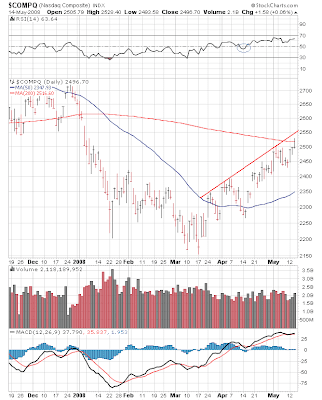
Finally, note how the NYSE Composite's 200-day moving average (above) seems to be presenting a bit of a roadblock...

Today, the NASDAQ Composite finally caught up to its 200-day moving average. And what do you know... it similarly appears to be presenting a roadblock to the index's further advance, too.
I hope I have not been too terribly dull today. I thought it might be useful going into a little more detail, considering how we are being frustrated and our patience is being tested.
Remain alert, grasshopper. At the risk of being repetitive I will say it again...
Nothing has changed the outlook for a mini-meltdown except knowing precisely when to say when.
* * * * *
© The Risk Averse Alert — Advocating a patient, disciplined approach to stock market investing. Overriding objective is limiting financial risk. Minimizing investment capital loss is a priority.
Analysis centers on the stock market's path of least resistance. Long-term, this drives a simple strategy for safely investing a 401(k) for maximum profit. Intermediate-term, investing with stock index tracking-ETFs (both their long and short varieties) is advanced. Short-term, stock index options occasionally offer extraordinary profit opportunities when the stock market is moving along its projected path.
Nothing is set in stone. Nor is the stock market's path of least resistance always known. More often than not, there are no stock index option positions recommended.
 There's an easy way to boost your investment discipline...
Get Real-Time Trade Notification!


