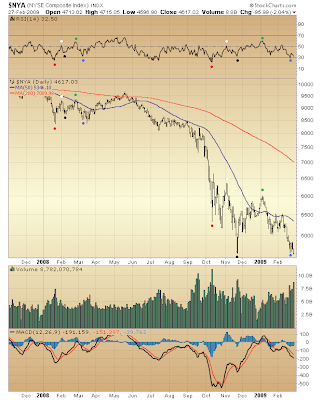
So, a record 1.9 billion shares of Citigroup changed hands today, nearly doubling its previous record for the number of shares exchanged in a single day. This while its price was wacked for a 40% loss. The previous record for Citi shares exchanged was set on ... drum roll ... November 21, 2008.
I point this out because today saw the highest volume of shares exchanged all year on the NYSE. This took me by surprise. I hadn't heard a thing about it all day on CNBC. Maybe I just wasn't paying attention. Looking into the reason I found it was all due to Citigroup.
Of course, today's bump in volume raises the question of whether some similarity to circumstances mid-September '08 suddenly has developed?
So, I ask myself. Did Citi file for bankruptcy (like Lehman Brothers), exposing a huge swath of liabilities throughout the financial system?
Nope.
Is Washington hoping to attract private risk capital or drive it away?
Well, Uncle Sam wouldn't be raising its Citi stake to 40% were it the latter. 1.9 billion shares of Citigroup were, in fact, bought today on the open market. Some apparently think Treasury's support at least means something. I agree.
That its life is being supported substantiates principle seeking stability. Of course, capital injections alone will not do. Nor will bottomless pits be filled. But it seems determination to bring stability is prerequisite to confidence returning. And yet how expensive are even these baby steps!
Short-term and intermediate-term the stock market appears to be bottoming.


As you can see underlying conditions, intermediate-term, are quite like they were back in early '03. Once again, NASDAQ is leading the way in forming a base. Do animal spirits once again sense opportunity?

RSI above highlights similarity in the NYSE Composite's bottoming process, now versus early '08. We also see similar volume characteristics comparing the two periods.
It is interesting to note how the index, itself, has behaved in the current period relative to the prior. Each step of the way during the current bottoming process the index has performed precisely in opposition to its performance previously. Even today, the NYSE Composite set a new, intra-day low, where as last March it failed to do so.
There probably is a bit more downside left to go before bottom finally is in. But it's near. This much seems clear.

Again, we see similar RSI performance coinciding with the NASDAQ Composite's bottoming process, now versus early '08. This time, though, NASDAQ is not setting new lows.
Here's something to think about... Whereas NASDAQ's performance last March might have been foretelling worse to come following its subsequent bounce (because in setting new lows, relative to January, waning animal spirits were being demonstrated), this time around it might be foretelling bottom set November '08 might likely hold up for months to come. In other words, following NASDAQ's upcoming bounce (which could carry the index upward of 2000-2200 before all is said and done) any renewed weakness likely will find support in the vicinity where the index presently trades.
A retest of current levels sometime over, say, the next year (following NASDAQ's upcoming bounce) certainly has reasonable probability. Just how this retest develops probably will have bearing on what subsequently follows. If in that retest we see something like last March, then levels seen last in 1994 might hang in the balance (following yet another bounce subsequent to retest). So, there in a nutshell is a prospective outlook for the next couple years or so.

As for the market's present leg down (likely the final), I have a sneaking suspicion this thing might be milked for everything it is worth. Dread. So, continue looking for technical divergences the likes of which I highlighted yesterday.
There are a few distinct possibilities as to how bottom might finally be reached. The markup drawn above presents a rough sketch of the boundaries within which trading over coming days might be confined. Whatever. Bottom is nearly at hand.
I can recall late last year speculating about prospects relating to the market's bottoming process. The thinking was it could take some months to develop. Turns out this has come to pass. Too bad I got sucked in by markedly improved underlying technical conditions going into the New Year. It'll all come out in the wash. My positive expectations await but bottom's confirmation sometime over the days straight ahead.

* * * * *
© The Risk Averse Alert — Advocating a patient, disciplined approach to stock market investing. Overriding objective is limiting financial risk. Minimizing investment capital loss is a priority.
Analysis centers on the stock market's path of least resistance. Long-term, this drives a simple strategy for safely investing a 401(k) for maximum profit. Intermediate-term, investing with stock index tracking-ETFs (both their long and short varieties) is advanced. Short-term, stock index options occasionally offer extraordinary profit opportunities when the stock market is moving along its projected path.
Nothing is set in stone. Nor is the stock market's path of least resistance always known. More often than not, there are no stock index option positions recommended.
 There's an easy way to boost your investment discipline...
Get Real-Time Trade Notification!


2 comments:
Hey TC,
Anon here.
I'm thinking we gap down big tomorrow, something like 30-50 points on S&P, maybe continue a steep fall, but then fill the gap in a big way.
We've gone down basically in a straight line from Jan 6 till now. I think this movement ends with a bang, not a whimper.
Thoughts?
Nevertheless, I am a big, ol' dirty bull right now.
And I am buying tons of C and will buy more at tomorrow's open.
Oh, I suppose there might be a bit of follow-through selling tomorrow at the open. But 30-50 S&P points? Not likely. As far as I am concerned, the greater risk here is a short squeeze of historic proportion.
Post a Comment