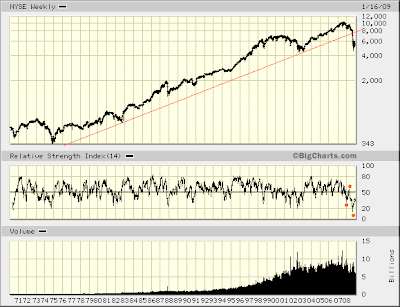
Even assuming a 5-wave decline unfolded from May 19, 2008 - November 21, 2008 ... what lies ahead is subject to possibilities I have yet to discuss.
To now I have been assuming the market's decline since October 2007 has taken the form of an (a)-(b)-(c) Elliott Wave "corrective" pattern. Wave (c), it is assumed, was formed by the 5-wave decline from May - November, 2008.
One reason I am assuming this particular Elliott Wave view ... and not one supposing wave (a) [beginning October 2007] might still be in the process of forming ... simply is due to the depth of damage done ... May - November, 2008 ... during the worst period in the stock market since the Great Depression.

Now, it is possible that, since October 2007, waves 1, 2 and 3 of wave (a) have formed. In this case waves 4 and 5 should be expected before wave (a) is completed.
You see above my typical markings distinguishing RSI extremes reached during the course of the NYSE Composite's three waves down since October 2007. Indeed, it is the relative depth to which weekly RSI sank in October 2008 bringing me to view the market's decline from May - November, 2008 as more appropriately labeled wave (c) [of an (a)-(b)-(c) decline from October 2007] rather than wave 3 of (a).
Yet, what if I am wrong? What if waves 4 and 5 of (a) are about to form?
Well, consider RSI analysis I detailed yesterday. Do you see how much weekly RSI might be expected to improve during the formation of wave 4 of (a)? It should rise above the level it reached in May 2008.
So, no matter what's to come — whether it's a rally countering the market's (a)-(b)-(c) decline from October 2007 ... or a more or less sideways trade forming wave 4 of (a) — we can expect weekly RSI to improve.
Still, even here, nothing is set in stone...
Assuming an (a)-(b)-(c) Elliott corrective wave [down] unfolded from October 2007 - November 2008, looking forward we can expect a counter-trend rally likewise taking an (a)-(b)-(c) form. Indeed, this is my preferred view right now.
Now, here's the thing. As this expected counter-trend rally unfolds wave (b)'s formation could lead to November's low being taken out. This, indeed, is a distinct possibility. Furthermore, this could even happen well-before weekly RSI recovers to levels last seen in May 2008.
It's something to keep an eye on.
And also something saying you should keep your head should it, in fact, come to pass. Any move below November's low preceding a substantial recovery in weekly RSI — one bringing RSI to levels last seen in May 2008 — likely will be followed by a screaming rally.
The BIG question right now is whether wave (a) of the market's (a)-(b)-(c) counter-trend rally (my preferred view right now) completed at the start of the New Year. I simply do not believe it has. There have been no telltale signs — technical divergences — to suggest there's trouble ahead.
* * * * *
© The Risk Averse Alert — Advocating a patient, disciplined approach to stock market investing. Overriding objective is limiting financial risk. Minimizing investment capital loss is a priority.
Analysis centers on the stock market's path of least resistance. Long-term, this drives a simple strategy for safely investing a 401(k) for maximum profit. Intermediate-term, investing with stock index tracking-ETFs (both their long and short varieties) is advanced. Short-term, stock index options occasionally offer extraordinary profit opportunities when the stock market is moving along its projected path.
Nothing is set in stone. Nor is the stock market's path of least resistance always known. More often than not, there are no stock index option positions recommended.
 There's an easy way to boost your investment discipline...
Get Real-Time Trade Notification!


