Let's pick up where we left off yesterday and look closer at the one thing bugging me about 5-minute RSI prior to yesterday's decisive reversal higher. My concern was that the market's decline since election day (11.4.08) might not yet be over. True as this still might be (because nothing is set in stone), I am less concerned about the likelihood.

Having noted that, "No price-RSI divergence registered prior to the market's turnaround" ... and concluding, "This is a bit unusual" ... I am today rather inclined to admit the lack of a price-RSI divergence at yesterday's bottom is in fact a reasonable development in light of Elliott Wave-related considerations.
To wit, this condition verifies the Elliott Wave count you see above (i.e. an "a-b-c" corrective wave)...
First, being that wave c is a third wave (typically the most dynamic), RSI coinciding with each of the [five unlabeled] sub-waves of wave c (shown by the blue dots) "fits" the character of a third wave. (A "c " wave is "a third wave" of what is generically termed a "corrective" formation in Elliott Wave parlance.)
Generally speaking, RSI registered during a fifth wave's formation will fall short of what registered during the preceding third wave's formation. This is true whether the market is rising or falling. The exception is when the five waves under consideration are, themselves, components of a larger third wave. In this instance RSI registered during the fifth wave might extend beyond what registered during the preceding third wave's formation (which is what happened in this case), rather than diverge, as is otherwise typical.
I simply did not recognize this yesterday.
Likewise, that RSI sunk to a lower reading during the formation of wave c than was reached during the formation of wave a confirms the Elliott Wave count I have assigned to the market's post-election day decline. Again, this is because a third wave — whether it be a component of an impulse wave or a corrective wave — typically is the most dynamic.
(Sorry if this means nothing to you. We Elliott Wave geeks get it.)
So, what does all this mean?
Quite simply, yesterday's turnaround (on notably improved volume) probably is the start of a nice bounce in the stock market's ongoing bottoming process. A move higher to the upper end of the trading range formed over the past month appears rather likely.

Finally, because 5-minute RSI registered its deepest sell-side reading at yesterday's bottom, this raises the probability the market's bottoming process will continue.
Presently, though, look for a pop higher. Following this, more gnashing of teeth.
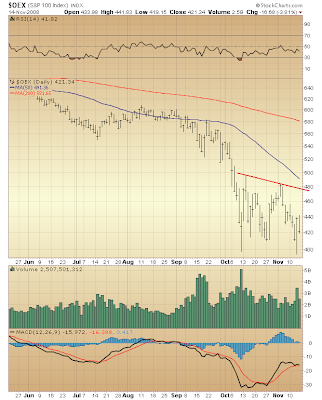
The line drawn on the above chart, connecting peaks in the past month's trading range, is more or less meaningless. However, if the market imminently rises as expected, the S&P 100's 50-day moving average should act as resistance.
Now, there might be a day or three of sideways trading before this anticipated surge higher unfolds. So, you should be aware of this, too...
If you were watching CNBC today, you probably saw colorful clips from Congressional hearings featuring testimony from Treasury's Neel Kashkari.
There's bi-partisan outrage against Secretary Paulson's about-face on how the TARP will be used. Clearly, Treasury's new intention is to leverage the $700 billion as greatly as possible. This is an attempt to get the biggest "bang for the buck."
Such is necessity in a world where the monetarist monkey battle cry for decades has been, "Inflate or Die!"
Such also is the grease that makes stock markets fly...

* * * * *
© The Risk Averse Alert — Advocating a patient, disciplined approach to stock market investing. Overriding objective is limiting financial risk. Minimizing investment capital loss is a priority.
Analysis centers on the stock market's path of least resistance. Long-term, this drives a simple strategy for safely investing a 401(k) for maximum profit. Intermediate-term, investing with stock index tracking-ETFs (both their long and short varieties) is advanced. Short-term, stock index options occasionally offer extraordinary profit opportunities when the stock market is moving along its projected path.
Nothing is set in stone. Nor is the stock market's path of least resistance always known. More often than not, there are no stock index option positions recommended.
 There's an easy way to boost your investment discipline...
Get Real-Time Trade Notification!


